

2018 cbre investor day Exhibit 99.1
Forward-Looking Statements This presentation contains statements that are forward looking within the meaning of the Private Securities Litigation Reform Act of 1995. These include statements regarding CBRE’s future growth momentum, operations, market share, business outlook, and financial performance expectations. These statements are estimates only and actual results may ultimately differ from them. Except to the extent required by applicable securities laws, we undertake no obligation to update or publicly revise any of the forward-looking statements that you may hear today. Please refer to our most recent quarterly report filed on Form 10-Q, and our most recent annual report filed on Form 10-K, and in particular any discussion of risk factors or forward-looking statements therein, which are available on the SEC’s website (www.sec.gov), for a full discussion of the risks and other factors that may impact any forward-looking statements that you may hear today.
We’re Changing Our Ticker CBRE will no longer trade as “CBG” Starting March 19th, CBRE is…

Strategy overview Bob Sulentic – President & Chief Executive Officer Financial Overview Jim Groch – Chief Financial Officer Digital & Technology overview Chandra Dhandapani – Chief Digital & Technology Officer, CBRE Sandeep Davé – Chief Digital & Technology Officer, Global Workplace Solutions CBRE Competitive Position Mike Lafitte – Global Group President Competitive position Case Study Whitley Collins – Global President, Advisory & Transaction Services 11:00AM to 11:15AM – Break Investment Businesses Ritson Ferguson – CEO, Real Estate Investment Businesses Occupier Outsourcing Bill Concannon – Global Group President & CEO, Global Workplace Solutions 12:15PM – Q&A 1:00PM – Lunch and departures Agenda
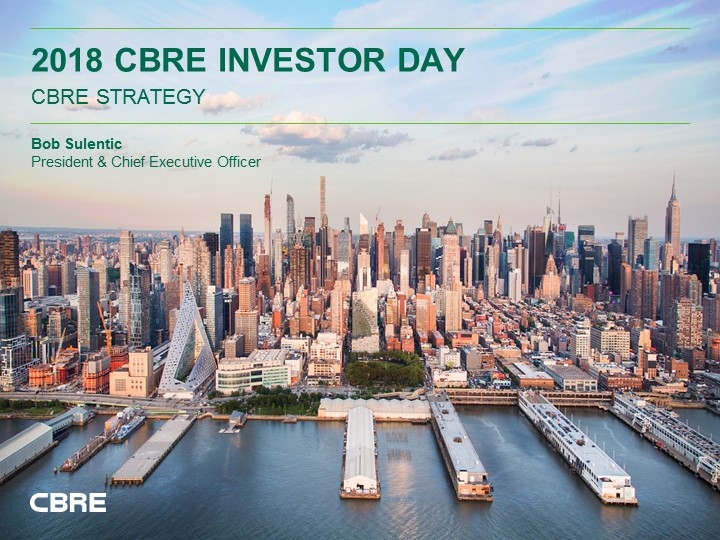
2018 cbre investor day CBRE Strategy Bob Sulentic President & Chief Executive Officer
2018 cbre investor day CBRE Financial overview Jim Groch Chief Financial Officer
CBRE is Positioned to Extend its Lead Industry-leading financial performance Growing into better balanced, more resilient, business Disciplined approach to capital allocation Differentiated capabilities to successfully deploy capital into acquisitions
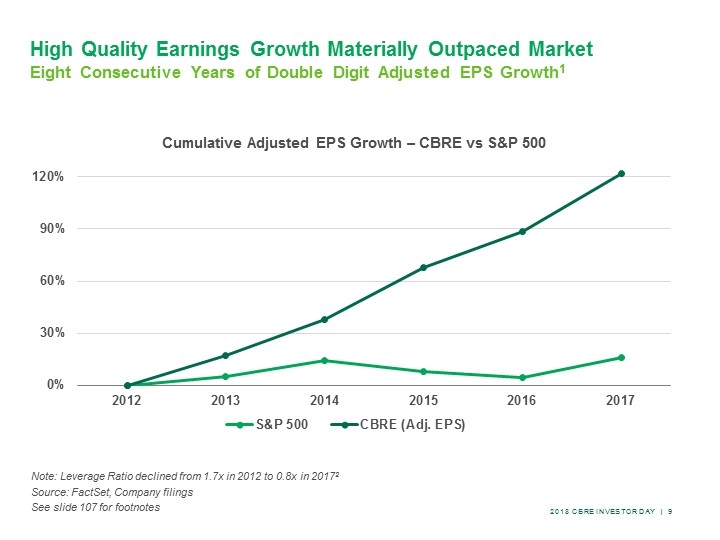
Note: Leverage Ratio declined from 1.7x in 2012 to 0.8x in 20172 Source: FactSet, Company filings See slide 107 for footnotes Cumulative Adjusted EPS Growth – CBRE vs S&P 500 High Quality Earnings Growth Materially Outpaced Market Eight Consecutive Years of Double Digit Adjusted EPS Growth1
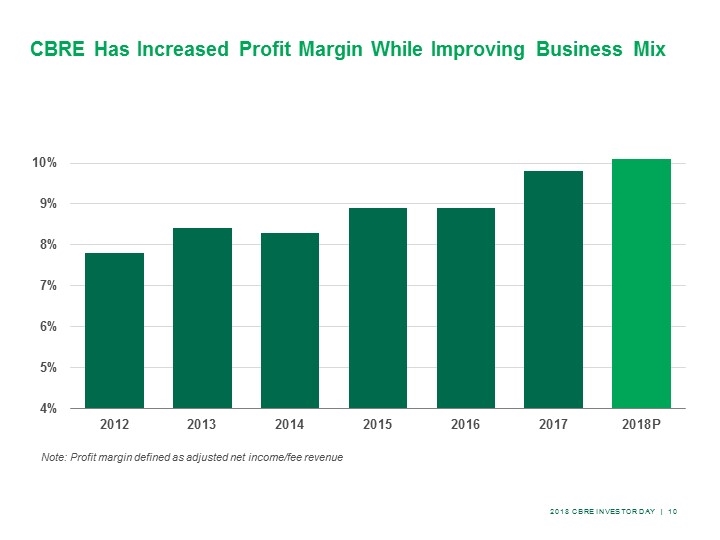
CBRE Has Increased Profit Margin While Improving Business Mix Note: Profit margin defined as adjusted net income/fee revenue
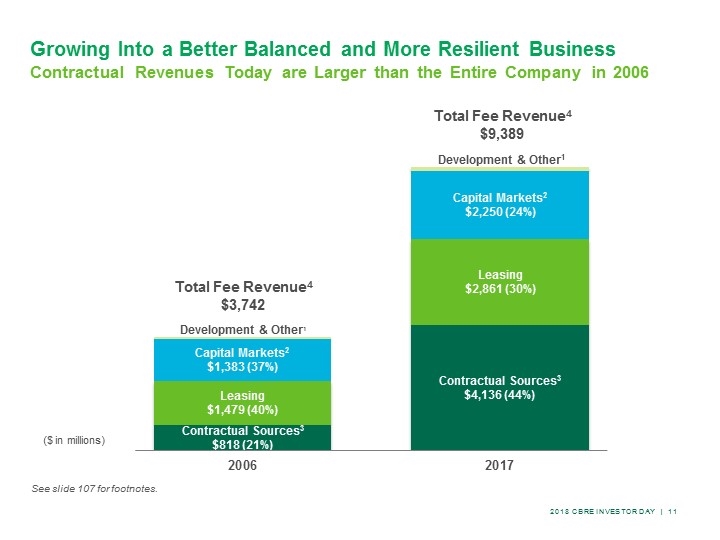
Growing Into a Better Balanced and More Resilient Business Contractual Revenues Today are Larger than the Entire Company in 2006 Total Fee Revenue4 $9,389 Total Fee Revenue4 $3,742 ($ in millions) See slide 107 for footnotes.
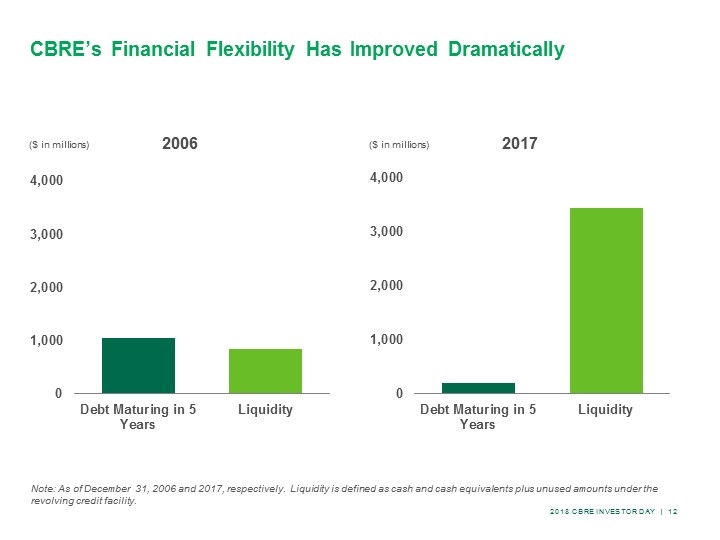
CBRE’s Financial Flexibility Has Improved Dramatically ($ in millions) ($ in millions) Note: As of December 31, 2006 and 2017, respectively. Liquidity is defined as cash and cash equivalents plus unused amounts under the revolving credit facility.
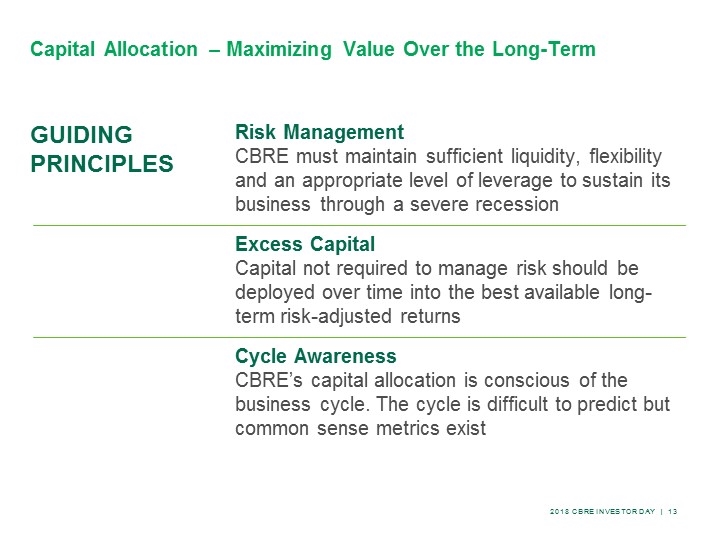
Guiding principles Risk Management CBRE must maintain sufficient liquidity, flexibility and an appropriate level of leverage to sustain its business through a severe recession Excess Capital Capital not required to manage risk should be deployed over time into the best available long-term risk-adjusted returns Cycle Awareness CBRE’s capital allocation is conscious of the business cycle. The cycle is difficult to predict but common sense metrics exist Capital Allocation – Maximizing Value Over the Long-Term
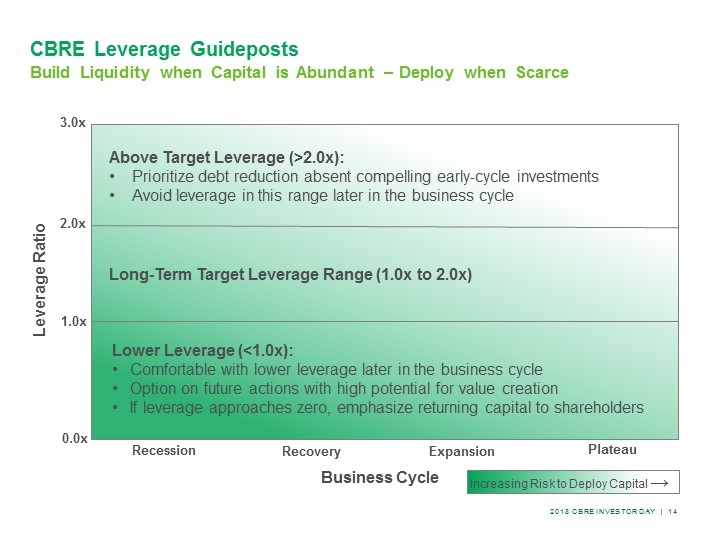
3.0x 0.0x 1.0x Leverage Ratio Recession Recovery Above Target Leverage (>2.0x): Prioritize debt reduction absent compelling early-cycle investments Avoid leverage in this range later in the business cycle Plateau Expansion CBRE Leverage Guideposts Build Liquidity when Capital is Abundant – Deploy when Scarce Lower Leverage (<1.0x): Comfortable with lower leverage later in the business cycle Option on future actions with high potential for value creation If leverage approaches zero, emphasize returning capital to shareholders Long-Term Target Leverage Range (1.0x to 2.0x) 2.0x Business Cycle Increasing Risk to Deploy Capital →
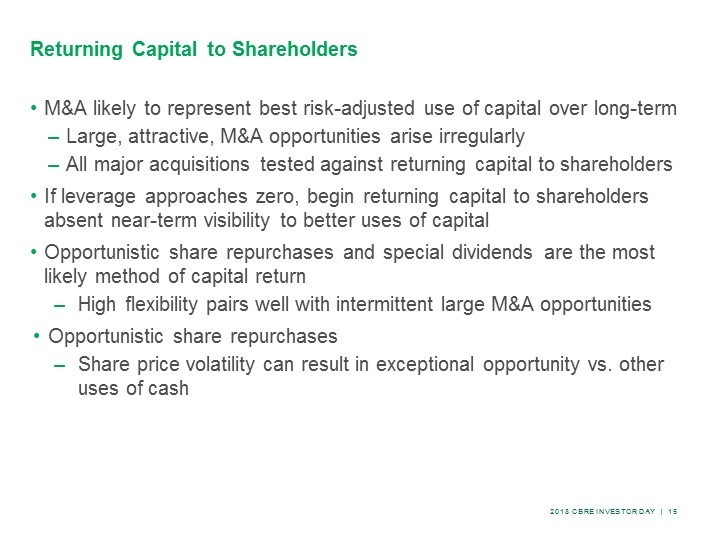
Returning Capital to Shareholders M&A likely to represent best risk-adjusted use of capital over long-term Large, attractive, M&A opportunities arise irregularly All major acquisitions tested against returning capital to shareholders If leverage approaches zero, begin returning capital to shareholders absent near-term visibility to better uses of capital Opportunistic share repurchases and special dividends are the most likely method of capital return High flexibility pairs well with intermittent large M&A opportunities Opportunistic share repurchases Share price volatility can result in exceptional opportunity vs. other uses of cash
CBRE Has Invested for Success in M&A CBRE Corporate Development is differentiated: Robust, high-level talent Reporting and compensation structures well aligned with shareholders Take pride in the deals we do and the deals that we don’t do Dedicated integration team Track-record speaks to CBRE’s differentiated capabilities
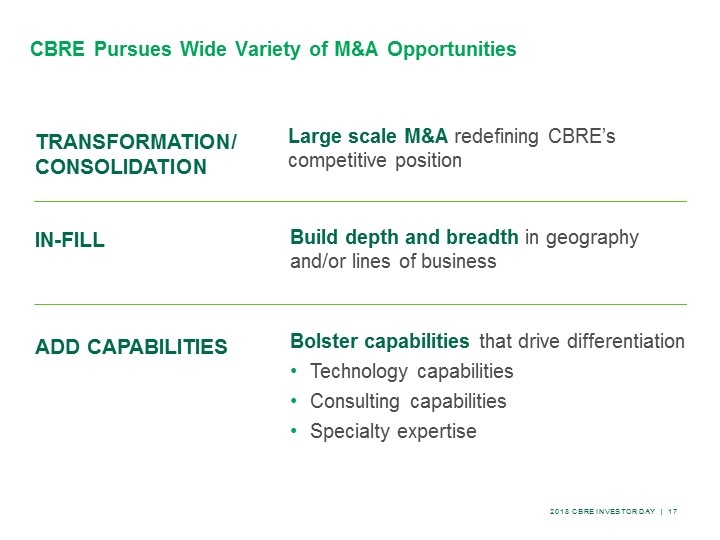
Transformation/ Consolidation Large scale M&A redefining CBRE’s competitive position In-fill Build depth and breadth in geography and/or lines of business Add Capabilities Bolster capabilities that drive differentiation Technology capabilities Consulting capabilities Specialty expertise CBRE Pursues Wide Variety of M&A Opportunities
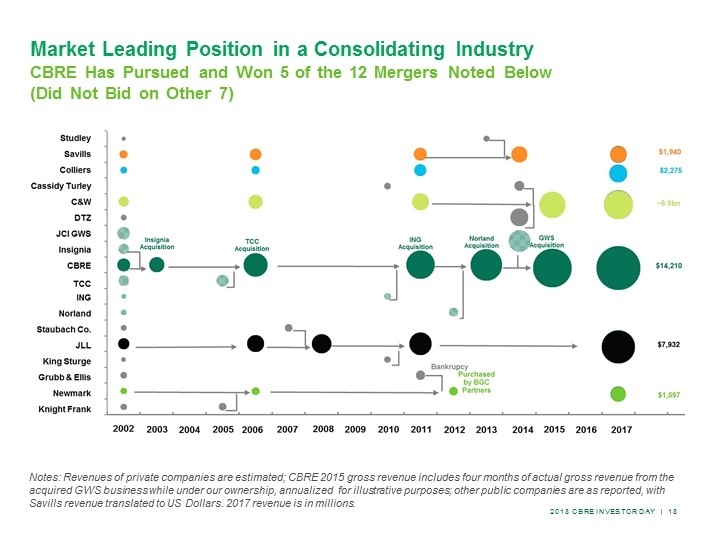
Market Leading Position in a Consolidating Industry CBRE Has Pursued and Won 5 of the 12 Mergers Noted Below (Did Not Bid on Other 7) Notes: Revenues of private companies are estimated; CBRE 2015 gross revenue includes four months of actual gross revenue from the acquired GWS business while under our ownership, annualized for illustrative purposes; other public companies are as reported, with Savills revenue translated to US Dollars. 2017 revenue is in millions.
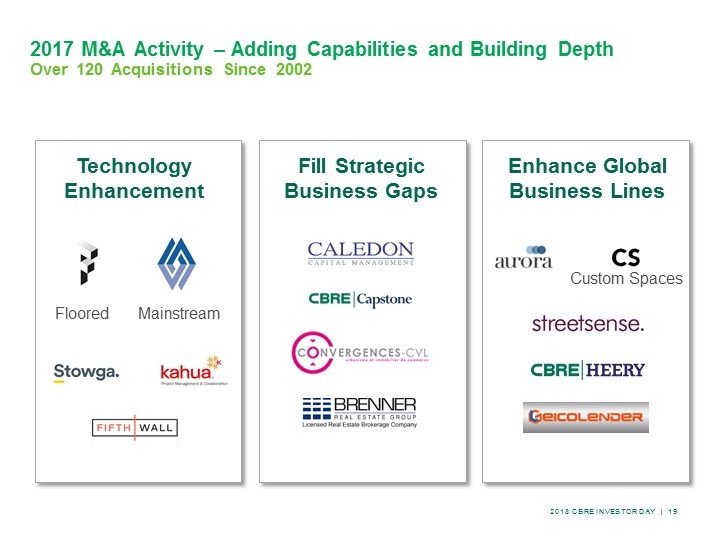
Technology Enhancement Fill Strategic Business Gaps Enhance Global Business Lines M Floored Mainstream 2017 M&A Activity – Adding Capabilities and Building Depth Custom Spaces Over 120 Acquisitions Since 2002
CBRE is Positioned to Extend its Lead Leads a services industry with strong structural tailwinds Disciplined approach to capital allocation Grown into a better balanced and more resilient business Proven record of successfully acquiring and integrating

2018 cbre investor day Digital & Technology Chandra Dhandapani Chief Digital & Technology Officer
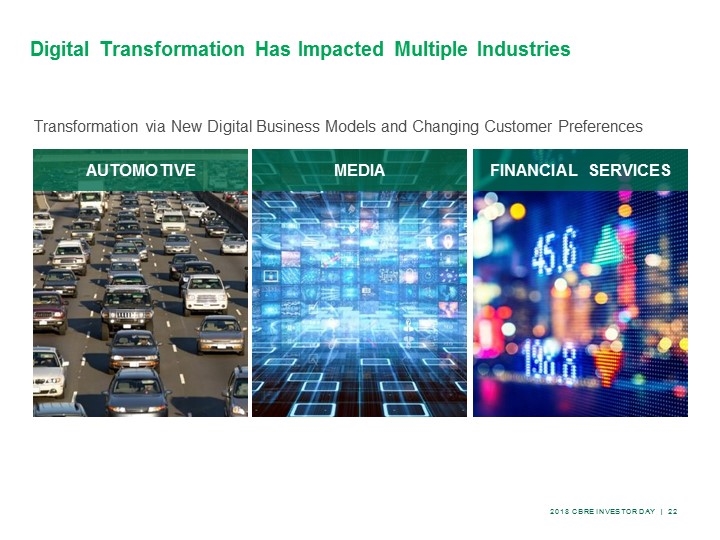
Transformation via New Digital Business Models and Changing Customer Preferences Digital Transformation Has Impacted Multiple Industries AUTOMOTIVE MEDIA FINANCIAL SERVICES
We Have Conducted a Comprehensive Global Digital Strategy Exercise on Opportunities & Risks We believe digital opportunities significantly exceed disruption risk Breadth and depth of domain expertise, global collaboration Significant research on emerging trends, fact based approach Risk and opportunity assessments for all lines of business and geographies
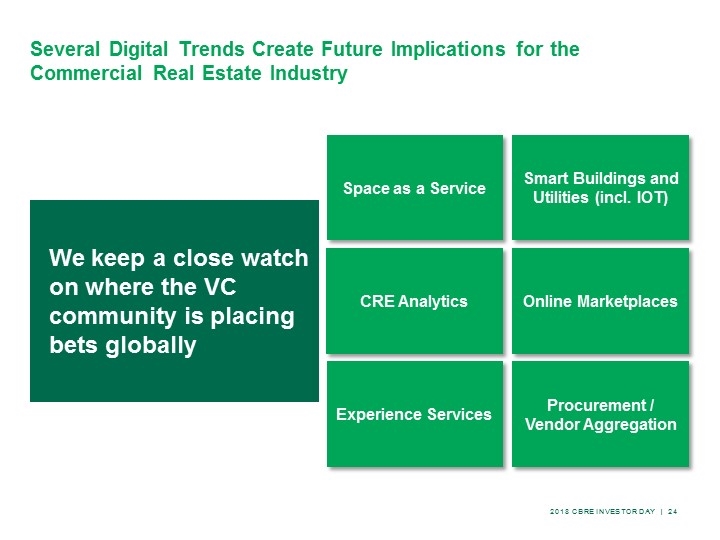
Experience Services CRE Analytics Procurement / Vendor Aggregation Online Marketplaces Space as a Service Smart Buildings and Utilities (incl. IOT) We keep a close watch on where the VC community is placing bets globally Several Digital Trends Create Future Implications for the Commercial Real Estate Industry
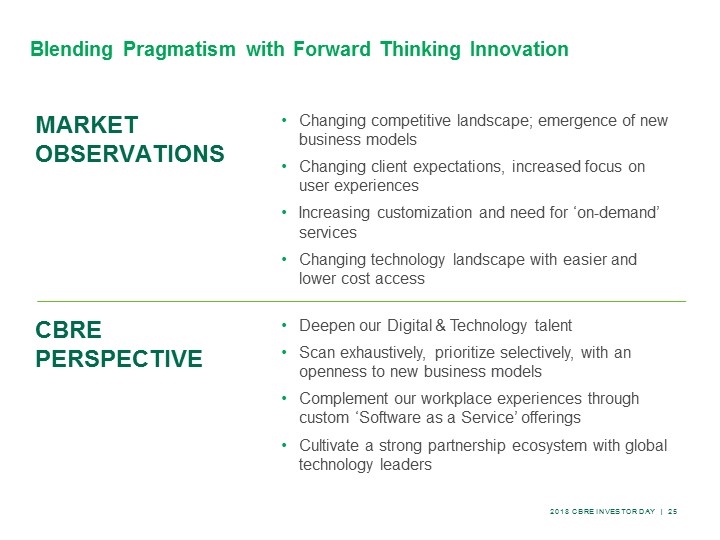
Blending Pragmatism with Forward Thinking Innovation Market Observations CBRE perspective Changing competitive landscape; emergence of new business models Changing client expectations, increased focus on user experiences Increasing customization and need for ‘on-demand’ services Changing technology landscape with easier and lower cost access Deepen our Digital & Technology talent Scan exhaustively, prioritize selectively, with an openness to new business models Complement our workplace experiences through custom ‘Software as a Service’ offerings Cultivate a strong partnership ecosystem with global technology leaders
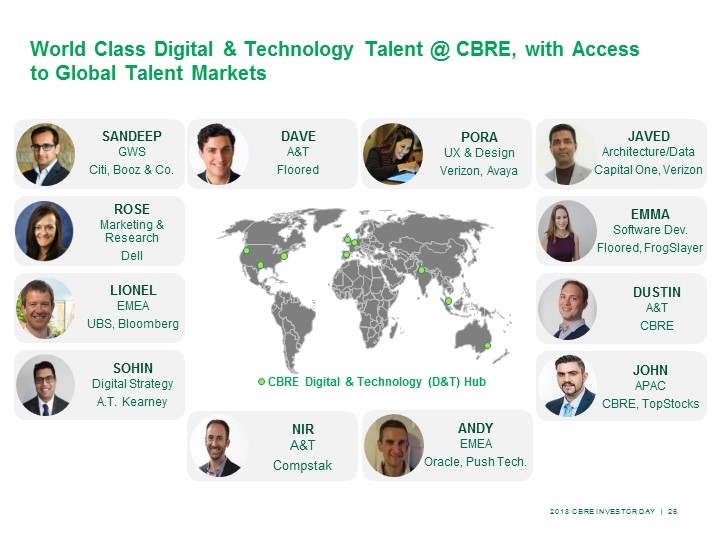
World Class Digital & Technology Talent @ CBRE, with Access to Global Talent Markets SANDEEP GWS Citi, Booz & Co. PORA UX & Design Verizon, Avaya LIONEL EMEA UBS, Bloomberg NIR A&T Compstak SOHIN Digital Strategy A.T. Kearney ANDY EMEA Oracle, Push Tech. CBRE Digital & Technology (D&T) Hub DAVE A&T Floored JAVED Architecture/Data Capital One, Verizon JOHN APAC CBRE, TopStocks EMMA Software Dev. Floored, FrogSlayer DUSTIN A&T CBRE ROSE Marketing & Research Dell
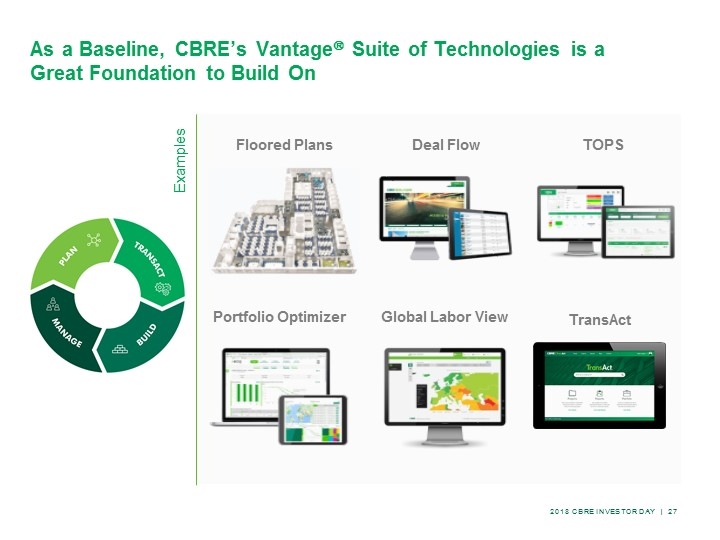
TransAct Deal Flow Global Labor View Floored Plans Portfolio Optimizer Examples TOPS As a Baseline, CBRE’s Vantageâ Suite of Technologies is a Great Foundation to Build On
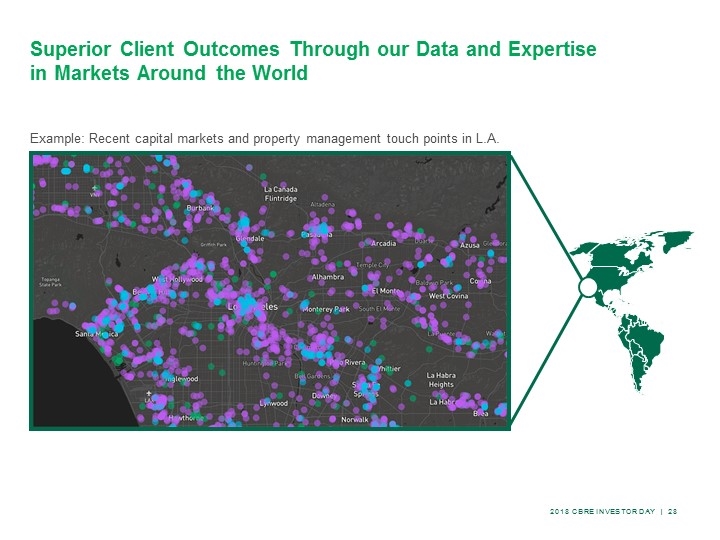
Example: Recent capital markets and property management touch points in L.A. Superior Client Outcomes Through our Data and Expertise in Markets Around the World
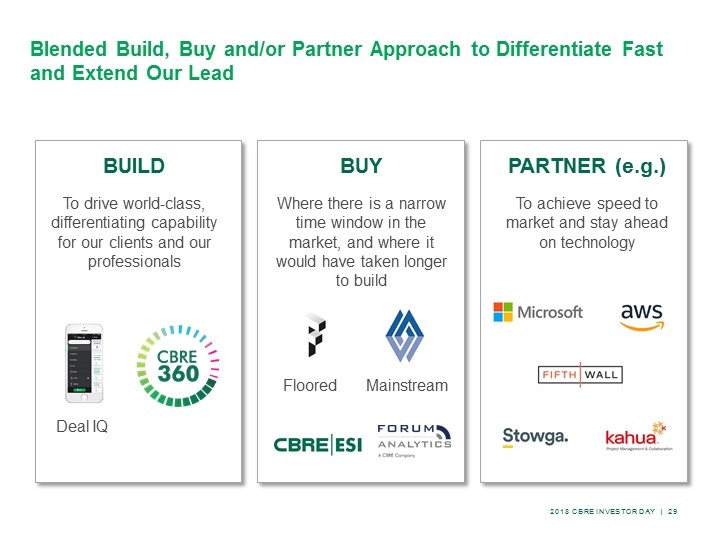
BUILD To drive world-class, differentiating capability for our clients and our professionals BUY Where there is a narrow time window in the market, and where it would have taken longer to build Deal IQ PARTNER (e.g.) To achieve speed to market and stay ahead on technology M Floored Mainstream Blended Build, Buy and/or Partner Approach to Differentiate Fast and Extend Our Lead

We Avoid the ‘Next Shiny Object’ Fascination

Great Talent and Design Thinking – Delivering Superior Client Outcomes CBRE 360 3-DAY ‘PROTOTHON’ DESIGN thinking, two week sprints, constant user feedback PLACING DIGITALLY SAVVY TALENT ACROSS THE ORGANIZATION
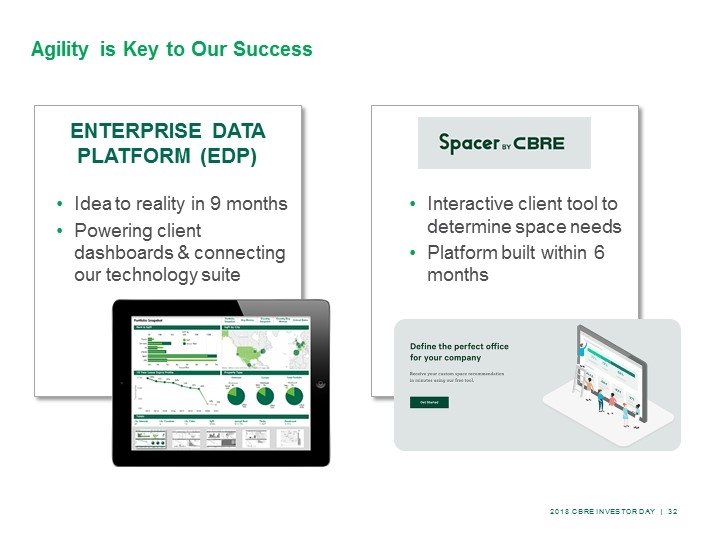
ENTERPRISE DATA PLATFORM (EDP) Idea to reality in 9 months Powering client dashboards & connecting our technology suite Interactive client tool to determine space needs Platform built within 6 months Agility is Key to Our Success
Against traditional competitors Against non-traditional competitors Digital strategy-led based on client needs Agile execution Technology strategy embedded in each line of business, connected globally Comparable in-house talent Capital to invest Superior services component Strong brand promise Well-Positioned to Win – Globally Connected Architecture and Locally Nimble Innovation

Technology showcase
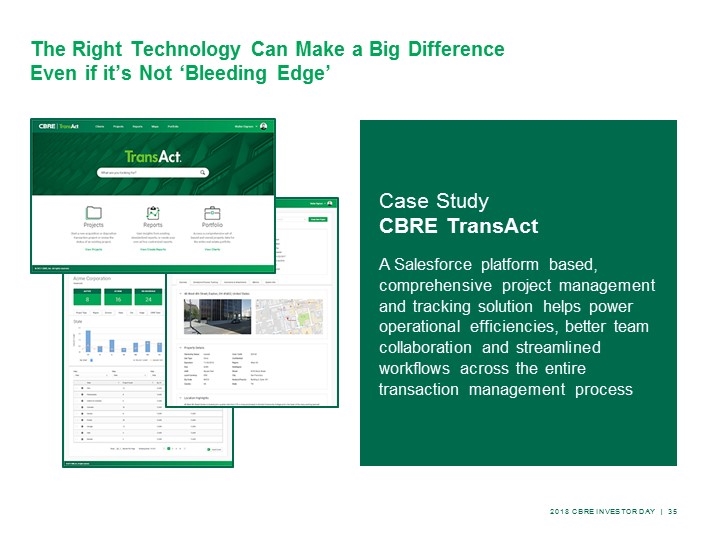
Case Study CBRE TransAct A Salesforce platform based, comprehensive project management and tracking solution helps power operational efficiencies, better team collaboration and streamlined workflows across the entire transaction management process The Right Technology Can Make a Big Difference Even if it’s Not ‘Bleeding Edge’
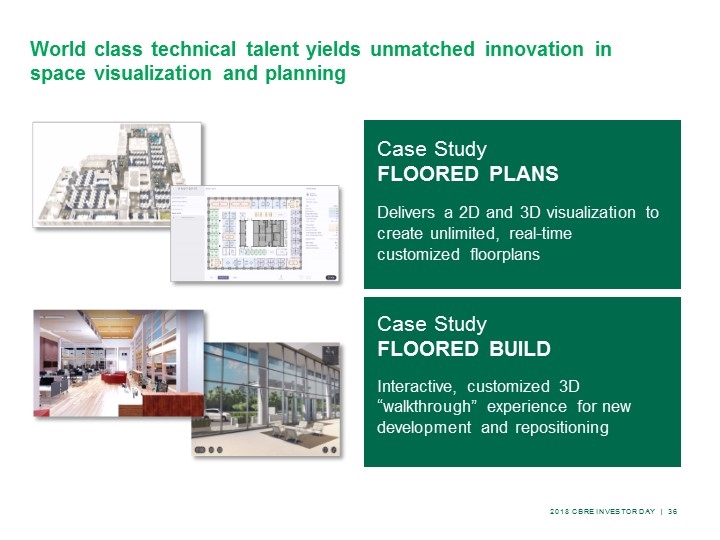
World class technical talent yields unmatched innovation in space visualization and planning Case Study Floored Plans Delivers a 2D and 3D visualization to create unlimited, real-time customized floorplans Case Study Floored BUILD Interactive, customized 3D “walkthrough” experience for new development and repositioning
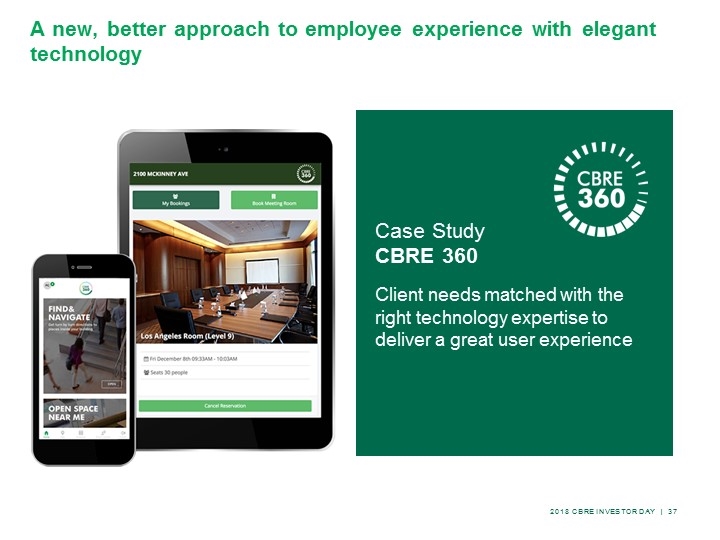
Case Study CBRE 360 Client needs matched with the right technology expertise to deliver a great user experience A new, better approach to employee experience with elegant technology
2018 cbre investor day CBRE competitive Position Mike Lafitte Global Group President
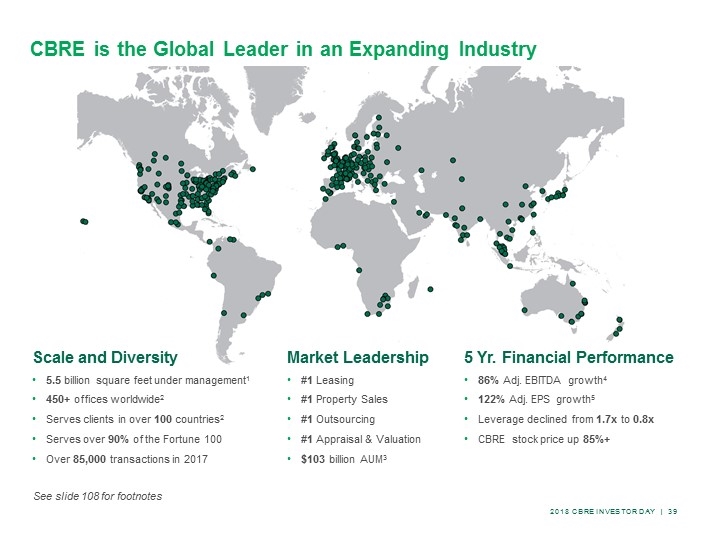
Market Leadership #1 Leasing #1 Property Sales #1 Outsourcing #1 Appraisal & Valuation $103 billion AUM3 Scale and Diversity 5.5 billion square feet under management1 450+ offices worldwide2 Serves clients in over 100 countries2 Serves over 90% of the Fortune 100 Over 85,000 transactions in 2017 See slide 108 for footnotes CBRE is the Global Leader in an Expanding Industry 5 Yr. Financial Performance 86% Adj. EBITDA growth4 122% Adj. EPS growth5 Leverage declined from 1.7x to 0.8x CBRE stock price up 85%+

CBRE is extending its competitive advantage
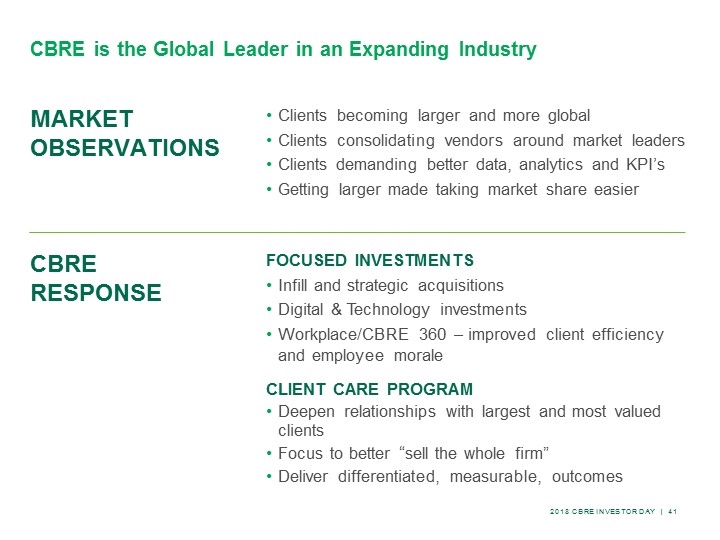
Market Observations Clients becoming larger and more global Clients consolidating vendors around market leaders Clients demanding better data, analytics and KPI’s Getting larger made taking market share easier CBRE RESPONSE FOCUSED INVESTMENTS Infill and strategic acquisitions Digital & Technology investments Workplace/CBRE 360 – improved client efficiency and employee morale CLIENT CARE PROGRAM Deepen relationships with largest and most valued clients Focus to better “sell the whole firm” Deliver differentiated, measurable, outcomes CBRE is the Global Leader in an Expanding Industry
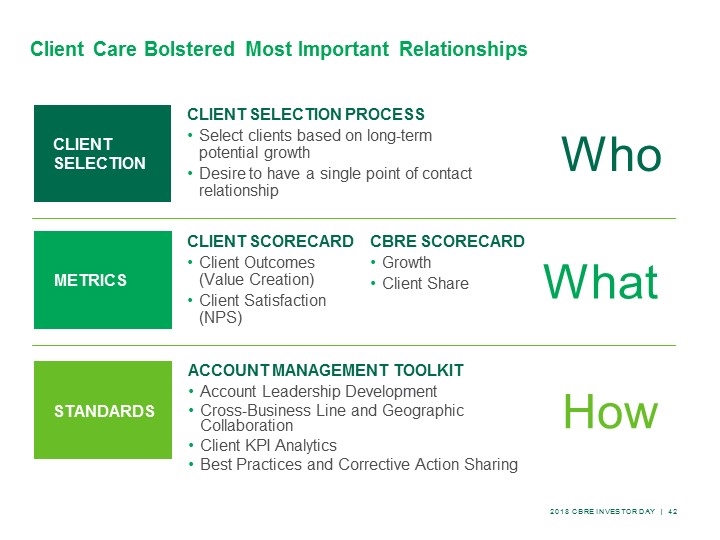
CLIENT SELECTION CLIENT SELECTION PROCESS Select clients based on long-term potential growth Desire to have a single point of contact relationship Who METRICS CLIENT SCORECARD Client Outcomes (Value Creation) Client Satisfaction (NPS) CBRE SCORECARD Growth Client Share What STANDARDS ACCOUNT MANAGEMENT TOOLKIT Account Leadership Development Cross-Business Line and Geographic Collaboration Client KPI Analytics Best Practices and Corrective Action Sharing How Client Care Bolstered Most Important Relationships
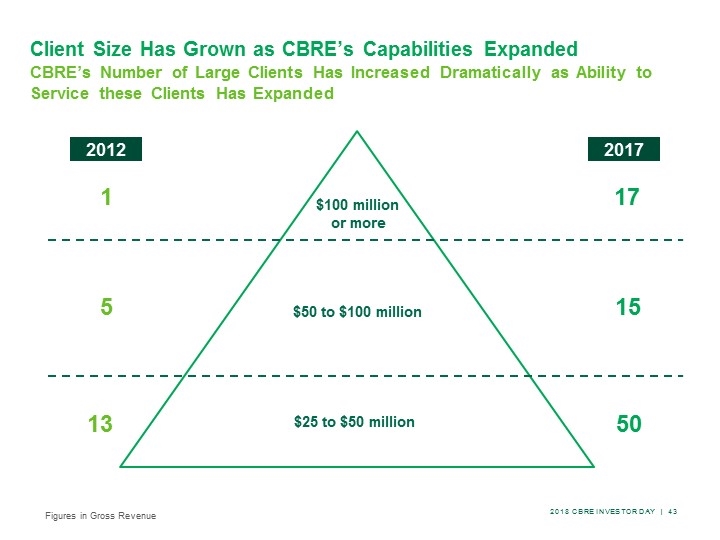
Client Size Has Grown as CBRE’s Capabilities Expanded CBRE’s Number of Large Clients Has Increased Dramatically as Ability to Service these Clients Has Expanded $100 million or more $50 to $100 million $25 to $50 million 2012 2017 13 50 5 1 15 17 Figures in Gross Revenue
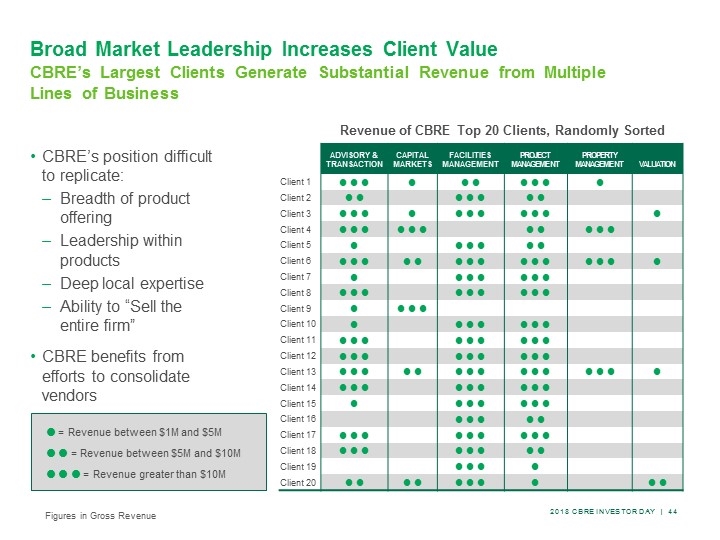
Advisory & Transaction Capital Markets Facilities Management Project Management Property Management Valuation Client 1 ˜ ˜ ˜ ˜ ˜ ˜ ˜ ˜ ˜ ˜ Client 2 ˜ ˜ ˜ ˜ ˜ ˜ ˜ Client 3 ˜ ˜ ˜ ˜ ˜ ˜ ˜ ˜ ˜ ˜ ˜ Client 4 ˜ ˜ ˜ ˜ ˜ ˜ ˜ ˜ ˜ ˜ ˜ Client 5 ˜ ˜ ˜ ˜ ˜ ˜ Client 6 ˜ ˜ ˜ ˜ ˜ ˜ ˜ ˜ ˜ ˜ ˜ ˜ ˜ ˜ ˜ Client 7 ˜ ˜ ˜ ˜ ˜ ˜ ˜ Client 8 ˜ ˜ ˜ ˜ ˜ ˜ ˜ ˜ ˜ Client 9 ˜ ˜ ˜ ˜ Client 10 ˜ ˜ ˜ ˜ ˜ ˜ ˜ Client 11 ˜ ˜ ˜ ˜ ˜ ˜ ˜ ˜ ˜ Client 12 ˜ ˜ ˜ ˜ ˜ ˜ ˜ ˜ ˜ Client 13 ˜ ˜ ˜ ˜ ˜ ˜ ˜ ˜ ˜ ˜ ˜ ˜ ˜ ˜ ˜ Client 14 ˜ ˜ ˜ ˜ ˜ ˜ ˜ ˜ ˜ Client 15 ˜ ˜ ˜ ˜ ˜ ˜ ˜ Client 16 ˜ ˜ ˜ ˜ ˜ Client 17 ˜ ˜ ˜ ˜ ˜ ˜ ˜ ˜ ˜ Client 18 ˜ ˜ ˜ ˜ ˜ ˜ ˜ ˜ Client 19 ˜ ˜ ˜ ˜ Client 20 ˜ ˜ ˜ ˜ ˜ ˜ ˜ ˜ ˜ ˜ Broad Market Leadership Increases Client Value CBRE’s Largest Clients Generate Substantial Revenue from Multiple Lines of Business CBRE’s position difficult to replicate: Breadth of product offering Leadership within products Deep local expertise Ability to “Sell the entire firm” CBRE benefits from efforts to consolidate vendors ˜ = Revenue between $1M and $5M ˜ ˜ = Revenue between $5M and $10M ˜ ˜ ˜ = Revenue greater than $10M Revenue of CBRE Top 20 Clients, Randomly Sorted Figures in Gross Revenue
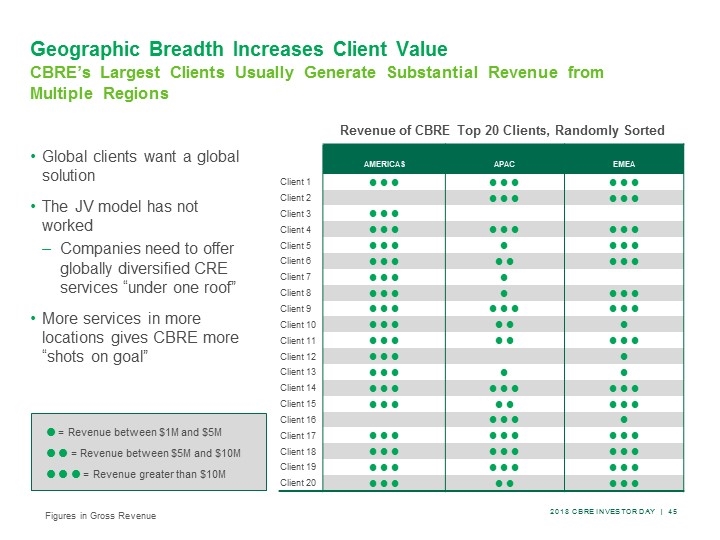
Geographic Breadth Increases Client Value CBRE’s Largest Clients Usually Generate Substantial Revenue from Multiple Regions Global clients want a global solution The JV model has not worked Companies need to offer globally diversified CRE services “under one roof” More services in more locations gives CBRE more “shots on goal” Americas APAC EMEA Client 1 ˜ ˜ ˜ ˜ ˜ ˜ ˜ ˜ ˜ Client 2 ˜ ˜ ˜ ˜ ˜ ˜ Client 3 ˜ ˜ ˜ Client 4 ˜ ˜ ˜ ˜ ˜ ˜ ˜ ˜ ˜ Client 5 ˜ ˜ ˜ ˜ ˜ ˜ ˜ Client 6 ˜ ˜ ˜ ˜ ˜ ˜ ˜ ˜ Client 7 ˜ ˜ ˜ ˜ Client 8 ˜ ˜ ˜ ˜ ˜ ˜ ˜ Client 9 ˜ ˜ ˜ ˜ ˜ ˜ ˜ ˜ ˜ Client 10 ˜ ˜ ˜ ˜ ˜ ˜ Client 11 ˜ ˜ ˜ ˜ ˜ ˜ ˜ ˜ Client 12 ˜ ˜ ˜ ˜ Client 13 ˜ ˜ ˜ ˜ ˜ Client 14 ˜ ˜ ˜ ˜ ˜ ˜ ˜ ˜ ˜ Client 15 ˜ ˜ ˜ ˜ ˜ ˜ ˜ ˜ Client 16 ˜ ˜ ˜ ˜ Client 17 ˜ ˜ ˜ ˜ ˜ ˜ ˜ ˜ ˜ Client 18 ˜ ˜ ˜ ˜ ˜ ˜ ˜ ˜ ˜ Client 19 ˜ ˜ ˜ ˜ ˜ ˜ ˜ ˜ ˜ Client 20 ˜ ˜ ˜ ˜ ˜ ˜ ˜ ˜ ˜ = Revenue between $1M and $5M ˜ ˜ = Revenue between $5M and $10M ˜ ˜ ˜ = Revenue greater than $10M Revenue of CBRE Top 20 Clients, Randomly Sorted Figures in Gross Revenue
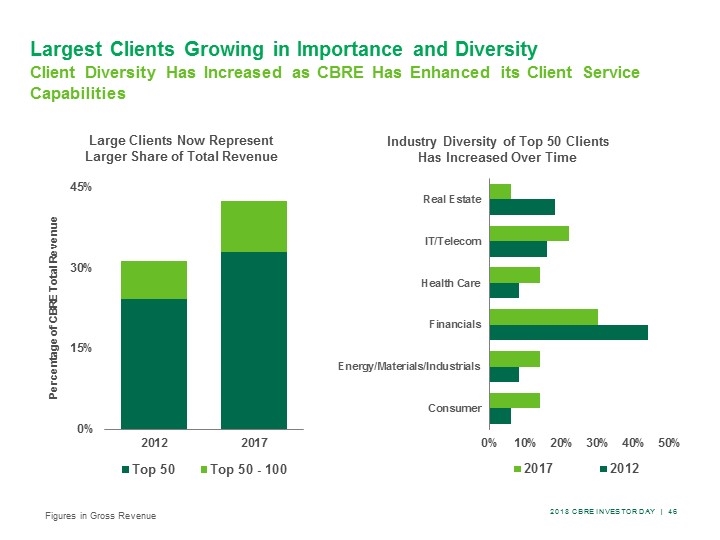
Largest Clients Growing in Importance and Diversity Client Diversity Has Increased as CBRE Has Enhanced its Client Service Capabilities Large Clients Now Represent Larger Share of Total Revenue Industry Diversity of Top 50 Clients Has Increased Over Time Percentage of CBRE Total Revenue Figures in Gross Revenue
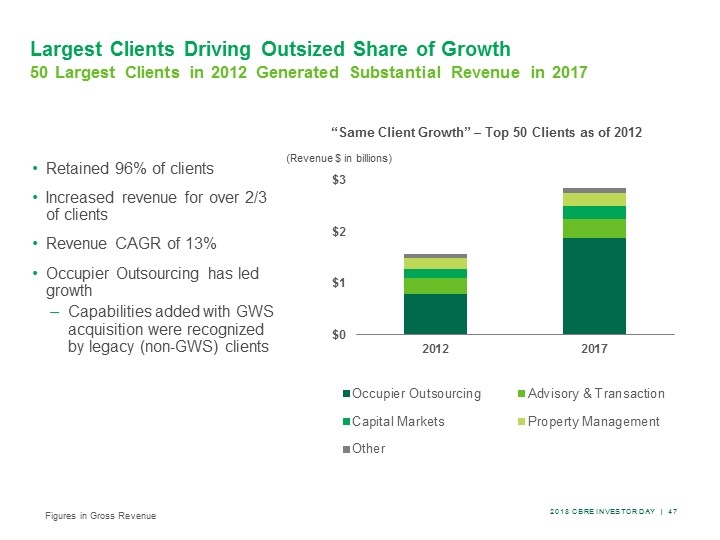
Largest Clients Driving Outsized Share of Growth 50 Largest Clients in 2012 Generated Substantial Revenue in 2017 Retained 96% of clients Increased revenue for over 2/3 of clients Revenue CAGR of 13% Occupier Outsourcing has led growth Capabilities added with GWS acquisition were recognized by legacy (non-GWS) clients (Revenue $ in billions) “Same Client Growth” – Top 50 Clients as of 2012 Figures in Gross Revenue
CBRE Generates Synergies across lines of business
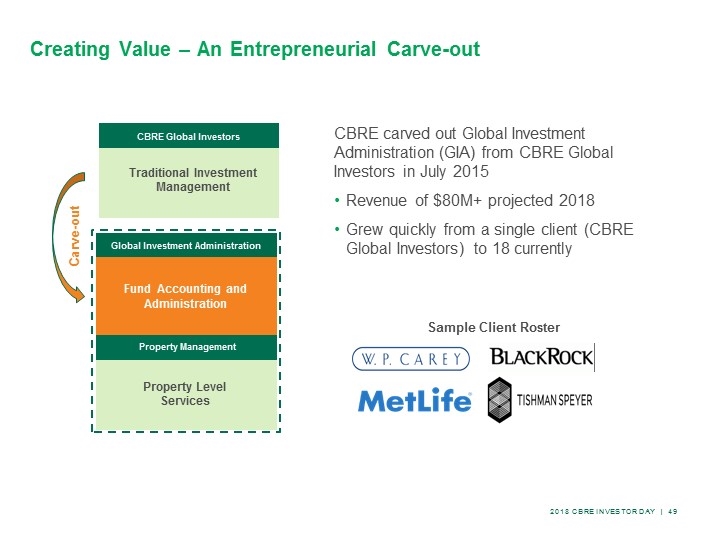
Fund Accounting and Administration Global Investment Administration Property Level Services Traditional Investment Management CBRE Global Investors Property Management Carve-out Creating Value – An Entrepreneurial Carve-out CBRE carved out Global Investment Administration (GIA) from CBRE Global Investors in July 2015 Revenue of $80M+ projected 2018 Grew quickly from a single client (CBRE Global Investors) to 18 currently Sample Client Roster
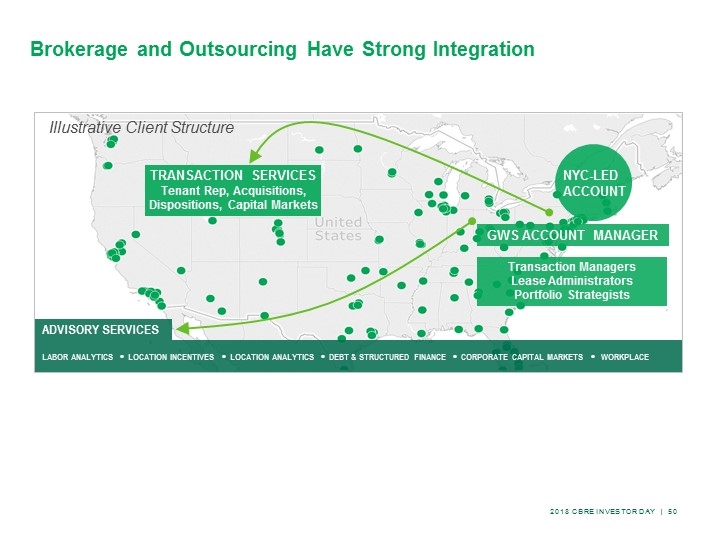
TRANSACTION SERVICES Tenant Rep, Acquisitions, Dispositions, Capital Markets LABOR ANALYTICS Ÿ LOCATION INCENTIVES Ÿ LOCATION ANALYTICS Ÿ DEBT & STRUCTURED FINANCE Ÿ CORPORATE CAPITAL MARKETS Ÿ WORKPLACE ADVISORY SERVICES NYC-LED ACCOUNT GWS ACCOUNT MANAGER Transaction Managers Lease Administrators Portfolio Strategists Illustrative Client Structure Brokerage and Outsourcing Have Strong Integration
CBRE is positioned to Extend its lead in brokerage
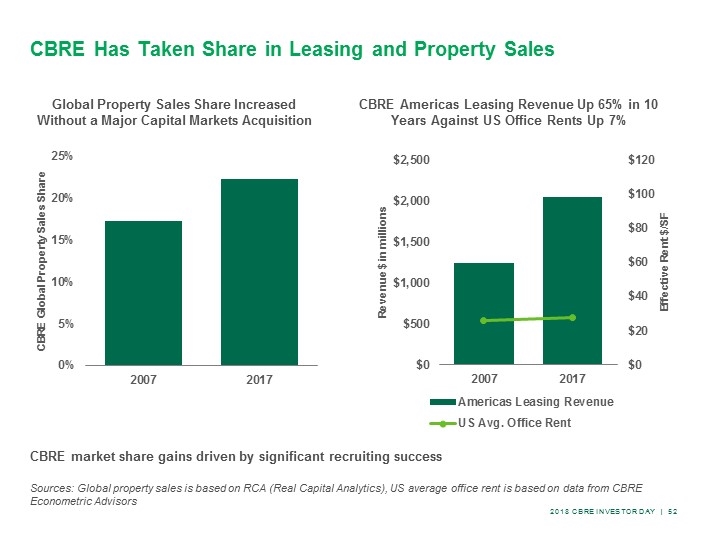
CBRE Has Taken Share in Leasing and Property Sales Sources: Global property sales is based on RCA (Real Capital Analytics), US average office rent is based on data from CBRE Econometric Advisors CBRE Americas Leasing Revenue Up 65% in 10 Years Against US Office Rents Up 7% Global Property Sales Share Increased Without a Major Capital Markets Acquisition CBRE market share gains driven by significant recruiting success
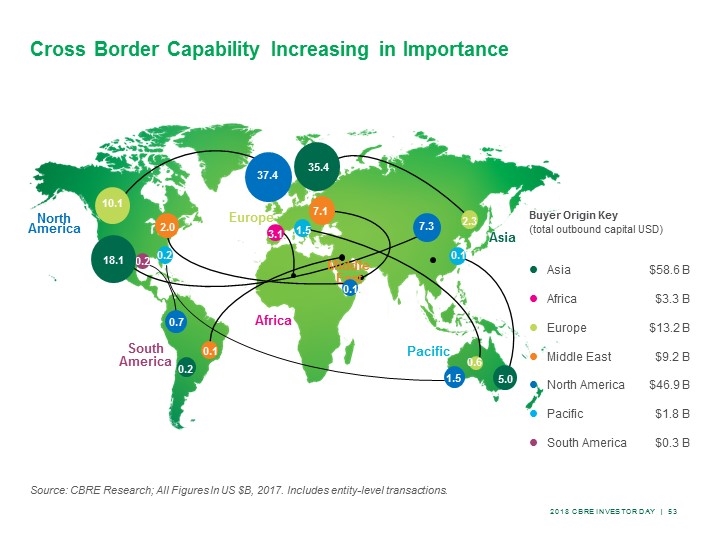
Buyer Origin Key (total outbound capital USD) Asia $58.6 B Africa $3.3 B Europe $13.2 B Middle East $9.2 B North America $46.9 B Pacific $1.8 B South America $0.3 B Source: CBRE Research; All Figures In US $B, 2017. Includes entity-level transactions. Cross Border Capability Increasing in Importance Asia Pacific South America Europe North America 37.4 10.1 Africa 2.3 35.4 7.3 1.5 7.1 2.0 0.2 0.2 0.2 0.1 0.6 3.1 0.7 5.0 Middle East 18.1 0.1 1.5 0.1 0.1 0.2
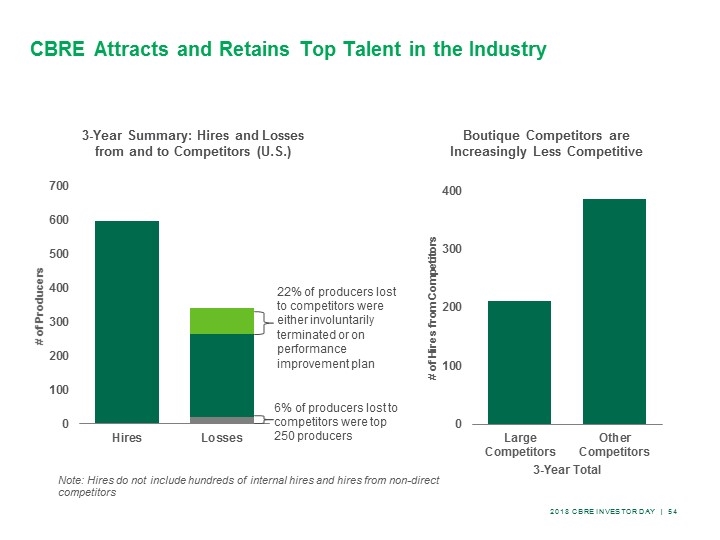
CBRE Attracts and Retains Top Talent in the Industry 3-Year Summary: Hires and Losses from and to Competitors (U.S.) Boutique Competitors are Increasingly Less Competitive Note: Hires do not include hundreds of internal hires and hires from non-direct competitors 22% of producers lost to competitors were either involuntarily terminated or on performance improvement plan 6% of producers lost to competitors were top 250 producers
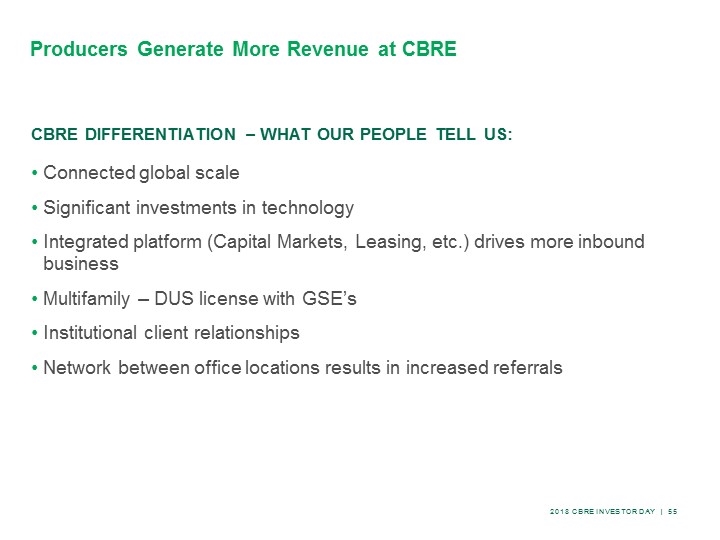
Connected global scale Significant investments in technology Integrated platform (Capital Markets, Leasing, etc.) drives more inbound business Multifamily – DUS license with GSE’s Institutional client relationships Network between office locations results in increased referrals CBRE Differentiation – What our people tell us: Producers Generate More Revenue at CBRE
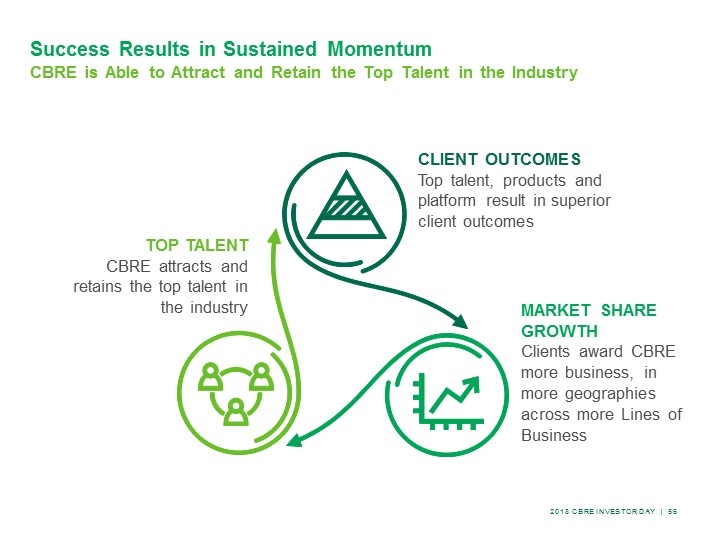
Success Results in Sustained Momentum CBRE is Able to Attract and Retain the Top Talent in the Industry CLIENT OUTCOMES Top talent, products and platform result in superior client outcomes TOP TALENT CBRE attracts and retains the top talent in the industry MARKET SHARE GROWTH Clients award CBRE more business, in more geographies across more Lines of Business
2018 cbre investor day competitive Position case study Whitley Collins Global President, Advisory & Transaction Services
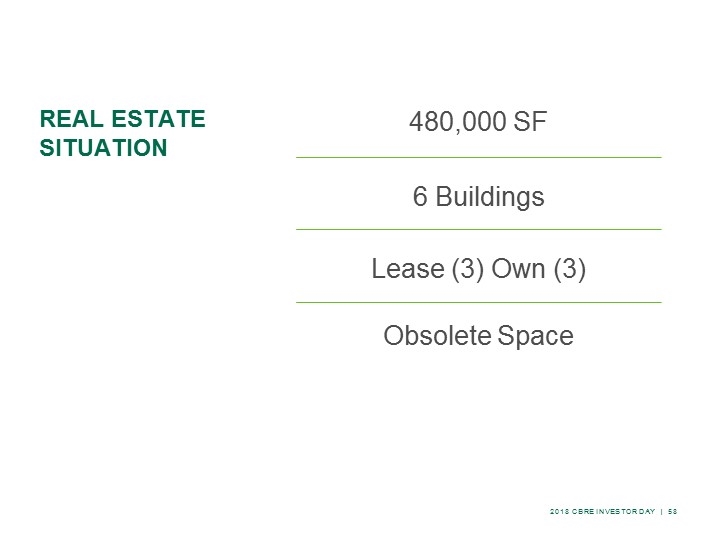
6 Buildings 480,000 SF Obsolete Space Lease (3) Own (3) Real estate situation
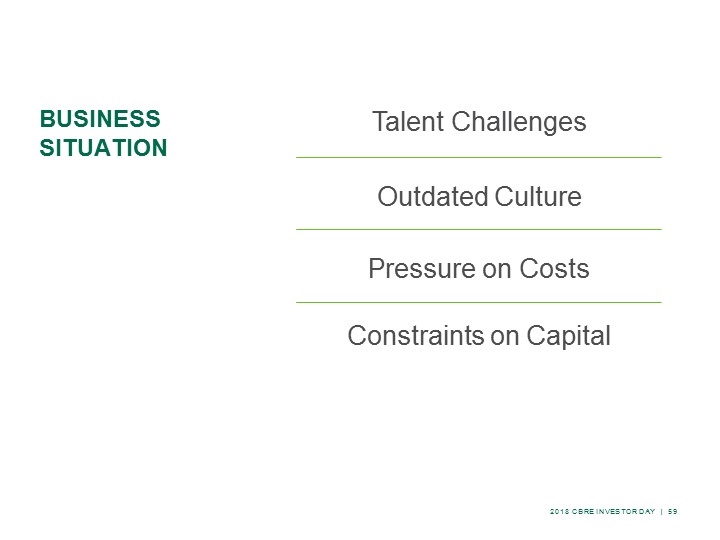
Outdated Culture Talent Challenges Constraints on Capital Pressure on Costs Business situation
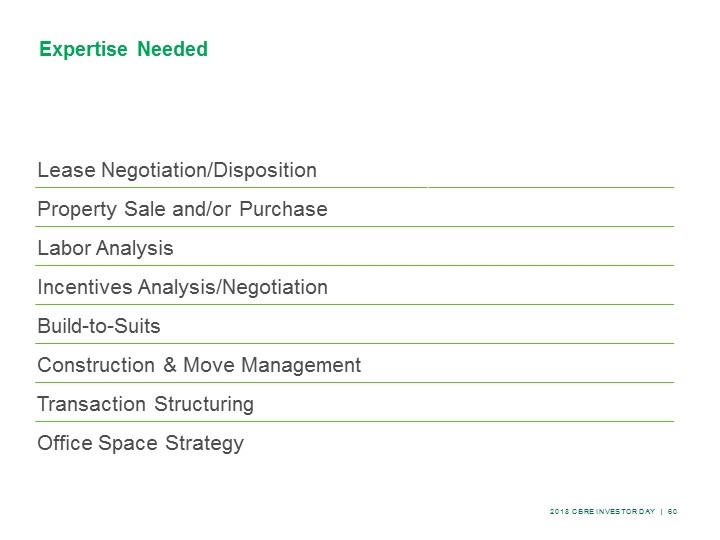
Expertise Needed Lease Negotiation/Disposition Property Sale and/or Purchase Labor Analysis Incentives Analysis/Negotiation Build-to-Suits Construction & Move Management Transaction Structuring Office Space Strategy
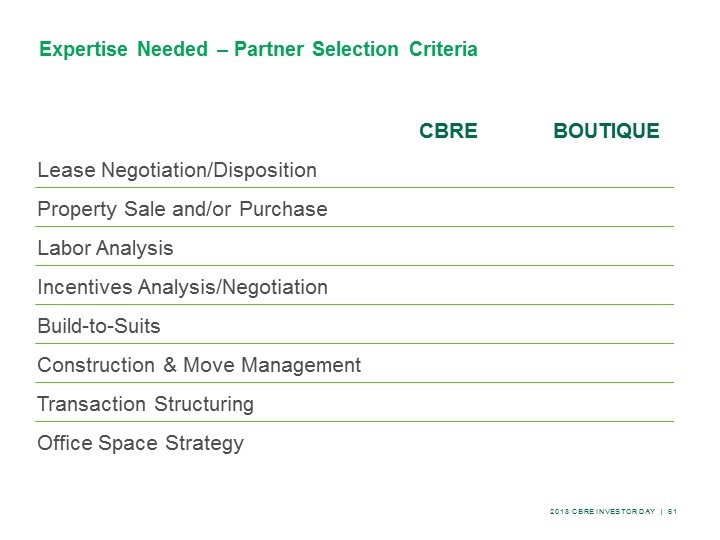
Expertise Needed – Partner Selection Criteria Lease Negotiation/Disposition Property Sale and/or Purchase Labor Analysis Incentives Analysis/Negotiation Build-to-Suits Construction & Move Management Transaction Structuring Office Space Strategy CBRE BOUTIQUE
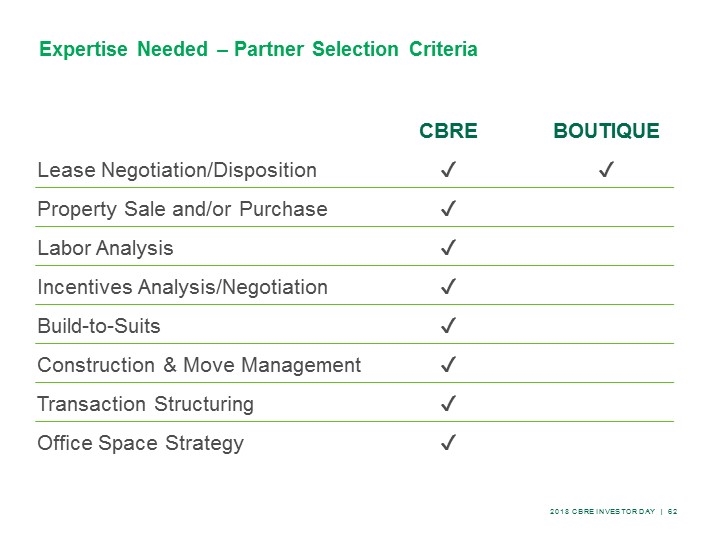
Expertise Needed – Partner Selection Criteria Lease Negotiation/Disposition Property Sale and/or Purchase Labor Analysis Incentives Analysis/Negotiation Build-to-Suits Construction & Move Management Transaction Structuring Office Space Strategy CBRE ✔️ ✔️ ✔️ ✔️ ✔️ ✔️ ✔️ ✔️ BOUTIQUE ✔️
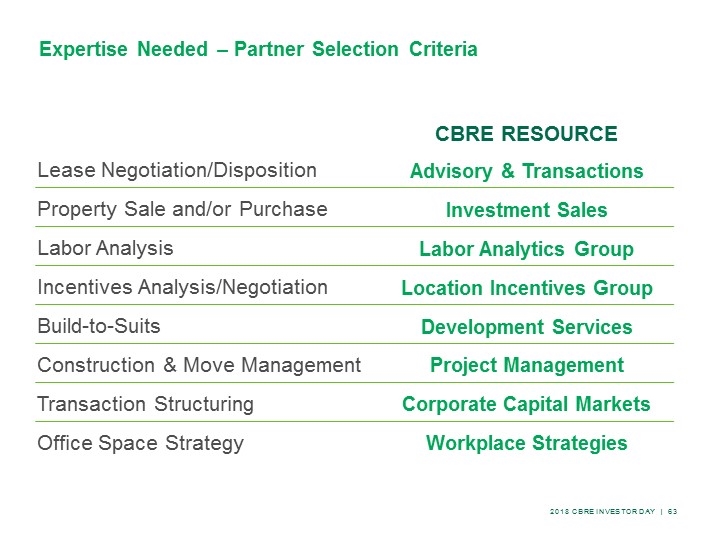
Expertise Needed – Partner Selection Criteria CBRE RESOURCE Advisory & Transactions Investment Sales Labor Analytics Group Location Incentives Group Development Services Project Management Corporate Capital Markets Workplace Strategies Lease Negotiation/Disposition Property Sale and/or Purchase Labor Analysis Incentives Analysis/Negotiation Build-to-Suits Construction & Move Management Transaction Structuring Office Space Strategy
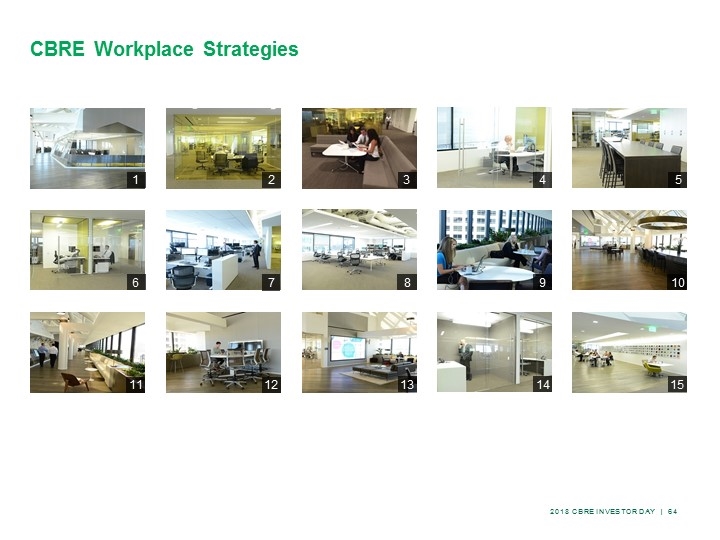
CBRE Workplace Strategies 15 14 13 12 11 10 9 8 7 6 5 4 3 2 1
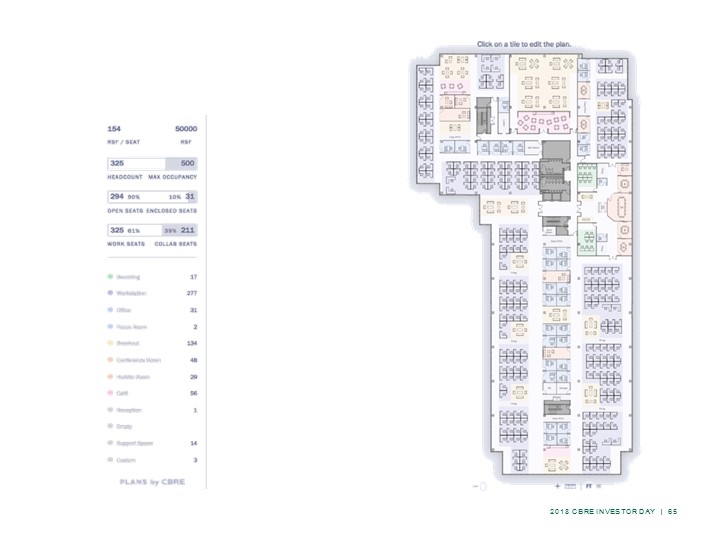
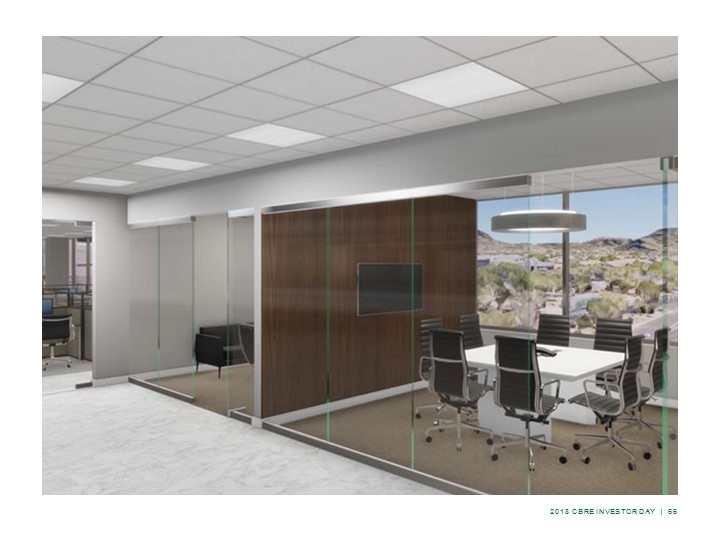

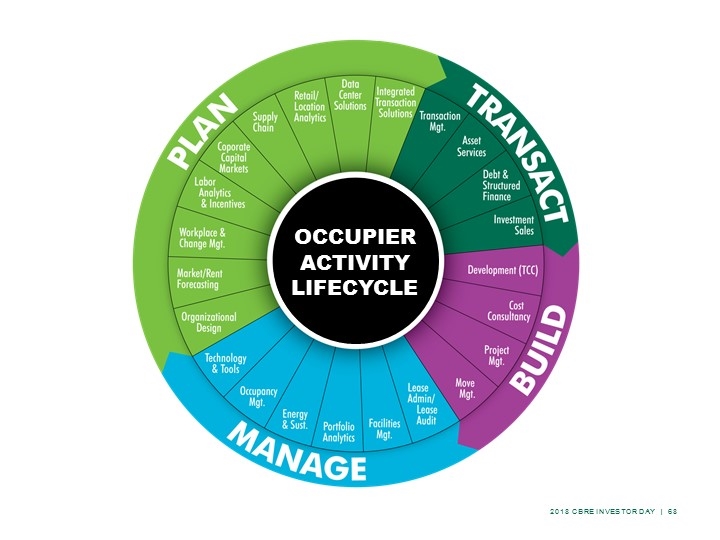
OCCUPIER ACTIVITY LIFECYCLE
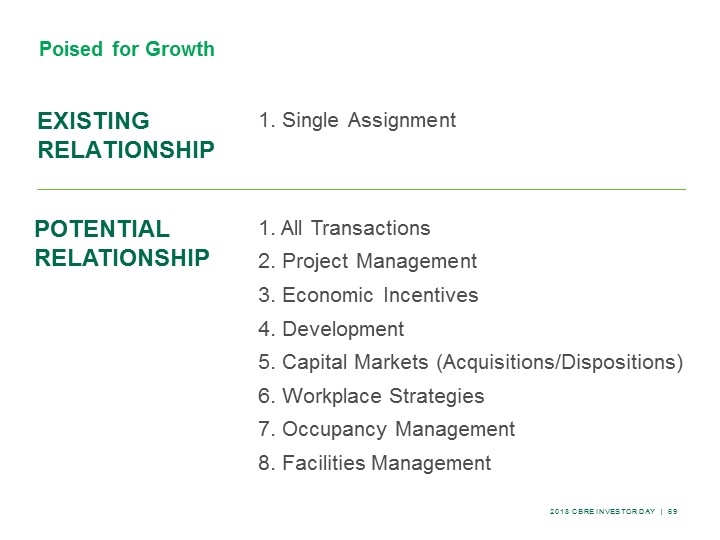
Poised for Growth Existing Relationship 1. Single Assignment Potential Relationship 1. All Transactions 2. Project Management 3. Economic Incentives 4. Development 5. Capital Markets (Acquisitions/Dispositions) 6. Workplace Strategies 7. Occupancy Management 8. Facilities Management

15 Minute Break
2018 cbre investor day Investment businesses T. Ritson Ferguson CEO, Real Estate Investment Businesses
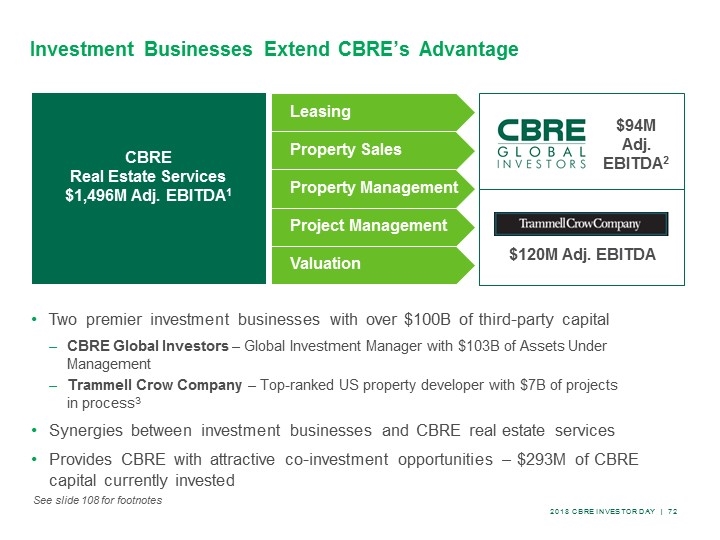
Investment Businesses Extend CBRE’s Advantage CBRE Real Estate Services $1,496M Adj. EBITDA1 Leasing Property Sales Property Management Project Management Valuation Two premier investment businesses with over $100B of third-party capital CBRE Global Investors – Global Investment Manager with $103B of Assets Under Management Trammell Crow Company – Top-ranked US property developer with $7B of projects in process3 Synergies between investment businesses and CBRE real estate services Provides CBRE with attractive co-investment opportunities – $293M of CBRE capital currently invested $94M Adj. EBITDA2 $120M Adj. EBITDA See slide 108 for footnotes
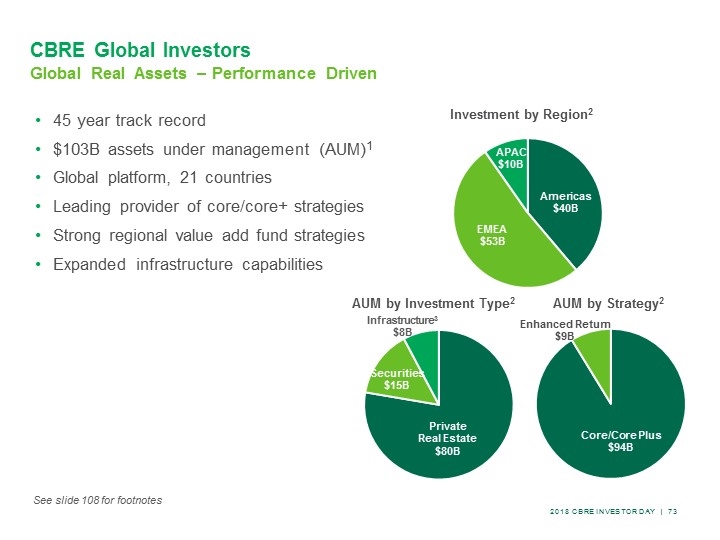
CBRE Global Investors Global Real Assets – Performance Driven 45 year track record $103B assets under management (AUM)1 Global platform, 21 countries Leading provider of core/core+ strategies Strong regional value add fund strategies Expanded infrastructure capabilities AUM by Investment Type2 AUM by Strategy2 Investment by Region2 See slide 108 for footnotes
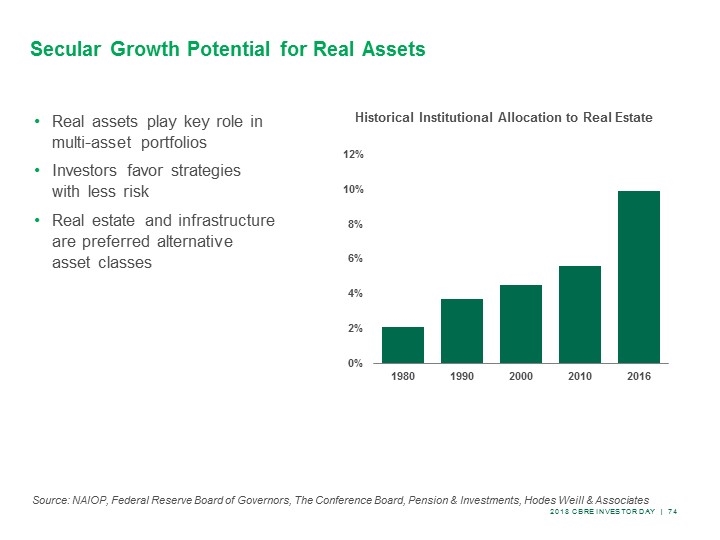
Secular Growth Potential for Real Assets Real assets play key role in multi-asset portfolios Investors favor strategies with less risk Real estate and infrastructure are preferred alternative asset classes Source: NAIOP, Federal Reserve Board of Governors, The Conference Board, Pension & Investments, Hodes Weill & Associates Historical Institutional Allocation to Real Estate
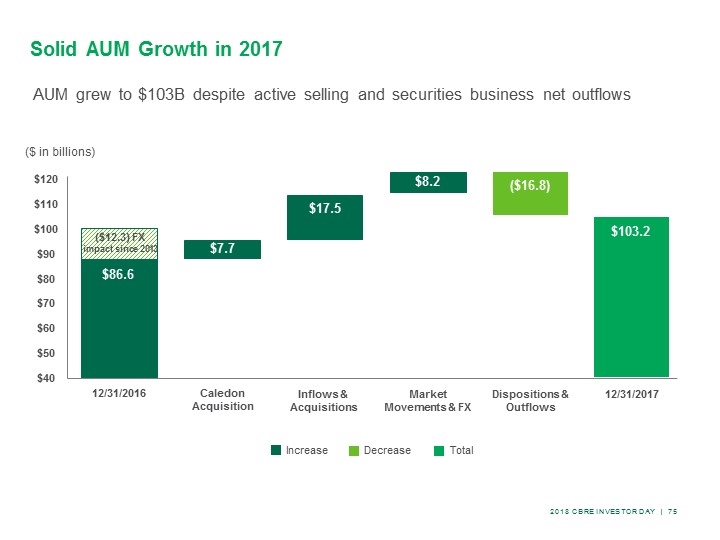
Solid AUM Growth in 2017 AUM grew to $103B despite active selling and securities business net outflows ($ in billions) ($12.3) FX impact since 2013 $86.6 $7.7 $17.5 $8.2 ($16.8) $103.2 $120 $110 $100 $90 $80 $70 $60 $50 $40 12/31/2016 Caledon Acquisition Inflows & Acquisitions Market Movements & FX Dispositions & Outflows 12/31/2017 Increase Decrease Total
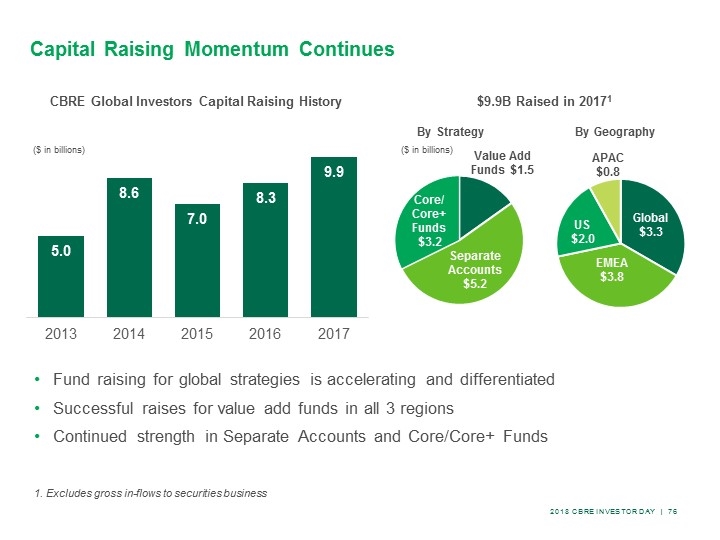
Capital Raising Momentum Continues By Strategy By Geography Excludes gross in-flows to securities business $9.9B Raised in 20171 CBRE Global Investors Capital Raising History Fund raising for global strategies is accelerating and differentiated Successful raises for value add funds in all 3 regions Continued strength in Separate Accounts and Core/Core+ Funds ($ in billions) ($ in billions)
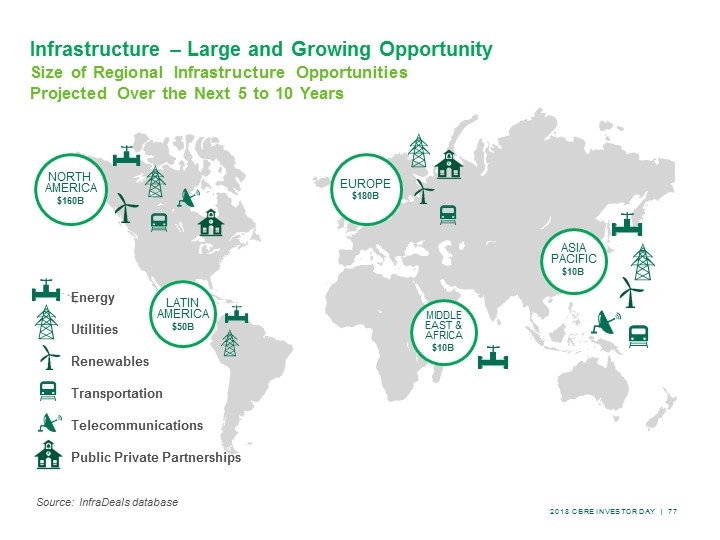
Infrastructure – Large and Growing Opportunity Size of Regional Infrastructure Opportunities Projected Over the Next 5 to 10 Years Source: InfraDeals database NORTH AMERICA $160B LATIN AMERICA $50B EUROPE $180B ASIA PACIFIC $10B MIDDLE EAST & AFRICA $10B Energy Utilities Renewables Transportation Telecommunications Public Private Partnerships
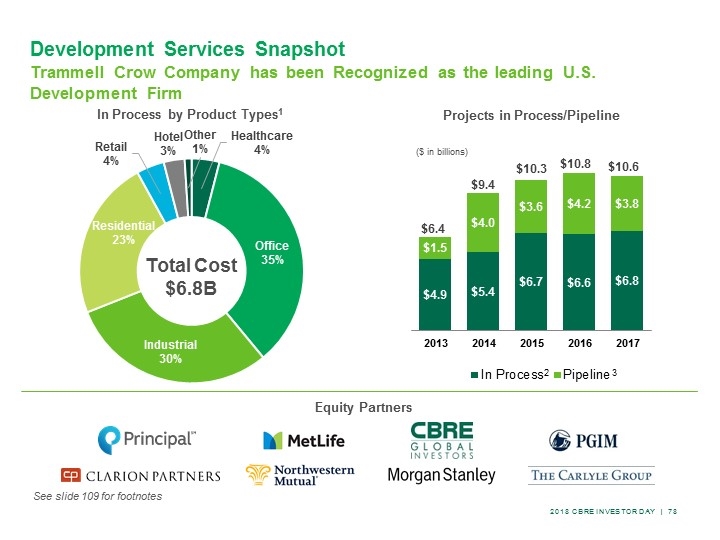
Development Services Snapshot Trammell Crow Company has been Recognized as the leading U.S. Development Firm Equity Partners In Process by Product Types1 Projects in Process/Pipeline ($ in billions) Total Cost $6.8B 2 3 See slide 109 for footnotes
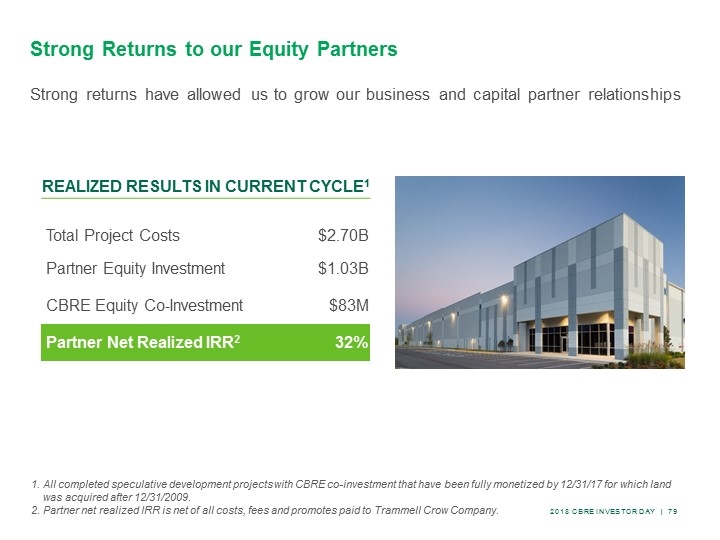
Strong Returns to our Equity Partners REALIZED RESULTS IN CURRENT CYCLE1 Total Project Costs $2.70B Partner Equity Investment $1.03B CBRE Equity Co-Investment $83M Partner Net Realized IRR2 32% All completed speculative development projects with CBRE co-investment that have been fully monetized by 12/31/17 for which land was acquired after 12/31/2009. Partner net realized IRR is net of all costs, fees and promotes paid to Trammell Crow Company. Strong returns have allowed us to grow our business and capital partner relationships
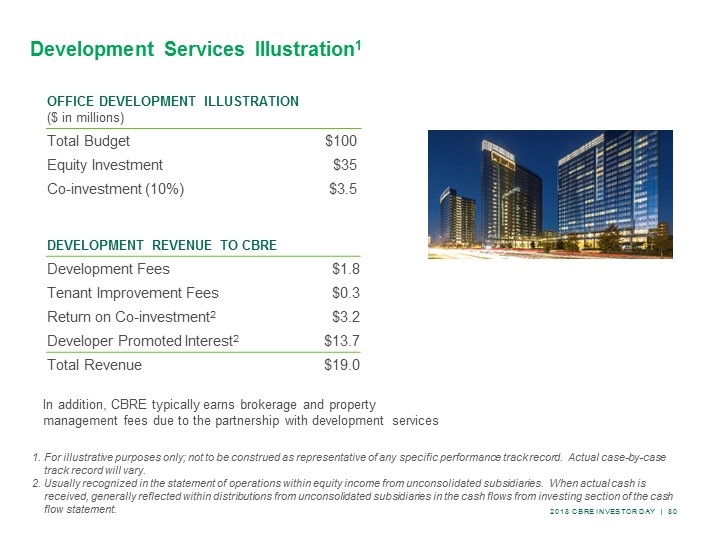
Development Services Illustration1 OFFICE DEVELOPMENT illustration ($ in millions) Total Budget $100 Equity Investment $35 Co-investment (10%) $3.5 DEVELOPMENT REVENUE to CBRE Development Fees $1.8 Tenant Improvement Fees $0.3 Return on Co-investment2 $3.2 Developer Promoted Interest2 $13.7 Total Revenue $19.0 In addition, CBRE typically earns brokerage and property management fees due to the partnership with development services For illustrative purposes only; not to be construed as representative of any specific performance track record. Actual case-by-case track record will vary. Usually recognized in the statement of operations within equity income from unconsolidated subsidiaries. When actual cash is received, generally reflected within distributions from unconsolidated subsidiaries in the cash flows from investing section of the cash flow statement.
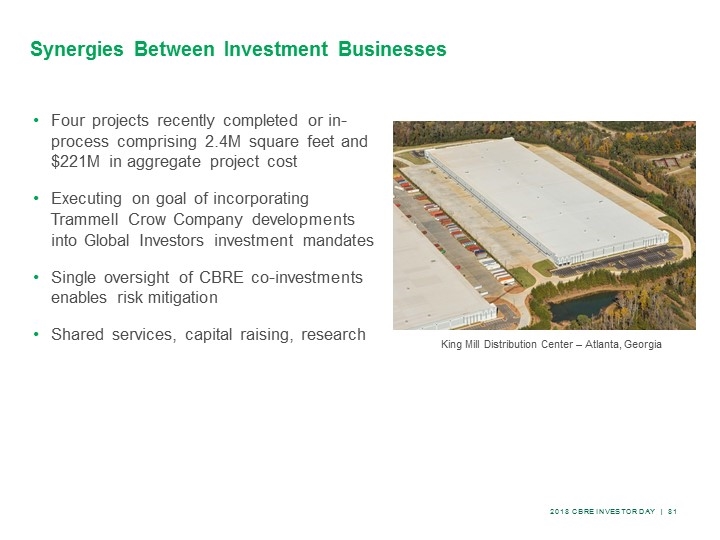
Synergies Between Investment Businesses King Mill Distribution Center – Atlanta, Georgia Four projects recently completed or in-process comprising 2.4M square feet and $221M in aggregate project cost Executing on goal of incorporating Trammell Crow Company developments into Global Investors investment mandates Single oversight of CBRE co-investments enables risk mitigation Shared services, capital raising, research
Note This presentation is prepared for the benefit of CBRE Group, Inc. shareholders, and is solely for informational purposes in connection with evaluating the business, operations, and financial results of the Investment Management segment of CBRE Group. The views expressed represent the opinion of CBRE Group’s Investment Management segment, which are subject to change and are not intended as a forecast or guarantee of future results. Stated information is derived from proprietary and non-proprietary sources which have not been independently verified for accuracy or completeness. While we believe the information to be accurate and reliable, we do not claim or have responsibility for its completeness, accuracy, or reliability. Statements of future expectations, estimate, projections, and other forward-looking statements are based on available information and management’s view as of the time of these statements. Accordingly, such statements are inherently speculative as they are based on assumptions which may involve known and unknown risks and uncertainties. Actual results, performance or events may differ materially from those expressed or implied in such statements. This presentation is not, and shall not be construed as, an offer to purchase or sell, or the solicitation of an offer to purchase or sell, any investment, security, fund, investment advice, or any other service. Further, this presentation is not a recommendation for any investment and does not constitute any tax, accounting, financial, investment, regulatory, legal or other advice. Past performance of investment strategies, sectors, vehicles and indices are not indicative of future results. There is no guarantee that the investment objective will be attained. Results will vary and there is no guarantee that risk can be managed successfully.
2018 cbre investor day Occupier outsourcing Bill Concannon Global Group President and CEO, Global Workplace Solutions
Agenda What is GWS and the GWS business model? Why is there growing demand for GWS services? What is the competitive landscape for GWS?
What is gws and THE gws business model?
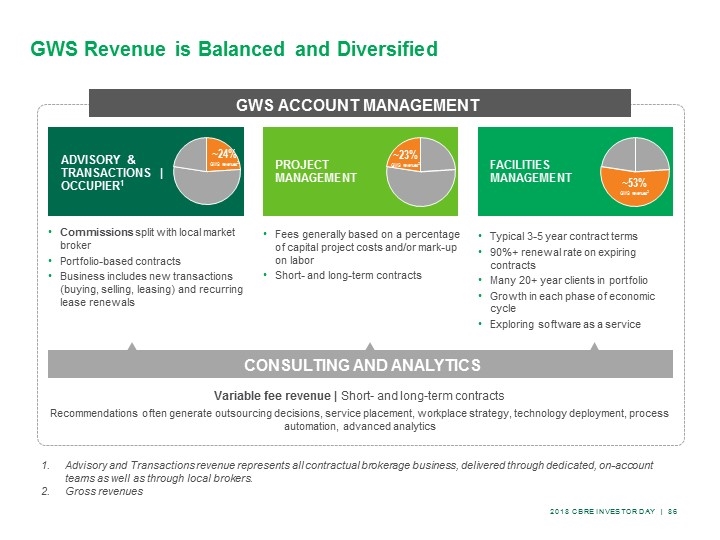
CONSULTING AND ANALYTICS GWS Revenue is Balanced and Diversified Typical 3-5 year contract terms 90%+ renewal rate on expiring contracts Many 20+ year clients in portfolio Growth in each phase of economic cycle Exploring software as a service Fees generally based on a percentage of capital project costs and/or mark-up on labor Short- and long-term contracts Commissions split with local market broker Portfolio-based contracts Business includes new transactions (buying, selling, leasing) and recurring lease renewals Variable fee revenue | Short- and long-term contracts Recommendations often generate outsourcing decisions, service placement, workplace strategy, technology deployment, process automation, advanced analytics ~53% GWS revenues2 ~23% GWS revenues2 ~24% GWS revenues2 Advisory and Transactions revenue represents all contractual brokerage business, delivered through dedicated, on-account teams as well as through local brokers. Gross revenues ADVISORY & TRANSACTIONS | OCCUPIER1 PROJECT MANAGEMENT FACILITIES MANAGEMENT GWS ACCOUNT MANAGEMENT
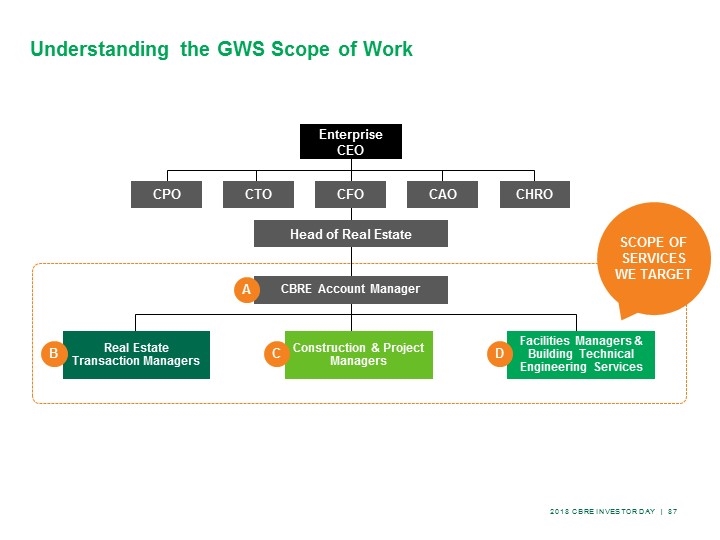
Understanding the GWS Scope of Work Enterprise CEO CFO CPO CTO CHRO CAO Head of Real Estate Real Estate Transaction Managers Construction & Project Managers Facilities Managers & Building Technical Engineering Services CBRE Account Manager A B C D SCOPE OF SERVICES WE TARGET
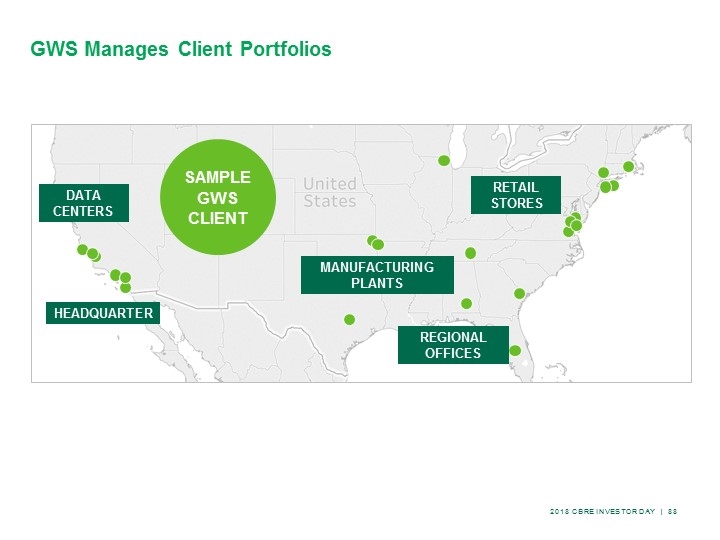
SAMPLE GWS CLIENT HEADQUARTER DATA CENTERS MANUFACTURING PLANTS REGIONAL OFFICES RETAIL STORES GWS Manages Client Portfolios
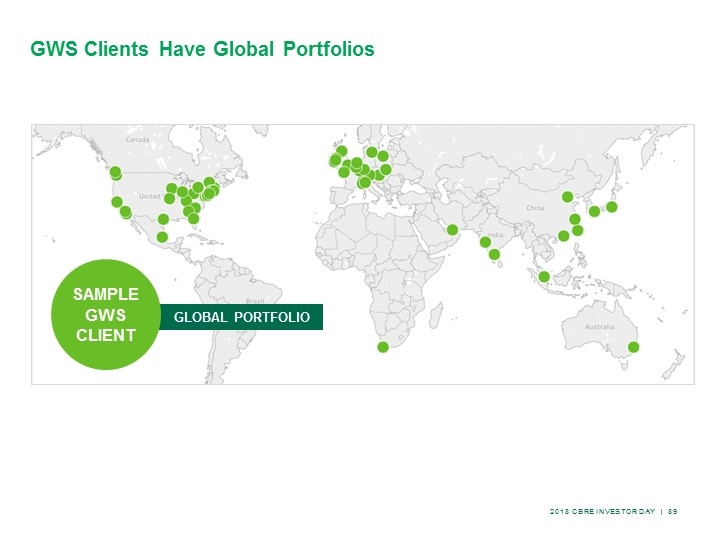
GWS Clients Have Global Portfolios GLOBAL PORTFOLIO SAMPLE GWS CLIENT
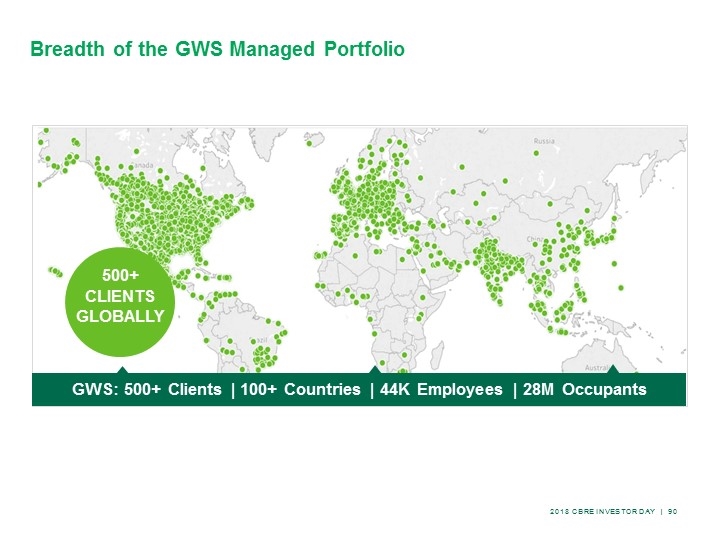
GWS: 500+ Clients | 100+ Countries | 44K Employees | 28M Occupants Breadth of the GWS Managed Portfolio 500+ CLIENTS GLOBALLY

Why is there growing demand for gws services?
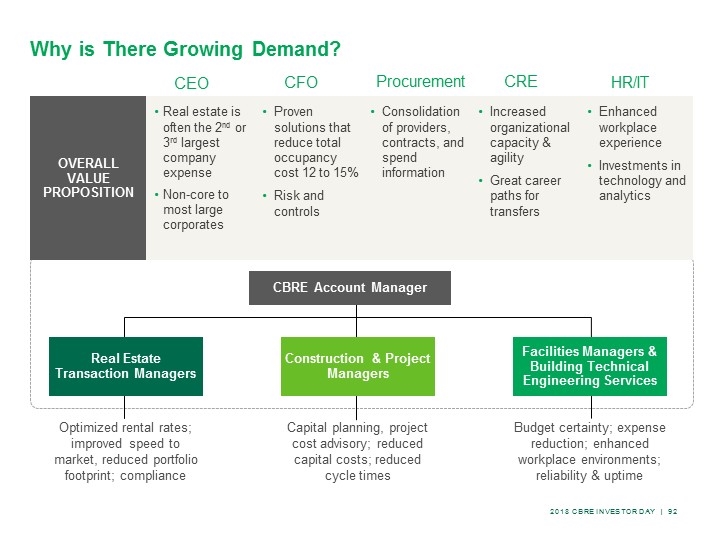
Why is There Growing Demand? Real Estate Transaction Managers Construction & Project Managers Facilities Managers & Building Technical Engineering Services CBRE Account Manager Optimized rental rates; improved speed to market, reduced portfolio footprint; compliance Budget certainty; expense reduction; enhanced workplace environments; reliability & uptime Capital planning, project cost advisory; reduced capital costs; reduced cycle times OVERALL VALUE PROPOSITION Real estate is often the 2nd or 3rd largest company expense Non-core to most large corporates Proven solutions that reduce total occupancy cost 12 to 15% Risk and controls Consolidation of providers, contracts, and spend information Increased organizational capacity & agility Great career paths for transfers Enhanced workplace experience Investments in technology and analytics CEO CFO Procurement CRE HR/IT
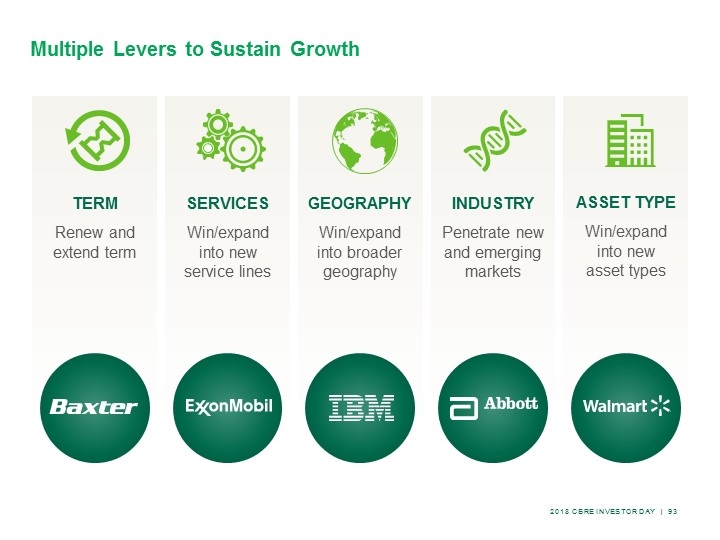
Multiple Levers to Sustain Growth TERM Renew and extend term SERVICES Win/expand into new service lines GEOGRAPHY Win/expand into broader geography INDUSTRY Penetrate new and emerging markets ASSET TYPE Win/expand into new asset types
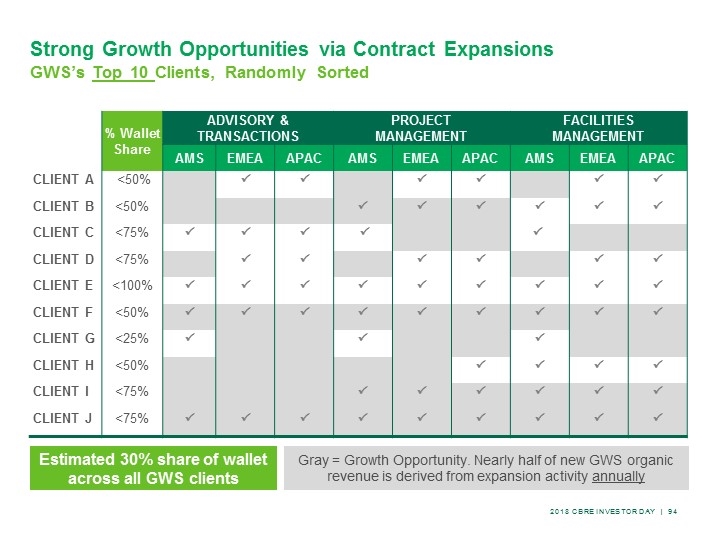
% Wallet Share ADVISORY & TRANSACTIONS PROJECT MANAGEMENT FACILITIES MANAGEMENT AMS EMEA APAC AMS EMEA APAC AMS EMEA APAC CLIENT A <50% P P P P P P CLIENT B <50% P P P P P P CLIENT C <75% P P P P P CLIENT D <75% P P P P P P CLIENT E <100% P P P P P P P P P CLIENT F <50% P P P P P P P P P CLIENT G <25% P P P CLIENT H <50% P P P P CLIENT I <75% P P P P P P CLIENT J <75% P P P P P P P P P Gray = Growth Opportunity. Nearly half of new GWS organic revenue is derived from expansion activity annually Estimated 30% share of wallet across all GWS clients Strong Growth Opportunities via Contract Expansions GWS’s Top 10 Clients, Randomly Sorted

What is the competitive landscape for GWS?
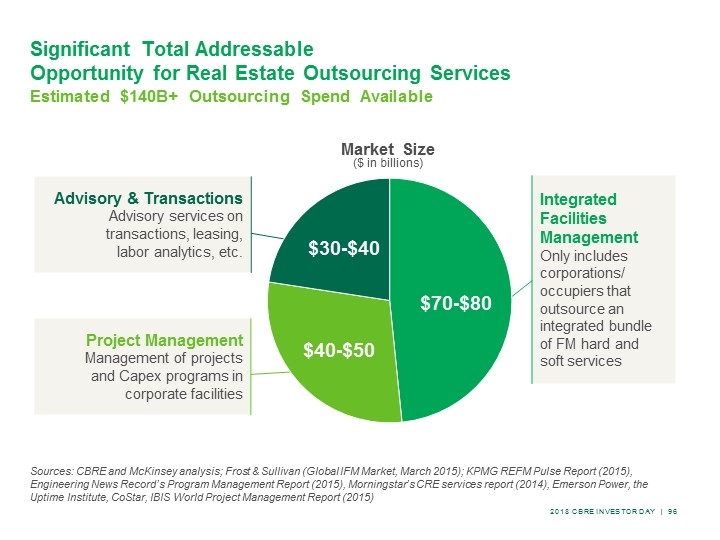
Significant Total Addressable Opportunity for Real Estate Outsourcing Services Estimated $140B+ Outsourcing Spend Available Market Size ($ in billions) Integrated Facilities Management Only includes corporations/ occupiers that outsource an integrated bundle of FM hard and soft services Project Management Management of projects and Capex programs in corporate facilities Advisory & Transactions Advisory services on transactions, leasing, labor analytics, etc. Sources: CBRE and McKinsey analysis; Frost & Sullivan (Global IFM Market, March 2015); KPMG REFM Pulse Report (2015), Engineering News Record’s Program Management Report (2015), Morningstar’s CRE services report (2014), Emerson Power, the Uptime Institute, CoStar, IBIS World Project Management Report (2015) $30-$40 $40-$50 $70-$80
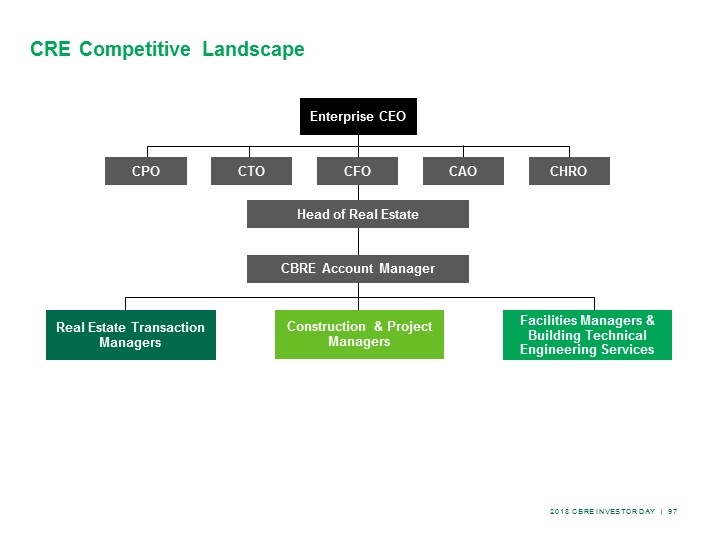
Enterprise CEO CFO CPO CTO CHRO CAO Head of Real Estate Real Estate Transaction Managers Construction & Project Managers Facilities Managers & Building Technical Engineering Services CBRE Account Manager CRE Competitive Landscape
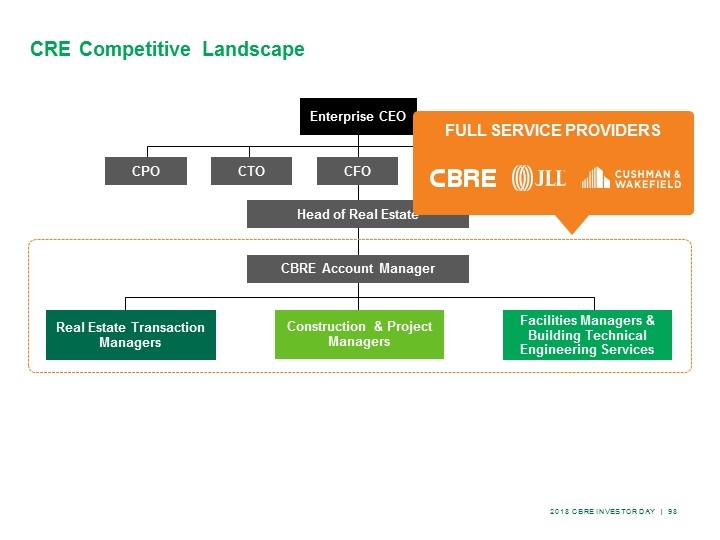
Enterprise CEO CFO CPO CTO CHRO CAO Head of Real Estate Real Estate Transaction Managers Construction & Project Managers Facilities Managers & Building Technical Engineering Services CBRE Account Manager FULL SERVICE PROVIDERS CRE Competitive Landscape
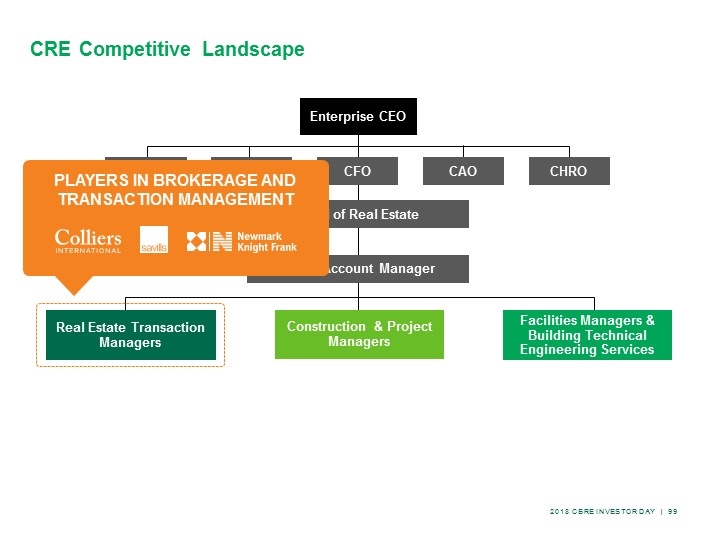
Enterprise CEO CFO CPO CTO CHRO CAO Head of Real Estate Real Estate Transaction Managers Construction & Project Managers Facilities Managers & Building Technical Engineering Services CBRE Account Manager PLAYERS IN BROKERAGE AND TRANSACTION MANAGEMENT CRE Competitive Landscape
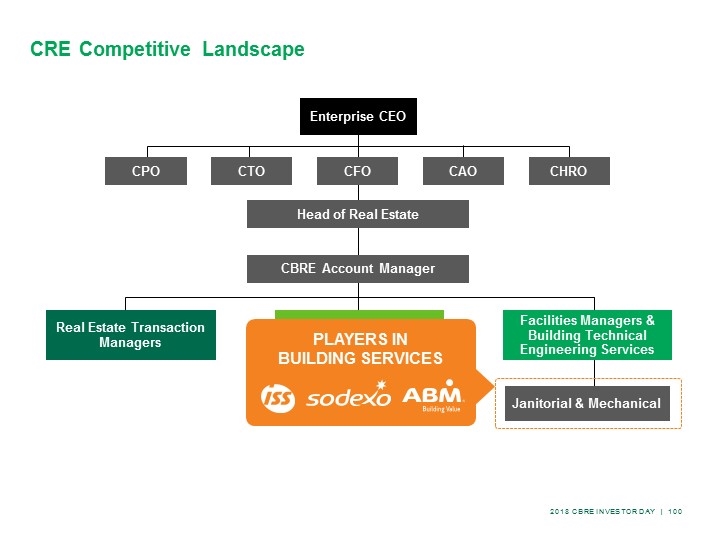
Enterprise CEO CFO CPO CTO CHRO CAO Head of Real Estate Real Estate Transaction Managers Construction & Project Managers Facilities Managers & Building Technical Engineering Services CBRE Account Manager Janitorial & Mechanical PLAYERS IN BUILDING SERVICES CRE Competitive Landscape
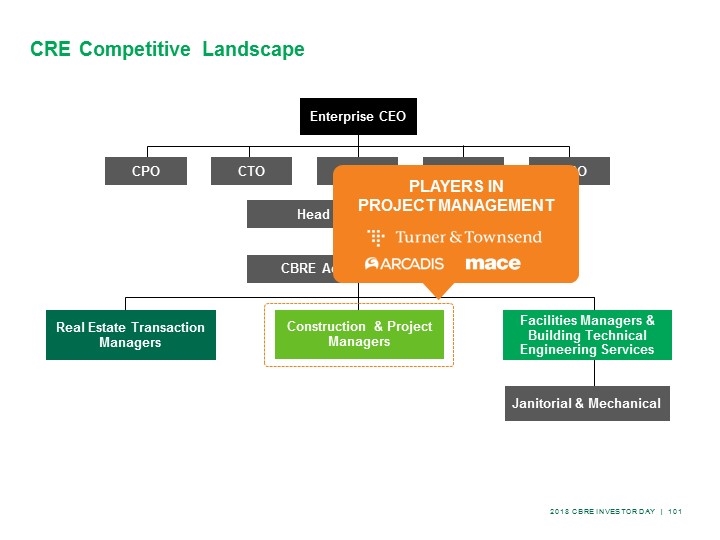
Enterprise CEO CFO CPO CTO CHRO CAO Head of Real Estate Real Estate Transaction Managers Construction & Project Managers Facilities Managers & Building Technical Engineering Services CBRE Account Manager PLAYERS IN PROJECT MANAGEMENT CRE Competitive Landscape Janitorial & Mechanical
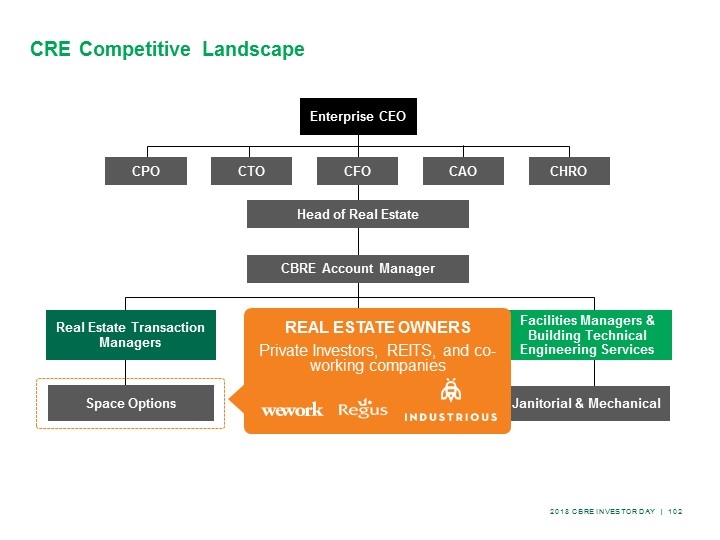
Enterprise CEO CFO CPO CTO CHRO CAO Head of Real Estate Real Estate Transaction Managers Construction & Project Managers Facilities Managers & Building Technical Engineering Services CBRE Account Manager Space Options Janitorial & Mechanical REAL ESTATE OWNERS Private Investors, REITS, and co-working companies CRE Competitive Landscape
How is GWS Different from the Competition? Full Service, Integrated Solutions Global Platform Provides Scale and Leverage Deep Experience and Track Record Investments in Technology and Innovation

2018 cbre investor day Q&A

Footnotes and gaap reconciliation tables
Non-GAAP Financial Measures The following measures are considered “non-GAAP financial measures” under SEC guidelines: fee revenue net income attributable to CBRE Group, Inc., as adjusted (which we also refer to as “adjusted net income”) diluted income per share attributable to CBRE Group, Inc. shareholders, as adjusted (which we also refer to as “adjusted earnings per share” or “adjusted EPS”) EBITDA and adjusted EBITDA These measures are not recognized measurements under United States generally accepted accounting principles, or “GAAP.” When analyzing our operating performance, investors should use them in addition to, and not as an alternative for, their most directly comparable financial measure calculated and presented in accordance with GAAP. Because not all companies use identical calculations, our presentation of these measures may not be comparable to similarly titled measures of other companies. Our management generally uses these non-GAAP financial measures to evaluate operating performance and for other discretionary purposes. The company believes that these measures provide a more complete understanding of ongoing operations, enhance comparability of current results to prior periods and may be useful for investors to analyze our financial performance because they eliminate the impact of selected charges that may obscure trends in the underlying performance of our business. The company further uses certain of these measures, and believes that they are useful to investors, for purposes described below. With respect to fee revenue: the company believes that investors may find this measure useful to analyze the financial performance of our Occupier Outsourcing and Property Management business lines and our business generally. Fee revenue excludes costs reimbursable by clients, and as such provides greater visibility into the underlying performance of our business. With respect to adjusted net income, adjusted EPS, EBITDA and adjusted EBITDA: the company believes that investors may find these measures useful in evaluating our operating performance compared to that of other companies in our industry because their calculations generally eliminate the accounting effects of acquisitions, which would include impairment charges of goodwill and intangibles created from acquisitions—and in the case of EBITDA and adjusted EBITDA—the effects of financings and income tax and the accounting effects of capital spending. All of these measures may vary for different companies for reasons unrelated to overall operating performance. In the case of EBITDA and adjusted EBITDA, these measures are not intended to be measures of free cash flow for our management’s discretionary use because they do not consider cash requirements such as tax and debt service payments. The EBITDA and adjusted EBITDA measures calculated herein may also differ from the amounts calculated under similarly titled definitions in our credit facilities and debt instruments, which amounts are further adjusted to reflect certain other cash and non-cash charges and are used by us to determine compliance with financial covenants therein and our ability to engage in certain activities, such as incurring additional debt and making certain restricted payments. The company also uses adjusted EBITDA and adjusted EPS as significant components when measuring our operating performance under our employee incentive compensation programs.
Footnotes Slide 11 Other includes Development Services revenue (1% in both 2006 and 2017) and Other revenue (1% in both 2006 and 2017). Capital Markets includes Sales revenue (33% in 2006 and 19% in 2017) and Commercial Mortgage Brokerage (excluding Loan Servicing) revenue (4% in 2006 and 5% in 2017). Contractual Sources include Occupier Outsourcing and Property Management revenue (7% in 2006 and 33% in 2017; excludes associated sales and lease revenues, most of which are contractual), Global Investment Management revenue (6% in 2006 and 4% in 2017) Valuation revenue (8% in 2006 and 5% in 2017) and Loan Servicing (0.5% in 2006 and 2% in 2017). Fee Revenue is gross revenue less client reimbursed costs largely associated with our employees that are dedicated to client facilities and subcontracted vendor work performed for clients. Slide 9 Adjusted EPS excludes the effect of select charges from GAAP EPS as well as adjusts the provision for income taxes for such charges. Adjustments during the periods presented included amortization expense related to certain intangible assets attributable to acquisitions, cost-elimination expenses, integration and other costs related to acquisitions, certain carried interest incentive compensation (reversal) expense to align with the timing of associated revenue, write-off of financing costs on extinguished debt, and the write-down of other impaired assets (including goodwill and other non-amortizable intangibles). Adjustments also included the estimated tax impact of U.S. tax reform. All EPS information is based on diluted shares. Leverage ratio is defined as year-end Net Debt divided by full-year Adjusted EBITDA. Net Debt is defined as total debt, net of unamortized debt premiums, discounts and issuance costs, excluding warehouse facilities for loans originated on behalf of FHA and other government sponsored entities which are non-recourse to CBRE Group, Inc., non-recourse notes payable on real estate, and net of cash, excluding cash in consolidated funds and other entities not available for company use at year-end. Adjusted EBITDA excludes (from EBITDA) certain carried interest compensation reversal to align with the timing of associated revenue as well as integration and other costs associated with acquisitions. Note – We have not reconciled the (non-GAAP) adjusted net income margin on fee revenue guidance referenced in this presentation to the most directly comparable GAAP measure because this cannot be done without unreasonable effort due to the variability and low visibility with respect to costs related to acquisitions, carried interest incentive compensation and financing costs, which are potential adjustments to future earnings. We expect the variability of these items to have a potentially unpredictable, and a potentially significant, impact on our future GAAP financial results.
Footnotes Slide 39 Property and corporate facilities under management as of December 31, 2017, includes square footage managed by affiliates. As of December 31, 2017, includes affiliates. Assets Under Management (AUM) as of December 31, 2017. Adjusted EBITDA excludes (from EBITDA) certain carried interest compensation reversal to align with the timing of associated revenue, write-down of impaired assets, cost-elimination expenses as well as integration and other costs associated with acquisitions. Adjusted EPS excludes the effect of select charges from GAAP EPS as well as adjusts the provision for income taxes for such charges. Adjustments during the periods presented included amortization expense related to certain intangible assets attributable to acquisitions, cost-elimination expenses, integration and other costs related to acquisitions, certain carried interest incentive compensation (reversal) expense to align with the timing of associated revenue, goodwill and other non-amortizable intangible asset impairment, and the write-down of other impaired assets. Adjustments also included the estimated tax impact of U.S. tax reform. All EPS information is based on diluted shares. Slide 73 As of December 31, 2017. Assets under management (AUM) refers to the fair market value of real asset-related investments with respect to which CBRE Global Investors provides, on a global basis, oversight, investment management services and other advice and which generally consist of investments in real assets; equity in funds and joint ventures; securities portfolios; operating companies and real asset-related loans. This AUM is intended principally to reflect the extent of CBRE Global Investors’ presence in the global real asset market, and its calculation of AUM may differ from the calculations of other investment or asset managers. As of December 31, 2017. Investment by Region refers to the regional mandate and/or the location of the underlying investment. AUM by investment type refers to the allocation of assets across the four primary segments: Private Real Estate, Global Investment Partners, Securities, and Private Infrastructure. AUM by Strategy refers to the allocation of assets among strategies. Core / Core Plus generally refers to investment strategies that include stabilized investments, with a moderate return and leverage profile. Enhanced Return generally refers to value-add and opportunistic investment strategies with a higher return and leverage profile. Securities generally includes total return, real return, and income oriented investment strategies. Allocation figures are subject to change and may not sum due to rounding. This represents the Caledon acquisition (75% infrastructure and 25% private equity). Slide 72 Adjusted EBITDA excludes (from EBITDA) certain carried interest incentive compensation (reversal) expense to align with the timing of associated revenue, cost-elimination expenses and integration and other costs related to acquisitions. Regional adjusted EBITDA represents total adjusted EBITDA for our regional services businesses, including $1,014M for Americas, $306M for EMEA and $176M for Asia Pacific. Adjusted EBITDA excludes (from EBITDA) certain carried interest incentive compensation reversal to align with the timing of associated revenue. TCC has been named the leading US development firm for three years in a row by Commercial Property Executive magazine.
Footnotes Slide 78 In process as of December 31, 2017. In process figures include Long-Term Operating Assets (LTOA) of $0.2B for Q4 2017, $0.2B for Q4 2016, $0.1B for Q4 2015, $0.3B for Q4 2014 and $0.9B for Q4 2013. LTOA are projects that have achieved a stabilized level of occupancy or have been held 18-24 months following shell completion or acquisition. Pipeline deals are projects we are pursuing which we believe have a greater than 50% chance of closing or where land has been acquired and the projected construction start is more than 12 months out.
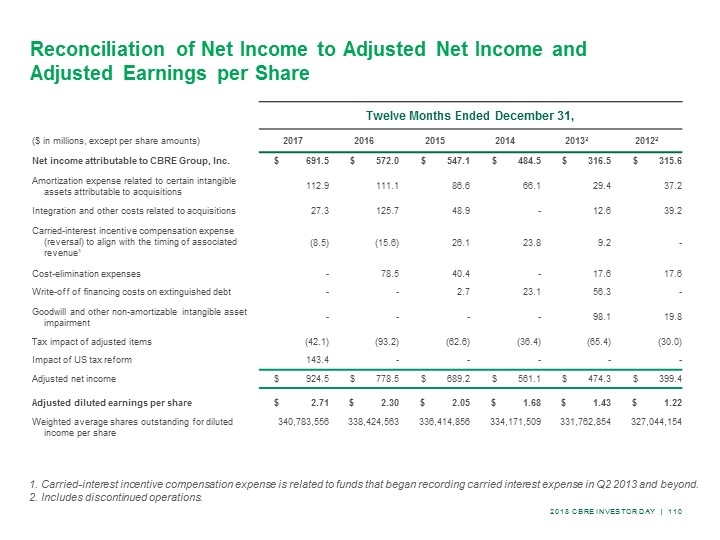
Reconciliation of Net Income to Adjusted Net Income and Adjusted Earnings per Share Twelve Months Ended December 31, ($ in millions, except per share amounts) 2017 2016 2015 2014 20132 20122 Net income attributable to CBRE Group, Inc. $ 691.5 $ 572.0 $ 547.1 $ 484.5 $ 316.5 $ 315.6 Amortization expense related to certain intangible assets attributable to acquisitions 112.9 111.1 86.6 66.1 29.4 37.2 Integration and other costs related to acquisitions 27.3 125.7 48.9 - 12.6 39.2 Carried-interest incentive compensation expense (reversal) to align with the timing of associated revenue1 (8.5) (15.6) 26.1 23.8 9.2 - Cost-elimination expenses - 78.5 40.4 - 17.6 17.6 Write-off of financing costs on extinguished debt - - 2.7 23.1 56.3 - Goodwill and other non-amortizable intangible asset impairment - - - - 98.1 19.8 Tax impact of adjusted items (42.1) (93.2) (62.6) (36.4) (65.4) (30.0) Impact of US tax reform 143.4 - - - - - Adjusted net income $ 924.5 $ 778.5 $ 689.2 $ 561.1 $ 474.3 $ 399.4 Adjusted diluted earnings per share $ 2.71 $ 2.30 $ 2.05 $ 1.68 $ 1.43 $ 1.22 Weighted average shares outstanding for diluted income per share 340,783,556 338,424,563 336,414,856 334,171,509 331,762,854 327,044,154 Carried-interest incentive compensation expense is related to funds that began recording carried interest expense in Q2 2013 and beyond. Includes discontinued operations.
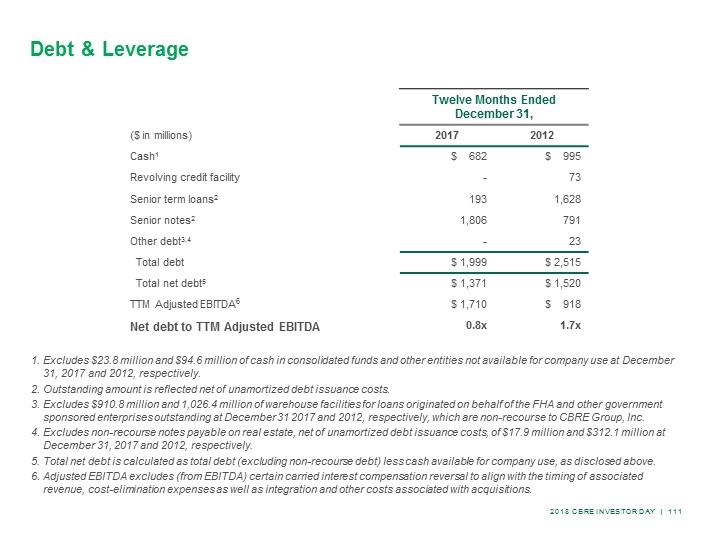
Twelve Months Ended December 31, ($ in millions) 2017 2012 Cash1 $ 682 $ 995 Revolving credit facility - 73 Senior term loans2 193 1,628 Senior notes2 1,806 791 Other debt3,4 - 23 Total debt $ 1,999 $ 2,515 Total net debt5 $ 1,371 $ 1,520 TTM Adjusted EBITDA6 $ 1,710 $ 918 Net debt to TTM Adjusted EBITDA 0.8x 1.7x Debt & Leverage Excludes $23.8 million and $94.6 million of cash in consolidated funds and other entities not available for company use at December 31, 2017 and 2012, respectively. Outstanding amount is reflected net of unamortized debt issuance costs. Excludes $910.8 million and 1,026.4 million of warehouse facilities for loans originated on behalf of the FHA and other government sponsored enterprises outstanding at December 31 2017 and 2012, respectively, which are non-recourse to CBRE Group, Inc. Excludes non-recourse notes payable on real estate, net of unamortized debt issuance costs, of $17.9 million and $312.1 million at December 31, 2017 and 2012, respectively. Total net debt is calculated as total debt (excluding non-recourse debt) less cash available for company use, as disclosed above. Adjusted EBITDA excludes (from EBITDA) certain carried interest compensation reversal to align with the timing of associated revenue, cost-elimination expenses as well as integration and other costs associated with acquisitions.
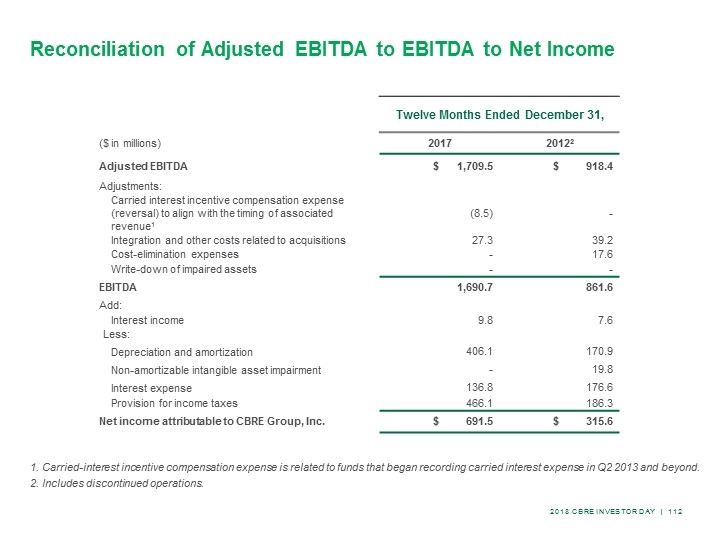
Reconciliation of Adjusted EBITDA to EBITDA to Net Income Carried-interest incentive compensation expense is related to funds that began recording carried interest expense in Q2 2013 and beyond. Includes discontinued operations. Twelve Months Ended December 31, ($ in millions) 2017 20122 Adjusted EBITDA $ 1,709.5 $ 918.4 Adjustments: Carried interest incentive compensation expense (reversal) to align with the timing of associated revenue1 (8.5) - Integration and other costs related to acquisitions 27.3 39.2 Cost-elimination expenses - 17.6 Write-down of impaired assets - - EBITDA 1,690.7 861.6 Add: Interest income 9.8 7.6 Less: Depreciation and amortization 406.1 170.9 Non-amortizable intangible asset impairment - 19.8 Interest expense 136.8 176.6 Provision for income taxes 466.1 186.3 Net income attributable to CBRE Group, Inc. $ 691.5 $ 315.6
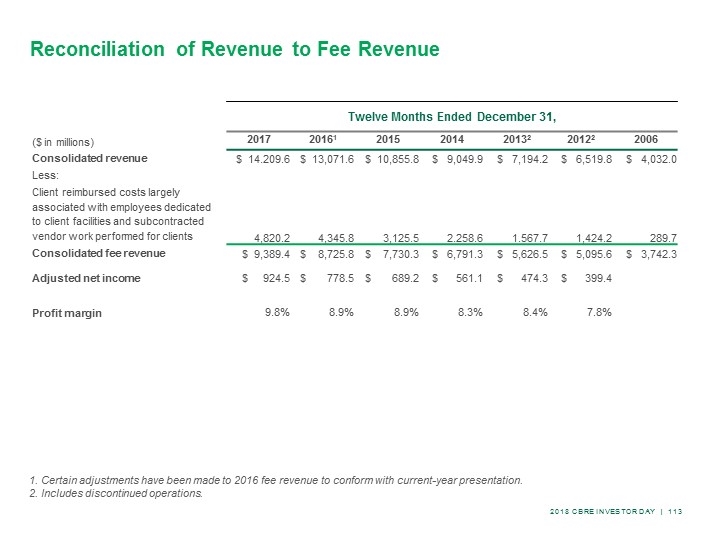
Twelve Months Ended December 31, ($ in millions) 2017 20161 2015 2014 20132 20122 2006 Consolidated revenue $ 14.209.6 $ 13,071.6 $ 10,855.8 $ 9,049.9 $ 7,194.2 $ 6,519.8 $ 4,032.0 Less: Client reimbursed costs largely associated with employees dedicated to client facilities and subcontracted vendor work performed for clients 4,820.2 4,345.8 3,125.5 2.258.6 1.567.7 1,424.2 289.7 Consolidated fee revenue $ 9,389.4 $ 8,725.8 $ 7,730.3 $ 6,791.3 $ 5,626.5 $ 5,095.6 $ 3,742.3 Adjusted net income $ 924.5 $ 778.5 $ 689.2 $ 561.1 $ 474.3 $ 399.4 Profit margin 9.8% 8.9% 8.9% 8.3% 8.4% 7.8% Reconciliation of Revenue to Fee Revenue Certain adjustments have been made to 2016 fee revenue to conform with current-year presentation. Includes discontinued operations.