
UNITED STATES
SECURITIES AND EXCHANGE COMMISSION
Washington, D.C. 20549
Annual Report Pursuant to Section 13 or 15(d) of the Securities Exchange
Act of 1934
For the fiscal year ended December 31, 2017
Commission File Number 001 – 32205
CBRE GROUP, INC.
(Exact name of registrant as specified in its charter)
|
Delaware |
|
94-3391143 |
|
(State or other jurisdiction |
|
(I.R.S. Employer Identification Number) |
|
of incorporation or organization) |
|
|
|
400 South Hope Street, 25th Floor |
|
|
|
Los Angeles, California |
|
90071 |
|
(Address of principal executive offices) |
|
(Zip Code) |
(213) 613-3333
(Registrant's telephone number, including area code)
Securities registered pursuant to Section 12(b) of the Act:
|
Title of Each Class |
|
Name of Each Exchange on Which Registered |
|
Class A Common Stock, $0.01 par value |
|
New York Stock Exchange |
Securities registered pursuant to Section 12(g) of the Act:
N.A.
Indicate by check mark if the registrant is a well-known seasoned issuer, as defined in Rule 405 of the Securities Act. Yes ☒ No ☐
Indicate by check mark if the registrant is not required to file reports pursuant to Section 13 or Section 15(d) of the Act. Yes ☐ No ☒
Indicate by check mark whether the registrant (1) has filed all reports required to be filed by Section 13 or 15(d) of the Securities Exchange Act of 1934 during the preceding 12 months (or for such shorter period that the registrant was required to file such reports), and (2) has been subject to such filing requirements for the past 90 days. Yes ☒ No ☐
Indicate by check mark whether the registrant has submitted electronically and posted on its corporate Web site, if any, every Interactive Data File required to be submitted and posted pursuant to Rule 405 of Regulation S-T (§232.405 of this chapter) during the preceding 12 months (or for such shorter period that the registrant was required to submit and post such files). Yes ☒ No ☐.
Indicate by check mark if disclosure of delinquent filers pursuant to Item 405 of Regulation S-K (§229.405 of this chapter) is not contained herein, and will not be contained, to the best of registrant's knowledge, in definitive proxy or information statements incorporated by reference in Part III of this Form 10-K or any amendment to the Form 10-K. ☐
Indicate by check mark whether the registrant is a large accelerated filer, an accelerated filer, a non-accelerated filer, smaller reporting company, or an emerging growth company. See the definitions of “large accelerated filer,” “accelerated filer,” “smaller reporting company” and “emerging growth company” in Rule 12b-2 of the Exchange Act.
|
Large accelerated filer ☒ |
Accelerated filer ☐ |
Non-accelerated filer ☐ |
Smaller reporting company ☐ |
Emerging growth company ☐ |
If an emerging growth company, indicate by check mark if the registrant has elected not to use the extended transition period for complying with any new or revised financial accounting standards provided pursuant to Section 13(a) of the Exchange Act. ☐
Indicate by check mark whether the registrant is a shell company (as defined in Rule 12b-2 of the Exchange Act). Yes ☐ No ☒
As of June 30, 2017, the aggregate market value of Class A Common Stock held by non-affiliates of the registrant was $12.3 billion based upon the last sales price on June 30, 2017 on the New York Stock Exchange of $36.40 for the registrant’s Class A Common Stock.
As of February 13, 2018, the number of shares of Class A Common Stock outstanding was 339,508,177.
DOCUMENTS INCORPORATED BY REFERENCE
Portions of the proxy statement for the registrant’s 2018 Annual Meeting of Stockholders to be held May 18, 2018 are incorporated by reference in Part III of this Annual Report on Form 10-K.
ANNUAL REPORT ON FORM 10-K
TABLE OF CONTENTS
|
|
|
Page |
|
Item 1. |
1 |
|
|
Item 1A. |
7 |
|
|
Item 1B. |
19 |
|
|
Item 2. |
19 |
|
|
Item 3. |
19 |
|
|
Item 4. |
20 |
|
|
|
|
|
|
Item 5. |
21 |
|
|
Item 6. |
23 |
|
|
Item 7. |
Management’s Discussion and Analysis of Financial Condition and Results of Operations |
27 |
|
Item 7A. |
53 |
|
|
Item 8. |
54 |
|
|
Item 9. |
Changes in and Disagreements With Accountants on Accounting and Financial Disclosure |
118 |
|
Item 9A. |
118 |
|
|
Item 9B. |
119 |
|
|
|
|
|
|
Item 10. |
119 |
|
|
Item 11. |
119 |
|
|
Item 12. |
Security Ownership of Certain Beneficial Owners and Management and Related Stockholder Matters |
119 |
|
Item 13. |
Certain Relationships and Related Transactions, and Director Independence |
120 |
|
Item 14. |
120 |
|
|
|
|
|
|
Item 15. |
120 |
|
|
Item 16. |
120 |
|
|
|
|
|
|
121 |
||
|
|
|
|
|
129 |
||
Company Overview
CBRE Group, Inc. is a Delaware corporation. References to “the company,” “we,” “us” and “our” refer to CBRE Group, Inc. and include all of its consolidated subsidiaries, unless otherwise indicated or the context requires otherwise.
We are the world’s largest commercial real estate services and investment firm, based on 2017 revenue, with leading global market positions in our leasing, property sales, occupier outsourcing and valuation businesses. As of December 31, 2017, we operated in more than 450 offices worldwide with over 80,000 employees, excluding independent affiliates. We serve clients in more than 100 countries.
Our business is focused on providing services to both occupiers of real estate and investors in real estate. For occupiers, we provide facilities management, project management, transaction (both property sales and tenant leasing) and consulting services, among others. For investors, we provide capital markets (property sales, commercial mortgage brokerage, loan origination and servicing), leasing, investment management, property management, valuation and development services, among others. We provide commercial real estate services under the “CBRE” brand name, investment management services under the “CBRE Global Investors” brand name and development services under the “Trammell Crow Company” brand name.
Our revenue mix has shifted in recent years toward more contractual revenue as occupiers and investors increasingly prefer to purchase integrated, account-based services from firms that meet the full spectrum of their needs nationally and globally. We believe we are well-positioned to capture a growing share of this business. We generate revenue from both management fees (large multi-year portfolio and per-project contracts) and commissions on transactions. Our contractual, fee-for-services businesses generally involve occupier outsourcing (including facilities and project management), property management, investment management, appraisal/valuation and loan servicing). In addition, our leasing services business line is largely recurring in nature over time.
In 2017, we generated revenue from a highly diversified base of clients, including more than 90 of the Fortune 100 companies. We have been an S&P 500 company since 2006 and in 2017 we were ranked #214 on the Fortune 500. We have been voted the most recognized commercial real estate brand in a Lipsey Company survey for 17 years in a row (including 2018). We have also been rated a World’s Most Ethical Company by the Ethisphere Institute for five consecutive years.
CBRE History
We marked our 112th year of continuous operations in 2018, tracing our origins to a company founded in San Francisco in the aftermath of the 1906 earthquake. Since then, we have grown into the largest global commercial real estate services and investment firm (in terms of 2017 revenue) through organic growth and a series of strategic acquisitions. Among these are the following acquisitions: Global Workplace Solutions (September 2015); Norland Managed Services Ltd (December 2013); ING Group N.V.’s Real Estate Investment Management (REIM) operations in Europe and Asia (October 2011) and its U.S.-based global real estate listed securities business (July 2011); and Trammell Crow Company (December 2006).
Our Regions of Operation and Principal Services
CBRE Group, Inc. is a holding company that conducts all of its operations through its indirect subsidiaries. CBRE Group, Inc. does not have any independent operations or employees. CBRE Services, Inc., our direct wholly-owned subsidiary, is also a holding company and is the primary obligor or issuer with respect to most of our long-term indebtedness.
We report our operations through the following segments: (1) Americas; (2) Europe, Middle East and Africa, or EMEA; (3) Asia Pacific; (4) Global Investment Management; and (5) Development Services.
1
Information regarding revenue and operating income or loss, attributable to each of our segments, is included in “Segment Operations” within the “Management’s Discussion and Analysis of Financial Condition and Results of Operations” section and within Note 18 of our Notes to Consolidated Financial Statements, which are incorporated herein by reference. Information concerning the identifiable assets of each of our business segments is also set forth in Note 18 of our Notes to Consolidated Financial Statements, which is incorporated herein by reference.
The Americas
The Americas is our largest reporting segment, comprised of operations throughout the United States and Canada as well as key markets in Latin America.
Most of our operations are conducted through our indirect wholly-owned subsidiary CBRE, Inc. Our mortgage loan origination, sales and servicing operations are conducted exclusively through our indirect wholly-owned subsidiary operating under the name CBRE Capital Markets, Inc., or CBRE Capital Markets, and its subsidiaries. Our operations in Canada are conducted through our indirect wholly-owned subsidiary CBRE Limited and our operations in Latin America are operated through various indirect wholly-owned subsidiaries. Our Americas segment accounted for 55.3% of our 2017 revenue, 55.4% of our 2016 revenue and 57.1% of our 2015 revenue.
Our operations also include independent affiliates to whom we license the “CBRE” name in their local markets in return for payments of annual or quarterly royalty fees to us and an agreement to cross-refer business between us and the affiliate. Revenue from affiliates totaled less than 1% of total revenue in our Americas segment in 2017.
Within our Americas segment, we organize our services into several business lines, as further described below.
Leasing Services
Through our Advisory & Transaction Services business line, we provide strategic advice and execution to owners, investors and occupiers in connection with leasing of office, industrial and retail space. We generate significant repeat business from existing clients, which, for example, accounted for approximately 71% of our U.S. leasing activity in 2017, including referrals from other parts of our business. We believe we are a market leader for the provision of these services in most top U.S. metropolitan statistical areas (as defined by the U.S. Census Bureau), including Atlanta, Austin, Chicago, Dallas, Houston, Los Angeles, New York, Philadelphia, Phoenix, San Francisco, and Seattle.
We offer clients fully integrated property sales and mortgage and structured financing services under the CBRE Capital Markets brand. The tight integration of these services helps to meet marketplace demand for comprehensive capital markets solutions. During 2017, we concluded approximately $130.4 billion of capital markets transactions in the Americas, including $87.2 billion of property sales transactions and $43.2 billion of mortgage originations and loan sales.
We are the leading property sales advisor in the United States, accounting for approximately 17% of investment sales transactions greater than $2.5 million across office, industrial, retail, multifamily and hotel properties in 2017, according to Real Capital Analytics. Our mortgage brokerage business brokers, originates and services commercial mortgage loans primarily through relationships established with national and regional banks, credit companies, insurance companies, pension funds, investment banking firms and government agencies. In the Americas, our mortgage loan origination volume in 2017 was $42.8 billion, including approximately $17.9 billion for U.S. Government Sponsored Enterprises (GSEs). Most of the GSE loans were financed through revolving warehouse credit lines through a CBRE subsidiary that is dedicated exclusively for this purpose and were substantially risk mitigated by either obtaining a contractual purchase commitment from the GSE or confirming a forward-trade commitment for the issuance and purchase of a mortgage-backed security that will be secured by the loan. We advised on the sale of approximately $0.4 billion of mortgages on behalf of financial institutions in 2017.
2
We also oversee a loan servicing portfolio, which totaled approximately $141 billion in the Americas (approximately $174 billion globally) at year-end 2017.
Our real estate services professionals are compensated primarily through commissions, which are payable upon completion of an assignment. This mitigates the effect of compensation, our largest expense, on our operating margins during difficult market conditions. We strive to retain top professionals through an attractive compensation program tied to productivity as well as greater investments in support resources, including professional development and training, market research and information, technology, branding and marketing, than most other firms in our sector.
We further strengthen our relationships with our real estate services clients by offering proprietary research to them through CBRE Research and CBRE Econometric Advisors, our commercial real estate market information and forecasting groups.
Valuation
We provide valuation services that include market-value appraisals, litigation support, discounted cash flow analyses, feasibility studies as well as consulting services such as property condition reports, hotel advisory and environmental consulting. Our valuation business has developed proprietary systems for data management, analysis and valuation report preparation, which we believe provide us with an advantage over our competitors. We believe that our valuation business is one of the largest in the commercial real estate industry. During 2017, we completed nearly 70,000 valuation, appraisal and advisory assignments in the Americas.
Occupier Outsourcing
We provide a broad suite of services to occupiers of real estate, including facilities management, project management, transaction management and strategic consulting. We report facilities and project management as well as strategic consulting activities in our occupier outsourcing revenue line and transaction management in our lease and sales revenue lines.
We believe the outsourcing of commercial real estate services is a long-term trend in our industry, with occupiers, such as corporations, public sector entities, health care providers and others, achieving better execution and improved efficiency by relying on the expertise of third-party real estate specialists.
We typically enter into multi-year, often multi-service, outsourcing contracts with our clients and also provide services on a one-off assignment or a short-term contract basis. Facilities management involves the day-to-day management of client-occupied space and includes headquarter buildings, regional offices, administrative offices, data centers and other critical facilities, manufacturing and laboratory facilities, distribution facilities and retail space. Contracts for facilities management services are often structured so we are reimbursed for client-dedicated personnel costs and subcontracted vendor costs as well as associated overhead expenses plus a monthly fee, and in some cases, annual incentives tied to agreed-upon performance targets, with any penalties typically capped. Project management services are typically provided on a portfolio-wide or programmatic basis. Revenues for project management generally include fixed management fees, variable fees, and incentive fees if certain agreed-upon performance targets are met. Revenues for project management may also include reimbursement of payroll and related costs for personnel providing the services.
Property Management
We provide property management services on a contractual basis for owners/investors in office, industrial and retail properties. These services include construction management, marketing, building engineering, accounting and financial services.
We typically receive monthly management fees for the property management services we provide based upon a specified percentage of the monthly rental income or rental receipts generated from the property under management, or in certain cases, the greater of such percentage fee or a minimum agreed-upon fee. We are also
3
often reimbursed for our administrative and payroll costs, as well as certain out-of-pocket expenses, directly attributable to the properties under management. Our management agreements with our property management services clients may be terminated by either party with notice generally ranging between 30 to 90 days; however, we have developed long-term relationships with many of these clients and the typical contract continues for multiple years. We believe our contractual relationships with these clients put us in an advantageous position to provide other services to them, including leasing, refinancing, disposition and appraisal.
Europe, Middle East and Africa (EMEA)
Our Europe, Middle East and Africa, or EMEA, reporting segment serves clients in approximately 70 countries. The largest operations are located in France, Germany, Ireland, Italy, The Netherlands, Spain, Switzerland and the United Kingdom. We generally provide a full range of services to the commercial property sector in this segment. Additionally, we provide some residential property services, focused on the prime and super-prime segments of the market, primarily in the United Kingdom. Within EMEA, our services are organized along similar lines as in the Americas, including leasing, property sales, valuation services, asset management services and occupier outsourcing, among others. Our EMEA segment accounted for 29.3% of our 2017 revenue, 29.7% of our 2016 revenue and 27.5% of our 2015 revenue.
In several countries in EMEA, we have contractual relationships with independent affiliates that provide commercial real estate services under our brand name. Our agreements with these independent affiliates include licenses by us to them to use the “CBRE” name in the relevant territory in return for payments of annual or quarterly royalty fees to us. In addition, these agreements typically provide for the cross-referral of business between us and our affiliates. Revenue from affiliates totaled less than 1% of total revenue in our EMEA segment in 2017.
Asia Pacific
Our Asia Pacific reporting segment serves clients in approximately 20 countries. Our largest operations in Asia are located in Greater China, India, Japan, Singapore and Thailand. The Pacific region includes Australia and New Zealand. In these countries, we generally provide a full range of real estate services to the commercial sector in this segment, similar to the services provided by our Americas and EMEA segments. We also provide services to the residential property sector predominantly in the Pacific region. Our Asia Pacific segment accounted for 12.2% of our 2017 revenue, 11.5% of our 2016 revenue and 10.5% of our 2015 revenue.
In several countries in Asia, we have contractual agreements with independent affiliates that generate royalty fees and support cross-referral arrangements similar to our EMEA segment. Revenue from affiliates totaled less than 1% of total revenue in our Asia Pacific segment in 2017.
Global Investment Management
Operations in our Global Investment Management reporting segment are conducted through our indirect wholly-owned subsidiary CBRE Global Investors, LLC and its global affiliates, which we also refer to as CBRE Global Investors. CBRE Global Investors provides investment management services to pension funds, insurance companies, sovereign wealth funds, foundations, endowments and other institutional investors seeking to generate returns and diversification through investment in real estate. It sponsors investment programs that span the risk/return spectrum in: North America, Europe, Asia and Australia. In some strategies, CBRE Global Investors and its investment teams co-invest with its limited partners.
CBRE Global Investors’ offerings are organized into four primary categories: (1) direct real estate investments through sponsored funds; (2) direct real estate investments through separate accounts; (3) indirect real estate and infrastructure investments through listed securities; and (4) indirect real estate, infrastructure and private equity investments through multi-manager investment programs.
Assets under management, or AUM, totaled $103.2 billion at December 31, 2017 as compared to $86.6 billion at December 31, 2016. Favorable currency movement added $5.3 billion to AUM in the current year. Our Global
4
Investment Management segment accounted for 2.7% of our 2017 revenue, 2.8% of our 2016 revenue and 4.2% of our 2015 revenue.
Development Services
Operations in our Development Services reporting segment are conducted through our indirect wholly-owned subsidiary Trammell Crow Company, LLC, which we also refer to as Trammell Crow Company, and certain of its subsidiaries, providing development services primarily in the United States to users of and investors in commercial real estate, as well as for its own account. Trammell Crow Company pursues opportunistic, risk-mitigated development and investment in commercial real estate across a wide spectrum of property types, including: industrial, office and retail properties; healthcare facilities of all types (medical office buildings, hospitals and ambulatory surgery centers); and residential/mixed-use projects. Our Development Services segment accounted for 0.5% of our 2017 revenue, 0.5% of our 2016 revenue and 0.6% of our 2015 revenue.
Trammell Crow Company pursues development and investment activity on behalf of its clients on a fee basis (with no ownership interest in a property), in partnership with its clients (through co-investment – either on an individual project basis or through programs with certain strategic capital partners) or for its own account (100% ownership). Development activity in which Trammell Crow Company has an ownership interest is conducted through subsidiaries that are consolidated or unconsolidated for financial reporting purposes, depending primarily on the extent and nature of our ownership interest.
At December 31, 2017, Trammell Crow Company had $6.8 billion of development projects in process. Additionally, the inventory of pipeline deals (prospective projects we believe have a greater than 50% chance of closing or where land has been acquired and the projected construction start date is more than twelve months out) was $3.8 billion at December 31, 2017.
Competition
We compete across a variety of business lines within the commercial real estate industry, including property management, facilities management, project and transaction management, tenant and landlord leasing, capital markets solutions (property sales, commercial mortgage origination and structured finance) real estate investment management, valuation, loan servicing, development services and proprietary research. Each business line is highly competitive on an international, national, regional and local level. Although we are the largest commercial real estate services firm in the world in terms of 2017 revenue, our relative competitive position varies significantly across geographic markets, property types and services. We face competition from other commercial real estate service providers that compete with us on a global, national, regional or local basis or within a market segment; outsourcing companies that traditionally competed in limited portions of our facilities management business and have expanded their offerings from time to time; in-house corporate real estate departments and property owners/developers that self-perform real estate services; investment banking firms, investment managers and developers that compete with us to raise and place investment capital; and accounting/consulting firms that advise on real estate strategies. Some of these firms may have greater financial resources than we do.
Despite recent consolidation, the commercial real estate services industry remains highly fragmented and competitive. Although many of our competitors are substantially smaller than we are, some of them are larger on a regional or local basis or have a stronger position in a specific market segment or service offering. Among our primary competitors are other large national and global firms, such as JLL, Cushman & Wakefield, Colliers International Group Inc., Savills plc and Newmark Group, Inc.; market-segment specialists, such as Eastdil Secured, HFF, L.P., Marcus & Millichap, Inc. and Walker & Dunlop, Inc.; and firms with business lines that compete with our occupier outsourcing business, such as ISS, Sodexo, and ABM.
Seasonality
A significant portion of our revenue is seasonal, which an investor should keep in mind when comparing our financial condition and results of operations on a quarter-by-quarter basis. Historically, our revenue, operating income, net income and cash flow from operating activities tend to be lowest in the first quarter, and highest in the
5
fourth quarter of each year. Revenue, earnings and cash flow have generally been concentrated in the fourth calendar quarter due to the focus on completing sales, financing and leasing transactions prior to year-end.
Employees
At December 31, 2017, excluding our independent affiliates, we had more than 80,000 employees worldwide, approximately 37% of whose costs are fully reimbursed by clients and are mostly in our Occupier Outsourcing and Property Management lines of business. At December 31, 2017, approximately 1,900 of our employees were subject to collective bargaining agreements, most of whom work in properties we manage in California, Illinois, New Jersey and New York.
We hold various trademarks and trade names worldwide, which include the “CBRE” name. Although we believe our intellectual property plays a role in maintaining our competitive position in a number of the markets that we serve, we do not believe we would be materially, adversely affected by expiration or termination of our trademarks or trade names or the loss of any of our other intellectual property rights other than the “CBRE” and “Trammell Crow Company” names. We maintain trademark registrations for the CBRE service mark in jurisdictions where we conduct significant business.
We hold a license to use the “Trammell Crow Company” trade name pursuant to a license agreement with CF98, L.P., an affiliate of Crow Realty Investors, L.P., d/b/a Crow Holdings, which may be revoked if we fail to satisfy usage and quality control covenants under the license agreement.
In addition to trademarks and trade names, we have acquired and developed proprietary technologies for the provision of complex services and analysis. We also offer proprietary research to clients through CBRE Econometric Advisors and we offer proprietary investment analysis and structures through CBRE Global Investors. While we have not generally registered these items of intellectual property in any jurisdiction, we may seek to secure our rights under applicable intellectual property protection laws in these and any other proprietary assets that we use in our business.
Environmental Matters
Federal, state and local laws and regulations in the countries in which we do business impose environmental liabilities, controls, disclosure rules and zoning restrictions that affect the ownership, management, development, use or sale of commercial real estate. Certain of these laws and regulations may impose liability on current or previous real property owners or operators for the cost of investigating, cleaning up or removing contamination caused by hazardous or toxic substances at a property, including contamination resulting from above-ground or underground storage tanks or the presence of asbestos or lead at a property. If contamination occurs or is present during our role as a property or facility manager or developer, we could be held liable for such costs as a current “operator” of a property, regardless of the legality of the acts or omissions that caused the contamination and without regard to whether we knew of, or were responsible for, the presence of such hazardous or toxic substances. The operator of a site also may be liable under common law to third parties for damages and injuries resulting from exposure to hazardous substances or environmental contamination at a site, including liabilities arising from exposure to asbestos-containing materials. Under certain laws and common law principles, any failure by us to disclose environmental contamination at a property could subject us to liability to a buyer or lessee of the property. Further, federal, state and local governments in the countries in which we do business have enacted various laws, regulations and treaties governing environmental and climate change, particularly for “greenhouse gases,” which seek to tax, penalize or limit their release. Such regulations could lead to increased operational or compliance costs over time.
While we are aware of the presence or the potential presence of regulated substances in the soil or groundwater at or near several properties owned, operated or managed by us that may have resulted from historical or ongoing activities on those properties, we are not aware of any material noncompliance with the environmental laws or regulations currently applicable to us, and we are not the subject of any material claim for liability with respect to contamination at any location. However, these laws and regulations may discourage sales and leasing activities and mortgage lending with respect to some properties, which may adversely affect both the commercial
6
real estate services industry in general and us. Environmental contamination or other environmental liabilities may also negatively affect the value of commercial real estate assets held by entities that are managed by our Global Investment Management and Development Services businesses, which could adversely affect the results of operations of these business lines.
Available Information
Our internet address is www.cbre.com. We use our website as a channel of distribution for company information, and financial and other material information regarding us is routinely posted and accessible on our website.
On the Investor Relations page of our website, we post the following filings as soon as reasonably practicable after they are electronically filed with or furnished to the Securities and Exchange Commission, or the SEC: our Annual Report on Form 10-K, our Proxy Statement on Schedule 14A, our Quarterly Reports on Form 10-Q, our Current Reports on Form 8-K and any amendments to those reports filed or furnished pursuant to Section 13(a) or 15(d) of the Securities Exchange Act of 1934, as amended, or the Exchange Act. We also make available through our website other reports filed with or furnished to the SEC under the Exchange Act, including reports filed by our officers and directors under Section 16(a) of the Exchange Act.
All of the information on our Investor Relations web page is available to be viewed free of charge. Information contained on our website is not part of this Annual Report on Form 10-K or our other filings with the SEC. We assume no obligation to update or revise any forward-looking statements in this Annual Report on Form 10-K, whether as a result of new information, future events or otherwise, unless we are required to do so by law.
A copy of this Annual Report on Form 10-K is available without charge upon written request to: Investor Relations, CBRE Group, Inc., 200 Park Avenue, New York, New York 10166. The SEC also maintains a website (www.sec.gov) that contains reports, proxy and information statements and other information regarding issuers that file electronically with the SEC.
Set forth below and elsewhere in this report and in other documents we file with the SEC are risks and uncertainties that could cause our actual results to differ materially from the results contemplated by the forward-looking statements contained in this report and other public statements we make. Based on the information currently known to us, we believe that the matters discussed below identify the material risk factors affecting our business. However, the risks and uncertainties we face are not limited to those described below. Additional risks and uncertainties not presently known to us or that we currently believe to be immaterial (but that later become material) may also adversely affect our business.
The success of our business is significantly related to general economic conditions and, accordingly, our business, operations and financial condition could be adversely affected by economic slowdowns, liquidity crises, fiscal or political uncertainty and possible subsequent downturns in commercial real estate asset values, property sales and leasing activities in one or more of the geographies or industry sectors that we or our clients serve.
Periods of economic weakness or recession, significantly rising interest rates, fiscal or political uncertainty, market volatility, declining employment levels, declining demand for commercial real estate, falling real estate values, disruption to the global capital or credit markets or the public perception that any of these events may occur, may negatively affect the performance of some or all of our business lines.
Our business is significantly affected by generally prevailing economic conditions in the markets where we principally operate, which can result in a general decline in real estate acquisition, disposition and leasing activity, as well as a general decline in the value of commercial real estate and in rents, which in turn reduces revenue from property management fees and commissions derived from property sales, leasing, valuation and financing, as well as revenues associated with development or investment management activities. Our businesses could also suffer from political or economic disruptions that affect interest rates or liquidity or create financial, market or regulatory uncertainty. For example, the ongoing negotiations with respect to the terms of the United Kingdom’s referendum to
7
leave the European Union, and speculation about the terms and consequences of this exit or that of other European Union members has caused and may continue to cause market volatility and currency fluctuations and adversely impact our clients’ confidence, which may result in a deterioration in our U.K. and other European businesses as leasing and investing activity slow down.
Adverse economic conditions or political or regulatory uncertainty could also lead to a decline in property sales prices as well as a decline in funds invested in existing commercial real estate assets and properties planned for development, which in turn could reduce the commissions and fees that we earn. In addition, our development and investment strategy often entails making co-investments alongside our investor clients. During an economic downturn, capital for our investment activities is usually constrained and it may take longer for us to dispose of real estate investments or selling prices may be lower than originally anticipated. As a result, the value of our commercial real estate investments may be reduced, and we could realize losses or diminished profitability. In addition, economic downturns may reduce the amount of loan originations and related servicing by our Capital Markets business.
The performance of our Property Management business depends upon how well the properties we manage perform. This is because our fees are generally based on a percentage of rent collections from these properties. Rent collections may be affected by many factors, including: (i) real estate and financial market conditions prevailing generally and locally; (ii) our ability to attract and retain creditworthy tenants, particularly during economic downturns; and (iii) the magnitude of defaults by tenants under their respective leases, which may increase during distressed economic conditions.
In continental Europe and Asia Pacific, the economies in certain countries can be fragile, which may adversely affect our financial performance.
Economic, political and regulatory uncertainty as well as significant changes and volatility in the financial markets and business environment, and in the global landscape, make it increasingly difficult for us to predict our financial performance into the future. As a result, any guidance or outlook that we provide on our performance is based on then-current conditions, and there is a risk that such guidance may turn out to be inaccurate.
Adverse developments in the credit markets may harm our business, results of operations and financial condition.
Our Global Investment Management, Development Services and Capital Markets (including property sales and mortgage and structured financing services) businesses are sensitive to credit cost and availability as well as marketplace liquidity. Additionally, the revenues in all of our businesses are dependent to some extent on the overall volume of activity (and pricing) in the commercial real estate market.
Disruptions in the credit markets may adversely affect our business of providing advisory services to owners, investors and occupiers of real estate in connection with the leasing, disposition and acquisition of property. If our clients are unable to procure credit on favorable terms, there may be fewer completed leasing transactions, dispositions and acquisitions of property. In addition, if purchasers of commercial real estate are not able to procure favorable financing resulting in the lack of disposition opportunities for our funds and projects, our Global Investment Management and Development Services businesses may be unable to generate incentive fees, and we may also experience losses of co-invested equity capital if the disruption causes a permanent decline in the value of investments made.
Our operations are subject to social, political and economic risks in foreign countries as well as foreign currency volatility.
We conduct a significant portion of our business and employ a substantial number of people outside of the United States and as a result, we are subject to risks associated with doing business globally. During 2017, approximately 48% of our revenue was transacted in foreign currencies, the majority of which included the Australian dollar, Brazilian real, British pound sterling, Canadian dollar, Chinese yuan, Czech koruna, Danish krone, euro, Hong Kong dollar, Indian rupee, Japanese yen, Korean won, Mexican peso, Polish zloty, Singapore dollar, Swedish krona, Swiss franc and Thai baht. Fluctuations in foreign currency exchange rates may result in
8
corresponding fluctuations in our assets under management for our Global Investment Management business, revenue and earnings. Over time, fluctuations in the value of the U.S. dollar relative to the other currencies in which we may generate earnings could adversely affect our business, financial condition and operating results. Due to the constantly changing currency exposures to which we are subject and the volatility of currency exchange rates, we cannot predict the effect of exchange rate fluctuations upon future operating results. For example, the ongoing negotiations with respect to the United Kingdom’s referendum to leave the European Union or other changes to the membership or policies of the European Union, or speculation about such events, may cause additional volatility in international currency markets. In addition, fluctuations in currencies relative to the U.S. dollar may make it more difficult to perform period-to-period comparisons of our reported results of operations.
Additional circumstances and developments related to international operations that could negatively affect our business, financial condition or results of operations include, but are not limited to, the following factors:
|
|
• |
difficulties and costs of staffing and managing international operations among diverse geographies, languages and cultures; |
|
|
• |
currency restrictions, transfer pricing regulations and adverse tax consequences, which may affect our ability to transfer capital and profits to the United States; |
|
|
• |
adverse changes in regulatory or tax requirements and regimes or uncertainty about the application of or the future of such regulatory or tax requirements and regimes; |
|
|
• |
the responsibility of complying with numerous, potentially conflicting and frequently complex and changing laws in multiple jurisdictions, e.g., with respect to corrupt practices, embargoes, trade sanctions, employment and licensing; |
|
|
• |
the impact of regional or country-specific business cycles and economic instability; |
|
|
• |
greater difficulty in collecting accounts receivable in some geographic regions such as Asia, where many countries have underdeveloped insolvency laws; |
|
|
• |
a tendency for clients to delay payments in some European and Asian countries; |
|
|
• |
political and economic instability in certain countries; |
|
|
• |
foreign ownership restrictions with respect to operations in certain countries, particularly in Asia Pacific, or the risk that such restrictions will be adopted in the future; and |
|
|
• |
changes in U.S. laws or policies governing foreign trade or investment and use of foreign operations or workers, and any negative sentiments towards the United States as a result of any such changes to laws or policies. |
We maintain anti-corruption and anti-money-laundering compliance programs and programs designed to enable us to comply with applicable government economic sanctions, embargoes and other import/export controls throughout the company. But, coordinating our activities to deal with the broad range of complex legal and regulatory environments in which we operate presents significant challenges. We may not be successful in complying with regulations in all situations and violations may result in criminal or civil sanctions, including material monetary fines, penalties, equitable remedies (including disgorgement), and other costs against us or our employees, and may have a material adverse effect on our reputation and business.
We have committed additional resources to expand our worldwide sales and marketing activities, to globalize our service offerings and products in select markets and to develop local sales and support channels. If we are unable to successfully implement these plans, maintain adequate long-term strategies that successfully manage the risks associated with our global business or adequately manage operational fluctuations, our business, financial condition or results of operations could be harmed. In addition, we have penetrated, and seek to continue to enter into, emerging markets to further expand our global platform. However, we may not be successful in effectively evaluating and monitoring the key business, operational, legal and compliance risks specific to those markets. The political and cultural risks present in emerging countries could also harm our ability to successfully execute our operations or manage our businesses there.
9
Our success depends upon the retention of our senior management, as well as our ability to attract and retain qualified and experienced employees.
Our continued success is highly dependent upon the efforts of our executive officers and other key employees, including Robert E. Sulentic, our President and Chief Executive Officer. While certain of our executive officers and key employees are subject to long-term compensatory arrangements from time to time, which include retention incentives and various restrictive covenants, there can be no assurance that we will be able to retain all key members of our senior management. We also are highly dependent upon the retention of our property sales and leasing professionals, who generate a significant amount of our revenues, as well as other revenue producing professionals. The departure of any of our key employees, or the loss of a significant number of key revenue producers, if we are unable to quickly hire and integrate qualified replacements, could cause our business, financial condition and results of operations to suffer. Competition for these personnel is significant and we may not be able to successfully recruit, integrate or retain sufficiently qualified personnel. In addition, the growth of our business is largely dependent upon our ability to attract and retain qualified support personnel in all areas of our business. We and our competitors use equity incentives and sign-on and retention bonuses to help attract, retain and incentivize key personnel. As competition is significant for the services of such personnel, the expense of such incentives and bonuses may increase and we may be unable to attract or retain such personnel to the same extent that we have in the past. Any significant decline in, or failure to grow, our stock price may result in an increased risk of loss of these key personnel. Furthermore, shareholder influence on our compensation practices, including our ability to issue equity compensation, may decrease our ability to offer attractive compensation to key personnel and make recruiting, retaining and incentivizing such personnel more difficult. If we are unable to attract and retain these qualified personnel, our growth may be limited and our business and operating results could suffer.
We have numerous local and global competitors across all of our business lines and the geographies that we serve, and further industry consolidation could lead to significant future competition.
We compete across a variety of business disciplines within the commercial real estate services and investment industry, including property management, facilities management, project and transaction management, tenant and landlord leasing, capital markets solutions (property sales, commercial mortgage origination and structured finance), real estate investment management, valuation, loan servicing, development services and proprietary research. Although we are the largest commercial real estate services firm in the world in terms of 2017 revenue, our relative competitive position varies significantly across geographies, property types and services and business lines. Depending on the geography, property type or service or business line, we face competition from other commercial real estate service providers and investment firms, including outsourcing companies that traditionally competed in limited portions of our facilities management business and have expanded their offerings from time to time, in-house corporate real estate departments, developers, institutional lenders, insurance companies, investment banking firms, investment managers and accounting and consulting firms. Some of these firms may have greater financial resources allocated to a particular geography, property type or service or business line than we have allocated to that geography, property type, service or business line. In addition, future changes in laws could lead to the entry of other new competitors, such as financial institutions. Although many of our existing competitors are local or regional firms that are smaller than we are, some of these competitors are larger on a local or regional basis. We are further subject to competition from large national and multi-national firms that have similar service and investment competencies to ours, and it is possible that further industry consolidation could lead to much larger and more formidable competitors globally or in the particular geographies, property types, service or business lines that we serve. There is no assurance that we will be able to compete effectively, to maintain current fee levels or margins, or maintain or increase our market share.
Our growth has benefited significantly from acquisitions, which may not perform as expected and similar opportunities may not be available in the future.
A significant component of our growth over time has been generated by acquisitions. Any future growth through acquisitions will depend in part upon the continued availability of suitable acquisition candidates at favorable prices and upon advantageous terms and conditions, which may not be available to us, as well as sufficient liquidity and credit to fund these acquisitions. We may incur significant additional debt from time to time to finance any such acquisitions, subject to the restrictions contained in the documents governing our then-existing indebtedness. If we incur additional debt, the risks associated with our leverage, including our ability to service our
10
then-existing debt, would increase. Acquisitions involve risks that business judgments concerning the value, strengths and weaknesses of businesses acquired may prove incorrect. Future acquisitions and any necessary related financings also may involve significant transaction-related expenses, which include severance, lease termination, transaction and deferred financing costs, among others.
We have had, and may continue to experience, challenges in integrating operations and information technology systems acquired from other companies. This could result in the diversion of management’s attention from other business concerns and the potential loss of our key employees or clients or those of the acquired operations. The integration process itself may be disruptive to our business and the acquired company’s businesses as it requires coordination of geographically diverse organizations and implementation of new accounting and information technology systems. We believe that most acquisitions will initially have an adverse impact on operating and net income. Acquisitions also frequently involve significant costs related to integrating information technology and accounting and management services.
We complete acquisitions with the expectation that they will result in various benefits, including enhanced or more stable revenues, a strengthened market position, cross-selling opportunities, cost synergies, tax benefits and accretion to our adjusted income per share. Achieving the anticipated benefits of these acquisitions is subject to a number of uncertainties, including the realization of accretive benefits in the timeframe anticipated and whether we can successfully integrate the acquired business. Failure to achieve these anticipated benefits could result in increased costs, decreases in the amount of expected revenues and diversion of management’s time and energy, which could in turn materially and adversely affect our overall business, financial condition and operating results.
Our joint venture activities and affiliate program involve unique risks that are often outside of our control and that, if realized, could harm our business.
We have utilized joint ventures for commercial investments, select local brokerage and other affiliations both in the United States and internationally, and we may acquire interests in other joint ventures in the future. Under our affiliate program, we enter into contractual relationships with local brokerage, property management or other operations pursuant to which we license to that operation our name and make available certain of our resources, in exchange for a royalty or economic participation in that operation’s revenue, profits or transactional activity. In many of these joint ventures and affiliations, we may not have the right or power to direct the management and policies of the joint ventures or affiliates, and other participants or operators of affiliates may take action contrary to our instructions or requests and against our policies and objectives. In addition, the other participants and operators may become bankrupt or have economic or other business interests or goals that are inconsistent with ours. If a joint venture participant or affiliate acts contrary to our interest, it could harm our brand, business, results of operations and financial condition.
Our real estate investment and co-investment activities in our Global Investment Management as well as Development Services businesses subject us to real estate investment risks which could cause fluctuations in our earnings and cash flow.
An important part of the strategy for our Global Investment Management business involves co-investing our capital in certain real estate investments with our clients, and there is an inherent risk of loss of our investments. As of December 31, 2017, we had committed $38.6 million to fund future co-investments in our Global Investment Management business, $31.9 million of which is expected to be funded during 2018. In addition to required future capital contributions, some of the co-investment entities may request additional capital from us and our subsidiaries holding investments in those assets. However, our debt instruments contain restrictions that may limit our ability to provide capital to the entities holding direct or indirect interests in co-investments. The failure to provide these contributions could have adverse consequences to our interests in these investments, including damage to our reputation with our co-investment partners and clients, as well as the necessity of obtaining alternative funding from other sources that may be on disadvantageous terms for us and the other co-investors. Participating as a co-investor is an important part of our Global Investment Management business, which might suffer if we were unable to make these investments.
Selective investment in real estate projects is an important part of our Development Services business strategy, and there is an inherent risk of loss of our investments. As of December 31, 2017, we had eight real estate projects
11
consolidated in our financial statements. In addition, at December 31, 2017, we were involved as a principal (in most cases, co-investing with our clients) in approximately 70 unconsolidated real estate subsidiaries with invested equity of $111.8 million and had committed additional capital to these unconsolidated subsidiaries of $20.8 million. As of December 31, 2017, we also guaranteed outstanding notes payable of these unconsolidated subsidiaries with outstanding balances of $9.3 million.
During the ordinary course of our Development Services business, we provide numerous completion and budget guarantees requiring us to complete the relevant project within a specified timeframe and/or within a specified budget, with us potentially being liable for costs to complete in excess of such timeframe or budget. While we generally have “guaranteed maximum price” contracts with reputable general contractors with respect to projects for which we provide these guarantees (which are intended to pass most of the risk to such contractors), there can be no assurance that we will not have to perform under any such guarantees. If we are required to perform under a significant number of such guarantees, it could harm our business, results of operations and financial condition.
Because the disposition of a single significant investment can affect our financial performance in any period, our real estate investment activities could cause fluctuations in our net earnings and cash flow. In many cases, we have limited control over the timing of the disposition of these investments and the recognition of any related gain or loss, or incentive participation fee.
Poor performance of the investment programs that our Global Investment Management business manages would cause a decline in our revenue, net income and cash flow and could adversely affect our ability to raise capital for future programs.
The revenue, net income and cash flow generated by our Global Investment Management business can be volatile period over period, primarily due to the fact that management, transaction and incentive fees can vary as a result of market movements from one period to another. In the event that any of the investment programs that our Global Investment Management business manages were to perform poorly, our revenue, net income and cash flow could decline because the value of the assets we manage would decrease, which would result in a reduction in some of our management fees, and our investment returns would decrease, resulting in a reduction in the incentive compensation we earn. Moreover, we could experience losses on co-investments of our own capital in such programs as a result of poor performance. Investors and potential investors in our programs continually assess our performance, and our ability to raise capital for existing and future programs and maintaining our current fee structure will depend on our continued satisfactory performance.
Our debt instruments impose operating and financial restrictions on us, and in the event of a default, all of our borrowings would become immediately due and payable.
We have debt and related debt service obligations. As of December 31, 2017, our total debt, excluding notes payable on real estate (which are generally nonrecourse to us) and warehouse lines of credit (which are recourse only to our wholly-owned subsidiary, CBRE Capital Markets, and are secured by our related warehouse receivables), was approximately $2.0 billion. For the year ended December 31, 2017, our interest expense was approximately $136.8 million.
Our debt instruments impose, and the terms of any future debt may impose, operating and other restrictions on us and many of our subsidiaries. These restrictions affect, and in many respects limit or prohibit, our ability to:
|
|
o |
plan for or react to market conditions; |
|
|
o |
meet capital needs or otherwise restrict our activities or business plans; and |
|
|
o |
finance ongoing operations, strategic acquisitions, investments or other capital needs or to engage in other business activities that would be in our interest, including: |
|
|
o |
incurring or guaranteeing additional indebtedness; |
|
|
o |
entering into consolidations and mergers; |
12
|
|
o |
entering into sale/leaseback transactions. |
Our credit agreement currently requires us to maintain a minimum interest coverage ratio of consolidated EBITDA (as defined in the credit agreement) to consolidated interest expense (as defined in the credit agreement) of 2.00x and a maximum leverage ratio of total debt (as defined in the credit agreement) less available cash (as defined in the credit agreement) to consolidated EBITDA of 4.25x (and, in the case of the first four full fiscal quarters following the consummation of a qualified acquisition (as defined in the credit agreement), 4.75x) as of the end of each fiscal quarter. On this basis, our coverage ratio of consolidated EBITDA to consolidated interest expense was 14.74x for the year ended December 31, 2017, and our leverage ratio of total debt less available cash to consolidated EBITDA was 0.79x as of December 31, 2017. Our ability to meet these financial ratios can be affected by events beyond our control, and we cannot give assurance that we will be able to meet those ratios when required. We continue to monitor our projected compliance with these financial ratios and other terms of our credit agreement.
A breach of any of these restrictive covenants or the inability to comply with the required financial ratios could result in a default under our debt instruments. If any such default occurs, the lenders under our credit agreement may elect to declare all outstanding borrowings, together with accrued interest and other fees, to be immediately due and payable. The lenders under our credit agreement also have the right in these circumstances to terminate any commitments they have to provide further borrowings. In addition, a default under our credit agreement could trigger a cross default or cross acceleration under our other debt instruments.
Our credit agreement is jointly and severally guaranteed by us, each of our material U.S. subsidiaries which guarantees any of our other material indebtedness and certain of our foreign subsidiaries.
We have limited restrictions on the amount of additional recourse debt we are able to incur, which may intensify the risks associated with our leverage, including our ability to service our indebtedness. In addition, in the event of a credit-ratings downgrade, our ability to borrow and the costs of that borrowing could be adversely affected.
Subject to the maximum amounts of indebtedness permitted by our credit agreement covenants, we are not restricted in the amount of additional recourse debt we are able to incur, and so we may in the future incur such indebtedness in order to finance our operations and investments. In addition, Moody’s Investors Service, Inc. and Standard & Poor’s Ratings Services, rate our significant outstanding debt. These ratings, and any downgrades of them, may affect our ability to borrow as well as the costs of our current and future borrowings.
A significant portion of our revenue is seasonal, which could cause our financial results to fluctuate significantly.
A significant portion of our revenue is seasonal. Historically, our revenue, operating income, net income and cash flow from operating activities tend to be lowest in the first calendar quarter, and highest in the fourth calendar quarter of each year. Earnings and cash flow have generally been concentrated in the fourth calendar quarter due to the focus on completing sales, financing and leasing transactions prior to calendar year-end. This variance among periods makes it difficult to compare our financial condition and results of operations on a quarter-by-quarter basis. In addition, as a result of the seasonal nature of our business, political, economic or other unforeseen disruptions occurring in the fourth quarter that impact our ability to close large transactions may have a disproportionate effect on our financial condition and results of operations.
We are subject to various litigation and regulatory risks and may face financial liabilities and/or damage to our reputation as a result of litigation or regulatory proceedings.
Our businesses are exposed to various litigation and regulatory risks. In addition, although we maintain insurance coverage for most of this risk, insurance coverage is unavailable at commercially reasonable pricing for certain types of exposures. Accordingly, an adverse result in a litigation against us, or a lawsuit that results in a substantial legal liability for us (and particularly a lawsuit that is not insured), could have a disproportionate and material adverse effect on our business, financial condition and results of operations. Furthermore, an adverse result in regulatory proceedings, if applicable, could result in fines or other liabilities or adversely impact our operations.
13
In addition, we depend on our business relationships and our reputation for high-caliber professional services to attract and retain clients. As a result, allegations against us, or the announcement of a regulatory investigation involving us, irrespective of the ultimate outcome of that allegation or investigation, may harm our professional reputation and as such materially damage our business and its prospects.
We may be subject to actual or perceived conflicts of interest.
Similar to other global services companies with different business lines and a broad client base, we may be subject to potential actual or perceived conflicts of interests in the provision of our services. For example, conflicts may arise from our position as broker to both owners and tenants in commercial real estate lease transactions. In such situations, our policies are designed to give full disclosure and transparency to all parties as well as implement appropriate barriers on information-sharing and other activities to ensure each party’s interests are protected; however, there can be no assurance that our policies will be successful in every case. If we fail, or appear to fail, to identify, disclose and manage potential conflicts of interest, there could be an adverse effect on our business or reputation regardless of whether any such claims have merit. In addition, it is possible that in some jurisdictions, regulations could be changed to limit our ability to act for certain parties where potential conflicts may exist. There can be no assurance that potential conflicts of interest will not adversely affect us.
Failure to maintain and execute information technology strategies and ensure that our employees adapt to changes in technology could materially and adversely affect our ability to remain competitive in the market.
Our business relies heavily on information technology to deliver services that meet the needs of our clients. If we are unable to effectively execute our information technology strategies or adopt new technologies and processes relevant to our service platform, our ability to deliver high-quality services may be materially impaired. In addition, we make significant investments in new systems and tools to achieve competitive advantages and efficiencies. Implementation of such investments in information technology could exceed estimated budgets and we may experience challenges that prevent new strategies or technologies from being realized according to anticipated schedules. If we are unable to maintain current information technology and processes or encounter delays, or fail to exploit new technologies, then the execution of our business plans may be disrupted. Similarly, our employees require effective tools and techniques to perform functions integral to our business. Failure to successfully provide such tools and systems, or ensure that employees have properly adopted them, could materially and adversely impact our ability to achieve positive business outcomes.
Failure to maintain the security of our information and technology networks, including personally identifiable and client information, intellectual property and proprietary business information could significantly adversely affect us.
Security breaches and other disruptions of our information and technology networks could compromise our information and intellectual property and expose us to liability, reputational harm and significant remediation costs, which could cause material harm to our business and financial results. In the ordinary course of our business, we collect and store sensitive data, including our proprietary business information and intellectual property, and that of our clients and personally identifiable information of our employees and contractors, in our data centers and on our networks. The secure processing, maintenance and transmission of this information are critical to our operations. Despite our security measures, our information technology and infrastructure may be vulnerable to attacks by third parties or breached due to employee error, malfeasance or other disruptions. A significant actual or potential theft, loss, corruption, exposure, fraudulent use or misuse of client, employee or other personally identifiable or proprietary business data, whether by third parties or as a result of employee malfeasance or otherwise, non-compliance with our contractual or other legal obligations regarding such data or intellectual property or a violation of our privacy and security policies with respect to such data could result in significant remediation and other costs, fines, litigation or regulatory actions against us. Such an event could additionally disrupt our operations and the services we provide to clients, damage our reputation, result in the loss of a competitive advantage, impact our ability to provide timely and accurate financial data and cause a loss of confidence in our services and financial reporting, which could adversely affect our business, revenues, competitive position and investor confidence. Additionally, we increasingly rely on third-party data storage providers, including cloud storage solution providers, resulting in less direct control over our data. Such third parties are also vulnerable to security breaches and
14
compromised security systems, for which we may not be indemnified and which could materially adversely affect us and our reputation.
Interruption or failure of our information technology, communications systems or data services could impair our ability to provide our services effectively, which could damage our reputation and materially harm our operating results.
Our business requires the continued operation of information technology and communication systems and network infrastructure. Our ability to conduct our global business may be materially adversely affected by disruptions to these systems or our infrastructure. Our information technology and communications systems are vulnerable to damage or disruption from fire, power loss, telecommunications failure, system malfunctions, computer viruses, cyber-attacks, natural disasters such as hurricanes, earthquakes and floods, acts of war or terrorism, employee errors or malfeasance, or other events which are beyond our control. In addition, the operation and maintenance of these systems and networks is in some cases dependent on third-party technologies, systems and service providers for which there is no certainty of uninterrupted availability. Any of these events could cause system interruption, delays and loss, corruption or exposure of critical data or intellectual property and may also disrupt our ability to provide services to or interact with our clients, and we may not be able to successfully implement contingency plans that depend on communication or travel. Furthermore, while we have certain business interruption insurance coverage and various contractual arrangements that can serve to mitigate costs, damages and liabilities, any such event could result in substantial recovery and remediation costs and liability to customers, business partners and other third parties. We have disaster recovery plans and backup systems to reduce the potentially adverse effect of such events, but our disaster recovery planning may not be sufficient and cannot account for all eventualities, and a catastrophic event that results in the destruction or disruption of any of our data centers or our critical business or information technology systems could severely affect our ability to conduct normal business operations, and as a result, our future operating results could be materially adversely affected.
The infrastructure disruptions we describe above may also disrupt our ability to manage real estate for clients or may adversely affect the value of real estate investments we make on behalf of clients. The buildings we manage for clients, which include some of the world’s largest office properties and retail centers, are used by numerous people daily. As a result, fires, earthquakes, floods, other natural disasters, defects and terrorist attacks can result in significant loss of life, and, to the extent we are held to have been negligent in connection with our management of the affected properties, we could incur significant financial liabilities and reputational harm.
Our business relies heavily on the use of commercial real estate data. A portion of this data is purchased or licensed from third-party providers for which there is no certainty of uninterrupted availability. A disruption of our ability to provide data to our professionals and/or our clients or an inadvertent exposure of proprietary data could damage our reputation and competitive position, and our operating results could be adversely affected.
Our goodwill and other intangible assets could become impaired, which may require us to take significant non-cash charges against earnings.
Under current accounting guidelines, we must assess, at least annually and potentially more frequently, whether the value of our goodwill and other intangible assets has been impaired. Any impairment of goodwill or other intangible assets as a result of such analysis would result in a non-cash charge against earnings, and such charge could materially adversely affect our reported results of operations, stockholders’ equity and our stock price. A significant and sustained decline in our future cash flows, a significant adverse change in the economic environment, slower growth rates or if our stock price falls below our net book value per share for a sustained period, could result in the need to perform additional impairment analysis in future periods. If we were to conclude that a future write-down of goodwill or other intangible assets is necessary, then we would record such additional charges, which could materially adversely affect our results of operations.
15
Our businesses, financial condition, results of operations and prospects could be adversely affected by new laws or regulations or by changes in existing laws or regulations or the application thereof. If we fail to comply with laws and regulations applicable to us, or make incorrect determinations in complex tax regimes, we may incur significant financial penalties.
We are subject to numerous federal, state, local and non-U.S. laws and regulations specific to the services we perform in our business. Brokerage of real estate sales and leasing transactions and the provision of property management and valuation services require us and our employees to maintain applicable licenses in each U.S. state and certain non-U.S. jurisdictions in which we perform these services. If we and our employees fail to maintain our licenses or conduct these activities without a license, or violate any of the regulations covering our licenses, we may be required to pay fines (including treble damages in certain states) or return commissions received or have our licenses suspended or revoked. A number of our services, including the services provided by our indirect wholly-owned subsidiaries, CBRE Capital Markets and CBRE Global Investors, are subject to regulation by the SEC, Financial Industry Regulatory Authority, or FINRA, or other self-regulatory organizations and state securities regulators and compliance failures or regulatory action could adversely affect our business. We could be subject to disciplinary or other actions in the future due to claimed noncompliance with these regulations, which could have a material adverse effect on our operations and profitability.
We are also subject to laws of broader applicability, such as tax, securities, environmental and employment laws, including the Fair Labor Standards Act, occupational health and safety regulations and U.S. state wage-and-hour laws. Failure to comply with these requirements could result in the imposition of significant fines by governmental authorities, awards of damages to private litigants and significant amounts paid in legal fees or settlements of these matters.
We operate in many jurisdictions with complex and varied tax regimes, and are subject to different forms of taxation resulting in a variable effective tax rate. In addition, from time to time we engage in transactions across different tax jurisdictions. Due to the different tax laws in the many jurisdictions where we operate, we are often required to make subjective determinations. The tax authorities in the various jurisdictions where we carry on business may not agree with the determinations that are made by us with respect to the application of tax law. Such disagreements could result in disputes and, ultimately, in the payment of additional funds to the government authorities in the jurisdictions where we carry on business, which could have an adverse effect on our results of operations. In addition, changes in tax rules or the outcome of tax assessments and audits could have an adverse effect on our results in any particular quarter.
On December 22, 2017, President Trump signed into law the “Tax Cuts and Jobs Act,” or Tax Act, that significantly reforms the Internal Revenue Code of 1986, as amended. The Tax Act, among other things, reduces U.S. corporate tax rates, imposes significant additional limitations on the deductibility of interest and net operating losses, allows for expensing of certain capital expenditures, puts into effect the migration from a “worldwide” system of taxation to a territorial system and imposes a deemed repatriation tax on certain earnings. Notwithstanding the reduction in the corporate tax rate, the overall impact of the Tax Act is uncertain.
As the size and scope of our business has increased significantly during the past several years, both the difficulty of ensuring compliance with numerous licensing and other regulatory requirements and the possible loss resulting from non-compliance have increased. The global economic crisis has resulted in increased government and legislative activities, including the introduction of new legislation and changes to rules and regulations, which we expect will continue into the future. New or revised legislation or regulations applicable to our business, both within and outside of the United States, as well as changes in administrations or enforcement priorities may have an adverse effect on our business, including increasing the costs of regulatory compliance or preventing us from providing certain types of services in certain jurisdictions or in connection with certain transactions or clients. We are unable to predict how any of these new laws, rules, regulations and proposals will be implemented or in what form, or whether any additional or similar changes to laws or regulations, including the interpretation or implementation thereof, will occur in the future. Any such action could affect us in substantial and unpredictable ways and could have an adverse effect on our businesses, financial condition, results of operations and prospects.
16
We may be subject to environmental liability as a result of our role as a property or facility manager or developer of real estate.
Various laws and regulations impose liability on real property owners or operators for the cost of investigating, cleaning up or removing contamination caused by hazardous or toxic substances at a property. In our role as a property or facility manager or developer, we could be held liable as an operator for such costs. This liability may be imposed without regard to the legality of the original actions and without regard to whether we knew of, or were responsible for, the presence of the hazardous or toxic substances. If we fail to disclose environmental issues, we could also be liable to a buyer or lessee of a property. If we incur any such liability, our business could suffer significantly as it could be difficult for us to develop or sell such properties, or borrow funds using such properties as collateral. In the event of a substantial liability, our insurance coverage might be insufficient to pay the full damages, or the scope of available coverage may not cover certain of these liabilities. Additionally, liabilities incurred to comply with more stringent future environmental requirements could adversely affect any or all of our lines of business.
Cautionary Note on Forward-Looking Statements
This Annual Report on Form 10-K includes forward-looking statements within the meaning of Section 27A of the Securities Act of 1933, as amended, or the Securities Act, and Section 21E of the Securities Exchange Act of 1934, as amended, or the Exchange Act. The words “anticipate,” “believe,” “could,” “should,” “propose,” “continue,” “estimate,” “expect,” “intend,” “may,” “plan,” “predict,” “project,” “will” and similar terms and phrases are used in this Annual Report on Form 10-K to identify forward-looking statements. Except for historical information contained herein, the matters addressed in this Annual Report on Form 10-K are forward-looking statements. These statements relate to analyses and other information based on forecasts of future results and estimates of amounts not yet determinable. These statements also relate to our future prospects, developments and business strategies.
These forward-looking statements are made based on our management’s expectations and beliefs concerning future events affecting us and are subject to uncertainties and factors relating to our operations and business environment, all of which are difficult to predict and many of which are beyond our control. These uncertainties and factors could cause our actual results to differ materially from those matters expressed in or implied by these forward-looking statements.
The following factors are among those, but are not only those, that may cause actual results to differ materially from the forward-looking statements:
|
|
• |
disruptions in general economic and business conditions, particularly in geographies where our business may be concentrated; |
|
|
• |
volatility and disruption of the securities, capital and credit markets, interest rate increases, the cost and availability of capital for investment in real estate, clients’ willingness to make real estate or long-term contractual commitments and other factors affecting the value of real estate assets, inside and outside the United States; |
|
|
• |
increases in unemployment and general slowdowns in commercial activity; |
|
|
• |
trends in pricing and risk assumption for commercial real estate services; |
|
|
• |
the effect of significant movements in average cap rates across different property types; |
|
|
• |
a reduction by companies in their reliance on outsourcing for their commercial real estate needs, which would affect our revenues and operating performance; |
|
|
• |
client actions to restrain project spending and reduce outsourced staffing levels; |
|
|
• |
declines in lending activity of U.S. Government Sponsored Enterprises, regulatory oversight of such activity and our mortgage servicing revenue from the commercial real estate mortgage market; |
|
|
• |
our ability to diversify our revenue model to offset cyclical economic trends in the commercial real estate industry; |
17
|
|
• |
our ability to retain major clients and renew related contracts; |
|
|
• |
our ability to leverage our global services platform to maximize and sustain long-term cash flow; |
|
|
• |
our ability to maintain EBITDA and adjusted EBITDA margins that enable us to continue investing in our platform and client service offerings; |
|
|
• |
our ability to control costs relative to revenue growth; |
|
|
• |
economic volatility and market uncertainty globally related to uncertainty surrounding the implementation and effect of the United Kingdom’s referendum to leave the European Union, including uncertainty in relation to the legal and regulatory framework that would apply to the United Kingdom and its relationship with the remaining members of the European Union; |
|
|
• |
foreign currency fluctuations; |
|
|
• |
our ability to retain and incentivize key personnel; |
|
|
• |
our ability to compete globally, or in specific geographic markets or business segments that are material to us; |
|
|
• |
our ability to identify, acquire and integrate synergistic and accretive businesses; |
|
|
• |
costs and potential future capital requirements relating to businesses we may acquire; |
|
|
• |
integration challenges arising out of companies we may acquire; |
|
|
• |
the ability of our Global Investment Management business to maintain and grow assets under management and achieve desired investment returns for our investors, and any potential related litigation, liabilities or reputational harm possible if we fail to do so; |
|
|
• |
our ability to manage fluctuations in net earnings and cash flow, which could result from poor performance in our investment programs, including our participation as a principal in real estate investments; |
|
|
• |
our leverage under our debt instruments as well as the limited restrictions therein on our ability to incur additional debt, and the potential increased borrowing costs to us from a credit-ratings downgrade; |
|
|
• |
the ability of CBRE Capital Markets to periodically amend, or replace, on satisfactory terms, the agreements for its warehouse lines of credit; |
|
|
• |
variations in historically customary seasonal patterns that cause our business not to perform as expected; |
|
|
• |
litigation and its financial and reputational risks to us; |
|
|
• |
our exposure to liabilities in connection with real estate advisory and property management activities and our ability to procure sufficient insurance coverage on acceptable terms; |
|
|
• |
liabilities under guarantees, or for construction defects, that we incur in our Development Services business; |
|
|
• |
our and our employees’ ability to execute on, and adapt to, information technology strategies and trends; |
|
|
• |
changes in domestic and international law and regulatory environments (including relating to anti-corruption, anti-money laundering, trade sanctions, currency controls and other trade control laws), particularly in Russia, Eastern Europe and the Middle East, due to the level of political instability in those regions; |
|
|
• |
our ability to comply with laws and regulations related to our global operations, including real estate licensure, tax, labor and employment laws and regulations, as well as the anti-corruption laws and trade sanctions of the U.S. and other countries; |
18
|
|
• |
changes in applicable tax or accounting requirements, including the impact of any subsequent additional regulation or guidance associated with the Tax Act enacted into law on December 22, 2017; |
|
|
• |
the effect of implementation of new accounting rules and standards (including new revenue recognition guidance which will be effective in the first quarter of 2018); and |
|
|
• |
the other factors described elsewhere in this Annual Report on Form 10-K, included under the headings “Risk Factors”, “Management’s Discussion and Analysis of Financial Condition and Results of Operations—Critical Accounting Policies,” “Quantitative and Qualitative Disclosures About Market Risk” or as described in the other documents and reports we file with the Securities and Exchange Commission. |
Forward-looking statements speak only as of the date the statements are made. You should not put undue reliance on any forward-looking statements. We assume no obligation to update forward-looking statements to reflect actual results, changes in assumptions or changes in other factors affecting forward-looking information, except to the extent required by applicable securities laws. If we do update one or more forward-looking statements, no inference should be drawn that we will make additional updates with respect to those or other forward-looking statements. Additional information concerning these and other risks and uncertainties is contained in our other periodic filings with the SEC.
None.
We occupied the following offices, excluding affiliates, as of December 31, 2017:
|
|
|
Sales Offices |
|
|
Corporate Offices |
|
|
Total |
|
|||
|
Americas |
|
|
240 |
|
|
|
3 |
|
|
|
243 |
|
|
Europe, Middle East and Africa (EMEA) |
|
|
157 |
|
|
|
1 |
|
|
|
158 |
|
|
Asia Pacific |
|
|
81 |
|
|
|
1 |
|
|
|
82 |
|
|
Total |
|
|
478 |
|
|
|
5 |
|
|
|
483 |
|
Some of our offices house employees from our Global Investment Management and Development Services segments as well as employees from our other business segments. We have provided above office totals by geographic region rather than by business segment in order to avoid double counting our Global Investment Management and Development Services offices.
In general, these leased offices are fully utilized. The most significant terms of the leasing arrangements for our offices are the length of the lease and the rent. Our leases have terms varying in duration. The rent payable under our office leases varies significantly from location to location as a result of differences in prevailing commercial real estate rates in different geographic locations. Our management believes that no single office lease is material to our business, results of operations or financial condition. In addition, we believe there is adequate alternative office space available at acceptable rental rates to meet our needs, although adverse movements in rental rates in some markets may negatively affect our profits in those markets when we enter into new leases.
We do not own any of these offices.
We are a party to a number of pending or threatened lawsuits arising out of, or incident to, our ordinary course of business. We believe that any losses in excess of the amounts accrued therefor as liabilities on our financial statements are unlikely to be significant, but litigation is inherently uncertain and there is the potential for a material
19
adverse effect on our financial statements if one or more matters are resolved in a particular period in an amount materially in excess of what we anticipated.
Not applicable.
20
|
Item 5. |
Market for Registrant’s Common Equity, Related Stockholder Matters and Issuer Purchases of Equity Securities |
Stock Price Information
Our Class A common stock has traded on the New York Stock Exchange under the symbol “CBG” since June 10, 2004. The applicable high and low prices of our Class A common stock for the last two fiscal years, as reported by the New York Stock Exchange, are set forth below for the periods indicated.
|
|
|
Price Range |
|
|||||
|
Fiscal Year 2017 |
|
High |
|
|
Low |
|
||
|
Quarter ending March 31, 2017 |
|
$ |
36.74 |
|
|
$ |
29.69 |
|
|
Quarter ending June 30, 2017 |
|
$ |
37.47 |
|
|
$ |
32.30 |
|
|
Quarter ending September 30, 2017 |
|
$ |
38.99 |
|
|
$ |
34.38 |
|
|
Quarter ending December 31, 2017 |
|
$ |
44.34 |
|
|
$ |
37.86 |
|
|
|
|
|
|
|
|
|
|
|
|
Fiscal Year 2016 |
|
|
|
|
|
|
|
|
|
Quarter ending March 31, 2016 |
|
$ |
34.46 |
|
|
$ |
22.74 |
|
|
Quarter ending June 30, 2016 |
|
$ |
31.31 |
|
|
$ |
24.49 |
|
|
Quarter ending September 30, 2016 |
|
$ |
30.39 |
|
|
$ |
24.11 |
|
|
Quarter ending December 31, 2016 |
|
$ |
33.21 |
|
|
$ |
25.40 |
|
The closing share price for our Class A common stock on December 31, 2017, as reported by the New York Stock Exchange (NYSE), was $43.31. As of February 13, 2018, there were 62 stockholders of record of our Class A common stock.
Dividend Policy
We have not declared or paid any cash dividends on any class of our common stock since our inception on February 20, 2001, and we do not anticipate declaring or paying any cash dividends on our common stock in the foreseeable future. We currently intend to retain any future earnings to finance future growth and possibly reduce debt or repurchase common stock. Any future determination to pay cash dividends will be at the discretion of our board of directors and will depend on our financial condition, acquisition or other opportunities to invest capital, results of operations, capital requirements and other factors that the board of directors deems relevant.
Recent Sales of Unregistered Securities
On January 4, 2017, we issued an aggregate of 495,828 shares of Class A common stock as partial consideration to certain members of senior management in connection with our acquisition of Floored, Inc., a leading producer of SaaS (Software as a Service) solutions, including scalable, interactive 3D graphics technology, for the global commercial real estate industry. Additionally, as permitted by our director compensation policy, certain of our non-employee directors elected to receive shares of our Class A common stock as consideration for their service as directors in lieu of cash payments during 2017. Director fees are allocated in quarterly installments, and non-employee directors participating in the “stock in lieu of cash” program were issued 28 shares on February 15, 2017 in lieu of $1,000 in accrued director fees, 138 shares on May 2, 2017 in lieu of $5,000 in accrued director fees and 3,008 shares on August 1, 2017 in lieu of $113,500 in accrued director fees. The number of shares issued in each case was based on the closing price on the NYSE of our Class A common stock on the date of issuance. In each case, the issuance of these securities qualified for an exemption from registration under the Securities Act of 1933, as amended, or the Securities Act, pursuant to Section 4(a)(2) of the Securities Act because the issuance did not involve a public offering.
21
Issuer Purchases of Equity Securities
Neither we nor any “affiliated purchaser” as defined in Rule 10b-18(a)(3) of the Exchange Act purchased any of our Class A common stock during the twelve months ended December 31, 2017. On October 27, 2017, we announced that our board of directors had authorized the company to repurchase up to an aggregate of $250 million of our Class A common stock over three years. As of December 31, 2017, the authorization remained unused.
Stock Performance Graph
The following graph shows our cumulative total stockholder return for the period beginning December 31, 2012 and ending on December 31, 2017. The graph also shows the cumulative total returns of the Standard & Poor’s 500 Stock Index, or S&P 500 Index, in which we are included, and two industry peer groups.
The comparison below assumes $100 was invested on December 31, 2012 in our Class A common stock and in each of the indices shown and assumes that all dividends were reinvested. Our stock price performance shown in the following graph is not necessarily indicative of future stock price performance. The new industry peer group is comprised of JLL, a global commercial real estate services company publicly traded in the United States, as well as the following companies that have significant commercial real estate or real estate capital markets businesses within the United States or globally, that in each case are publicly traded in the United States or abroad: BGC Partners (BGCP), which is the publicly traded parent of Newmark Grubb Knight Frank; Colliers International Group Inc. (CIGI); HFF, L.P. (HF); ISS A/S (ISS), Marcus & Millichap, Inc. (MMI); Savills plc (SVS.L, traded on the London Stock Exchange) and Walker & Dunlop, Inc. (WD). These companies are or include divisions with business lines reasonably comparable to some or all of ours, and which represent our current primary competitors. Our old peer group did not include ISS, which was added to our peer group in 2017.
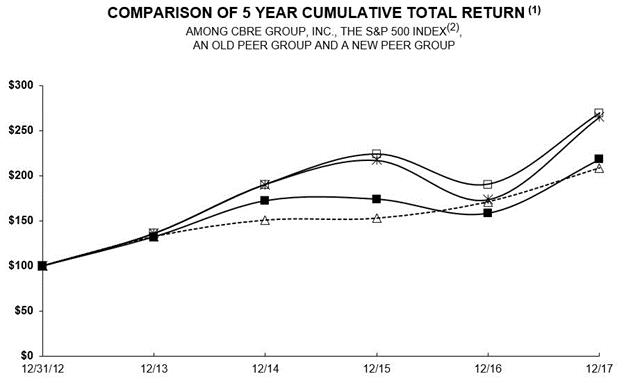
|
|
|
12/31/12 |
12/13 |
12/14 |
12/15 |
12/16 |
12/17 |
|
|
|
|
|
|
|
|
|
|
CBRE Group, Inc. |
100.00 |
132.16 |
172.11 |
173.77 |
158.24 |
217.64 |
|
|
S&P 500 |
100.00 |
132.39 |
150.51 |
152.59 |
170.84 |
208.14 |
|
|
Old Peer Group |
100.00 |
135.92 |
190.33 |
216.77 |
173.26 |
264.82 |
|
|
New Peer Group |
100.00 |
135.92 |
190.33 |
223.81 |
190.44 |
269.16 |
22
Fiscal year ending December 31.
|
(2) |
Copyright© 2018 Standard & Poor’s, a division of S&P Global. All rights reserved. |
This graph shall not be deemed incorporated by reference by any general statement incorporating by reference this Form 10-K into any filing under the Securities Act or under the Exchange Act, except to the extent that we specifically incorporate this information by reference therein, and shall not otherwise be deemed filed under the Securities Act or under the Exchange Act.
The following table sets forth our selected historical consolidated financial information for each of the five years in the period ended December 31, 2017. The statement of operations data, the statement of cash flows data and the other data for the years ended December 31, 2017, 2016 and 2015 and the balance sheet data as of December 31, 2017 and 2016 were derived from our audited consolidated financial statements included elsewhere in this Form 10-K. The statement of operations data, the statement of cash flows data and the other data for the years ended December 31, 2014 and 2013, and the balance sheet data as of December 31, 2015, 2014 and 2013 were derived from our audited consolidated financial statements that are not included in this Form 10-K.
23
The selected financial data presented below is not necessarily indicative of results of future operations and should be read in conjunction with our consolidated financial statements and the information included under the headings “Management's Discussion and Analysis of Financial Condition and Results of Operations” included elsewhere in this Form 10-K.
|
|
|
Year Ended December 31, |
|
|||||||||||||||||
|
|
|
|
2017 |
|
|
|
2016 |
|
|
2015 (1) |
|
|
|
2014 |
|
|
|
2013 |
|
|
|
|
|
(Dollars in thousands, except share data) |
|
|||||||||||||||||
|
STATEMENTS OF OPERATIONS DATA: |
|
|
|
|
|
|
|
|
|
|
|
|
|
|
|
|
|
|
|
|
|
Revenue |
|
$ |
14,209,608 |
|
|
$ |
13,071,589 |
|
|
$ |
10,855,810 |
|
|
$ |
9,049,918 |
|
|
$ |
7,184,794 |
|
|
Operating income |
|
|
1,071,442 |
|
|
|
815,487 |
|
|
|
835,944 |
|
|
|
792,254 |
|
|
|
616,128 |
|
|
Interest income |
|
|
9,853 |
|
|
|
8,051 |
|
|
|
6,311 |
|
|
|
6,233 |
|
|
|
6,289 |
|
|
Interest expense |
|
|
136,814 |
|
|
|
144,851 |
|
|
|
118,880 |
|
|
|
112,035 |
|
|
|
135,082 |
|
|
Write-off of financing costs on extinguished debt |
|
|
— |
|
|
|
— |
|
|
|
2,685 |
|
|
|
23,087 |
|
|
|
56,295 |
|
|
Income from continuing operations |
|
|
697,946 |
|
|
|
584,064 |
|
|
|
558,877 |
|
|
|
513,503 |
|
|
|
321,798 |
|
|
Income from discontinued operations, net of income taxes |
|
|
— |
|
|
|
— |
|
|
|
— |
|
|
|
— |
|
|
|
26,997 |
|
|
Net income |
|
|
697,946 |
|
|
|
584,064 |
|
|
|
558,877 |
|
|
|
513,503 |
|
|
|
348,795 |
|
|
Net income attributable to non-controlling interests |
|
|
6,467 |
|
|
|
12,091 |
|
|
|
11,745 |
|
|
|
29,000 |
|
|
|
32,257 |
|
|
Net income attributable to CBRE Group, Inc. |
|
|
691,479 |
|
|
|
571,973 |
|
|
|
547,132 |
|
|
|
484,503 |
|
|
|
316,538 |
|
|
Income Per Share (2): |
|
|
|
|
|
|
|
|
|
|
|
|
|
|
|
|
|
|
|
|
|
Basic income per share attributable to CBRE Group, Inc. shareholders |
|
|
|
|
|
|
|
|
|
|
|
|
|
|
|
|
|
|
|
|
|
Income from continuing operations attributable to CBRE Group, Inc. |
|
$ |
2.05 |
|
|
$ |
1.71 |
|
|
$ |
1.64 |
|
|
$ |
1.47 |
|
|
$ |
0.95 |
|
|
Income from discontinued operations attributable to CBRE Group, Inc. |
|
|
— |
|
|
|
— |
|
|
|
— |
|
|
|
— |
|
|
|
0.01 |
|
|
Net income attributable to CBRE Group, Inc. |
|
$ |
2.05 |
|
|
$ |
1.71 |
|
|
$ |
1.64 |
|
|
$ |
1.47 |
|
|
$ |
0.96 |
|
|
|
|
|
|
|
|
|
|
|
|
|
|
|
|
|
|
|
|
|
|
|
|
Diluted income per share attributable to CBRE Group, Inc. shareholders |
|
|
|
|
|
|
|
|
|
|
|
|
|
|
|
|
|
|
|
|
|
Income from continuing operations attributable to CBRE Group, Inc. |
|
$ |
2.03 |
|
|
$ |
1.69 |
|
|
$ |
1.63 |
|
|
$ |
1.45 |
|
|
$ |
0.94 |
|
|
Income from discontinued operations attributable to CBRE Group, Inc. |
|
|
— |
|
|
|
— |
|
|
|
— |
|
|
|
— |
|
|
|
0.01 |
|
|
Net income attributable to CBRE Group, Inc. |
|
$ |
2.03 |
|
|
$ |
1.69 |
|
|
$ |
1.63 |
|
|
$ |
1.45 |
|
|
$ |
0.95 |
|
|
|
|
|
|
|
|
|
|
|
|
|
|
|
|
|
|
|
|
|
|
|
|
Weighted average shares: |
|
|
|
|
|
|
|
|
|
|
|
|
|
|
|
|
|
|
|
|
|
Basic |
|
|
337,658,017 |
|
|
|
335,414,831 |
|
|
|
332,616,301 |
|
|
|
330,620,206 |
|
|
|
328,110,004 |
|
|
Diluted |
|
|
340,783,556 |
|
|
|
338,424,563 |
|
|
|
336,414,856 |
|
|
|
334,171,509 |
|
|
|
331,762,854 |
|
24
|
|
|
Year Ended December 31, |
|
|||||||||||||||||
|
|
|
|
2017 |
|
|
|
2016 |
|
|
2015 (1) |
|
|
|
2014 |
|
|
|
2013 |
|
|
|
|
|
(Dollars in thousands) |
|
|||||||||||||||||
|
STATEMENTS OF CASH FLOWS DATA: |
|
|
|
|
|
|
|
|
|
|
|
|
|
|
|
|
|
|
|
|
|
Net cash provided by operating activities |
|
$ |
710,505 |
|
|
$ |
450,315 |
|
|
$ |
651,897 |
|
|
$ |
661,780 |
|
|
$ |
745,108 |
|
|
Net cash used in investing activities |
|
|
(141,415 |
) |
|
|
(7,439 |
) |
|
|
(1,618,959 |
) |
|
|
(151,556 |
) |
|
|
(464,994 |
) |
|
Net cash (used in) provided by financing activities |
|
|
(603,736 |
) |
|
|
(199,643 |
) |
|
|
789,548 |
|
|
|
(232,069 |
) |
|
|
(866,281 |
) |
|
|
|
|
|
|
|
|
|
|
|
|
|
|
|
|
|
|
|
|
|
|
|
OTHER DATA: |
|
|
|
|
|
|
|
|
|
|
|
|
|
|
|
|
|
|
|
|
|
EBITDA (3) |
|
$ |
1,690,701 |
|
|
$ |
1,372,362 |
|
|
$ |
1,297,335 |
|
|
$ |
1,142,252 |
|
|
$ |
982,883 |
|
|
Adjusted EBITDA (3) |
|
$ |
1,709,534 |
|
|
$ |
1,561,003 |
|
|
$ |
1,412,724 |
|
|
$ |
1,166,125 |
|
|
$ |
1,022,255 |
|
|
|
|
|
|
|
|
|
|
|
|
|
|
|
|
|
|
|
|
|
|
|
|
BALANCE SHEET DATA: |
|
|
|
|
|
|
|
|
|
|
|
|
|
|
|
|
|
|
|
|
|
Cash and cash equivalents |
|
$ |
751,774 |
|
|
$ |
762,576 |
|
|
$ |
540,403 |
|
|
$ |
740,884 |
|
|
$ |
491,912 |
|
|
Total assets (4) |
|
|
11,483,830 |
|
|
|
10,779,587 |
|
|
|
11,017,943 |
|
|
|
7,568,010 |
|
|
|
6,998,414 |
|
|
Long-term debt, including current portion, net (4) |
|
|
1,999,611 |
|
|
|
2,548,137 |
|
|
|
2,679,539 |
|
|
|
1,851,012 |
|
|
|
1,840,680 |
|
|
Notes payable on real estate, net (4) |
|
|
17,872 |
|
|
|
25,969 |
|
|
|
38,258 |
|
|
|
41,445 |
|
|
|
130,472 |
|
|
Total liabilities (4) |
|
|
7,404,282 |
|
|
|
7,722,342 |
|
|
|
8,258,873 |
|
|
|
5,266,612 |
|
|
|
5,062,408 |
|
|
Total CBRE Group, Inc. stockholders' equity |
|
|
4,019,430 |
|
|
|
3,014,487 |
|
|
|
2,712,652 |
|
|
|
2,259,830 |
|
|
|
1,895,785 |
|
Note: We have not declared any cash dividends on common stock for the periods shown.
|
(2) |
See Income Per Share information in Note 16 of our Notes to Consolidated Financial Statements set forth in Item 8 of this Annual Report. |
|
(3) |
Includes EBITDA related to discontinued operations of $7.9 million for the year ended December 31, 2013. |
EBITDA and adjusted EBITDA are not recognized measurements under accounting principles generally accepted in the United States, or GAAP. When analyzing our operating performance, investors should use these measures in addition to, and not as an alternative for, their most directly comparable financial measure calculated and presented in accordance with GAAP. We generally use these non-GAAP financial measures to evaluate operating performance and for other discretionary purposes. We believe these measures provide a more complete understanding of ongoing operations, enhance comparability of current results to prior periods and may be useful for investors to analyze our financial performance because they eliminate the impact of selected charges that may obscure trends in the underlying performance of our business. Because not all companies use identical calculations, our presentation of EBITDA and adjusted EBITDA may not be comparable to similarly titled measures of other companies.
EBITDA represents earnings before net interest expense, write-off of financing costs on extinguished debt, income taxes, depreciation and amortization. Amounts shown for adjusted EBITDA further remove (from EBITDA) the impact of certain cash and non-cash charges related to acquisitions, cost-elimination expenses and certain carried interest incentive compensation expense (reversal) to align with the timing of associated revenue. We believe that investors may find these measures useful in evaluating our operating performance compared to that of other companies in our industry because their calculations generally eliminate the effects of acquisitions, which would include impairment charges of goodwill and intangibles created from acquisitions, the effects of financings and income taxes and the accounting effects of capital spending.
25
EBITDA and adjusted EBITDA are not intended to be measures of free cash flow for our discretionary use because they do not consider certain cash requirements such as tax and debt service payments. These measures may also differ from the amounts calculated under similarly titled definitions in our debt instruments, which amounts are further adjusted to reflect certain other cash and non-cash charges and are used by us to determine compliance with financial covenants therein and our ability to engage in certain activities, such as incurring additional debt and making certain restricted payments. We also use adjusted EBITDA as a significant component when measuring our operating performance under our employee incentive compensation programs.
EBITDA and adjusted EBITDA are calculated as follows (dollars in thousands):
|
|
|
Year Ended December 31, |
|
|||||||||||||||||
|
|
|
|
2017 |
|
|
|
2016 |
|
|
|
2015 |
|
|
|
2014 |
|
|
|
2013 |
|
|
Net income attributable to CBRE Group, Inc. |
|
$ |
691,479 |
|
|
$ |
571,973 |
|
|
$ |
547,132 |
|
|
$ |
484,503 |
|
|
$ |
316,538 |
|
|
Add: |
|
|
|
|
|
|
|
|
|
|
|
|
|
|
|
|
|
|
|
|
|
Depreciation and amortization (i) |
|
|
406,114 |
|
|
|
366,927 |
|
|
|
314,096 |
|
|
|
265,101 |
|
|
|
191,270 |
|
|
Non-amortizable intangible asset impairment |
|
|
— |
|
|
|
— |
|
|
|
— |
|
|
|
— |
|
|
|
98,129 |
|
|
Interest expense (ii) |
|
|
136,814 |
|
|
|
144,851 |
|
|
|
118,880 |
|
|
|
112,035 |
|
|
|
138,379 |
|
|
Write-off of financing costs on extinguished debt |
|
|
— |
|
|
|
— |
|
|
|
2,685 |
|
|
|
23,087 |
|
|
|
56,295 |
|
|
Provision for income taxes (iii) |
|
|
466,147 |
|
|
|
296,662 |
|
|
|
320,853 |
|
|
|
263,759 |
|
|
|
188,561 |
|
|
Less: |
|
|
|
|
|
|
|
|
|
|
|
|
|
|
|
|
|
|
|
|
|
Interest income |
|
|
9,853 |
|
|
|
8,051 |
|
|
|
6,311 |
|
|
|
6,233 |
|
|
|
6,289 |
|
|
EBITDA (iv) |
|
|
1,690,701 |
|
|
|
1,372,362 |
|
|
|
1,297,335 |
|
|
|
1,142,252 |
|
|
|
982,883 |
|
|
Adjustments: |
|
|
|
|
|
|
|
|
|
|
|
|
|
|
|
|
|
|
|
|
|
Integration and other costs related to acquisitions |
|
|
27,351 |
|
|
|
125,743 |
|
|
|
48,865 |
|
|
|
— |
|
|
|
12,591 |
|
|
Carried interest incentive compensation (reversal) expense to align with the timing of associated revenue |
|
|
(8,518 |
) |
|
|
(15,558 |
) |
|
|
26,085 |
|
|
|
23,873 |
|
|
|
9,160 |
|
|
Cost-elimination expenses |
|
|
— |
|
|
|
78,456 |
|
|
|
40,439 |
|
|
|
— |
|
|
|
17,621 |
|
|
Adjusted EBITDA (iv) |
|
$ |
1,709,534 |
|
|
$ |
1,561,003 |
|
|
$ |
1,412,724 |
|
|
$ |
1,166,125 |
|
|
$ |
1,022,255 |
|
|
|
(i) |
Includes depreciation and amortization related to discontinued operations of $0.9 million for the year ended December 31, 2013. |
|
|
(ii) |
Includes interest expense related to discontinued operations of $3.3 million for the year ended December 31, 2013. |
|
|
(iii) |
Provision for income taxes for the year ended December 31, 2017 includes a net charge of $143.4 million attributable to the Tax Cuts and Jobs Act signed into law on December 22, 2017. For the year ended December 31, 2013, includes provision for income taxes related to discontinued operations of $1.3 million. |
|
|
(iv) |
Includes EBITDA related to discontinued operations of $7.9 million for the year ended December 31, 2013. |
|
(4) |
In the third quarter of 2015, we elected to early adopt the provisions of Accounting Standards Update (ASU) 2015-03, “Interest – Imputation of Interest (Subtopic 835-30): Simplifying the Presentation of Debt Issuance Costs.” This ASU required that debt issuance costs related to a recognized debt liability be presented in the balance sheet as a direct deduction from the carrying amount of that debt liability instead of separately being recorded in other assets. As of December 31, 2014, deferred financing costs totaling $25.6 million were reclassified from other assets and netted against the related debt liabilities to conform with the 2015 presentation. See Deferred Financing Costs discussion within Note 2 of our Notes to Consolidated Financial Statements set forth in Item 8 of this Annual Report. Amounts for 2013 have not been reclassified to conform with the presentation in 2014, 2015, 2016 and 2017. |
26
Overview
We are the world’s largest commercial real estate services and investment firm, based on 2017 revenue, with leading global market positions in our leasing, property sales, occupier outsourcing and valuation businesses. As of December 31, 2017, we operated in more than 450 offices worldwide with over 80,000 employees, excluding independent affiliates. Our business is focused on providing services to both the occupiers of real estate and investors in real estate. For occupiers, we provide facilities management, project management, transaction (both property sales and tenant leasing) and consulting services, among others. For investors, we provide capital markets (property sales, commercial mortgage brokerage, loan origination and servicing), leasing, investment management, property management, valuation and development services, among others. We provide commercial real estate services under the “CBRE” brand name, investment management services under the “CBRE Global Investors” brand name and development services under the “Trammell Crow Company” brand name. We generate revenue from both management fees (large multi-year portfolio and per-project contracts) and commissions on transactions. In 2017, we generated revenue from a well-balanced, highly diversified base of clients, including more than 90 of the Fortune 100 companies. We have been an S&P 500 company since 2006 and in 2017 we were ranked #214 on the Fortune 500. We have been voted the most recognized commercial real estate brand in a Lipsey Company survey for 17 years in a row (including 2018). We have also been rated a World’s Most Ethical Company by the Ethisphere Institute for five consecutive years.
Critical Accounting Policies
Our consolidated financial statements have been prepared in accordance with accounting principles generally accepted in the United States, or GAAP, which require us to make estimates and assumptions that affect reported amounts. The estimates and assumptions are based on historical experience and on other factors that we believe to be reasonable. Actual results may differ from those estimates. We believe that the following critical accounting policies represent the areas where more significant judgments and estimates are used in the preparation of our consolidated financial statements.
Revenue Recognition
In order for us to recognize revenue, four basic criteria must be met:
|
|
• |
existence of persuasive evidence that an arrangement exists; |
|
|
• |
delivery has occurred or services have been rendered; |
|
|
• |
the seller’s price to the buyer is fixed and determinable; and |
|
|
• |
collectability is reasonably assured. |
Our revenue recognition policies are consistent with these criteria. The judgments involved in revenue recognition include understanding the complex terms of agreements and determining the appropriate time and method to recognize revenue for each transaction based on such terms. Each transaction is evaluated to determine: (i) at what point in time or over what period of time revenue is earned; (ii) whether contingencies exist that impact the timing of recognition of revenue; and (iii) how and when such contingencies will be resolved. The timing of revenue recognition could vary if different judgments were made. Our revenues subject to the most judgment are brokerage commission revenue and incentive-based management and development fees. For a detailed discussion of our revenue recognition policies, see the Revenue Recognition section within Note 2 of the Notes to Consolidated Financial Statements set forth in Item 8 of this Annual Report on Form 10-K, or this Annual Report.
Goodwill and Other Intangible Assets
Our acquisitions require the application of purchase accounting, which results in tangible and identifiable intangible assets and liabilities of the acquired entity being recorded at fair value. The difference between the purchase price and the fair value of net assets acquired is recorded as goodwill. In determining the fair values of assets and liabilities acquired in a business combination, we use a variety of valuation methods including present
27
value, depreciated replacement cost, market values (where available) and selling prices less costs to dispose. We are responsible for determining the valuation of assets and liabilities and for the allocation of purchase price to assets acquired and liabilities assumed.
Assumptions must often be made in determining fair values, particularly where observable market values do not exist. Assumptions may include discount rates, growth rates, cost of capital, royalty rates, tax rates and remaining useful lives. These assumptions can have a significant impact on the value of identifiable assets and accordingly can impact the value of goodwill recorded. Different assumptions could result in different values being attributed to assets and liabilities. Since these values impact the amount of annual depreciation and amortization expense, different assumptions could also impact our statement of operations and could impact the results of future asset impairment reviews.
We are required to test goodwill and other intangible assets deemed to have indefinite useful lives for impairment at least annually or more often if circumstances or events indicate a change in the impairment status. The goodwill impairment analysis is a two-step process. The first step used to identify potential impairment involves comparing each reporting unit’s estimated fair value to its carrying value, including goodwill. We use a discounted cash flow approach to estimate the fair value of our reporting units. Management judgment is required in developing the assumptions for the discounted cash flow model. These assumptions include revenue growth rates, profit margin percentages, discount rates, etc. If the estimated fair value of a reporting unit exceeds its carrying value, goodwill is considered to not be impaired. If the carrying value exceeds estimated fair value, there is an indication of potential impairment and the second step is performed to measure the amount of impairment. The second step of the process involves the calculation of an implied fair value of goodwill for each reporting unit for which step one indicated impairment. The implied fair value of goodwill is determined by measuring the excess of the estimated fair value of the reporting unit as calculated in step one, over the estimated fair values of the individual assets, liabilities and identifiable intangibles as if the reporting unit was being acquired in a business combination. Due to the many variables inherent in the estimation of a business’s fair value and the relative size of our goodwill, if different assumptions and estimates were used, it could have an adverse effect on our impairment analysis.
For additional information on goodwill and intangible asset impairment testing, see Notes 2 and 9 of the Notes to Consolidated Financial Statements set forth in Item 8 of this Annual Report.
Income Taxes
Income taxes are accounted for under the asset and liability method in accordance with the “Accounting for Income Taxes,” Topic of the Financial Accounting Standards Board, or FASB, Accounting Standards Codification, or ASC, (Topic 740). Deferred tax assets and liabilities are determined based on temporary differences between the financial reporting and tax basis of assets and liabilities and operating loss and tax credit carry forwards. Deferred tax assets and liabilities are measured by applying enacted tax rates and laws and are released in the years in which the temporary differences are expected to be recovered or settled. The effect on deferred tax assets and liabilities of a change in tax rates is recognized in income in the period that includes the enactment date. Valuation allowances are provided against deferred tax assets when it is more likely than not that some portion or all of the deferred tax asset will not be realized.
Accounting for tax positions requires judgments, including estimating reserves for potential uncertainties. We also assess our ability to utilize tax attributes, including those in the form of carryforwards, for which the benefits have already been reflected in the financial statements. We do not record valuation allowances for deferred tax assets that we believe will be realized in future periods. While we believe the resulting tax balances as of December 31, 2017 and 2016 are appropriately accounted for in accordance with Topic 740, as applicable, the ultimate outcome of such matters could result in favorable or unfavorable adjustments to our consolidated financial statements and such adjustments could be material.
28
On December 22, 2017, the Tax Cuts and Jobs Act (the Tax Act) was signed into law making significant changes to the Internal Revenue Code, including, but not limited to:
|
|
• |
a U.S. corporate tax rate decrease from 35% to 21%, effective for tax years beginning after December 31, 2017; |
|
|
• |
the transition of U.S. international taxation from a worldwide tax system to a territorial system; and |
|
|
• |
a one-time transition tax on the mandatory deemed repatriation of cumulative foreign earnings as of December 31, 2017. |
In December 2017, the Securities and Exchange Commission (SEC) staff issued Staff Accounting Bulletin No. 118 (SAB 118), “Income Tax Accounting Implications of the Tax Cuts and Jobs Act,” which allows us to record provisional amounts during a measurement period not to extend beyond one year of the enactment date. Our provision for income taxes for 2017 included a net charge of $143.4 million attributable to the Tax Act based upon our best estimate of the impact of the Tax Act in accordance with our understanding of the Tax Act and the related guidance available. The changes included in the Tax Act are broad and complex. The final transition impacts of the Tax Act may differ from the above estimate due to, among other things, changes in interpretations of the Tax Act, any legislative action to address questions that arise because of the Tax Act, any changes in accounting standards for income taxes or related interpretations in response to the Tax Act, or any updates or changes to estimates we have utilized to calculate the transition impacts, including impacts from changes to current-year earnings estimates and foreign exchange rates of foreign subsidiaries. Our accounting for the effects of the Tax Act is expected to be completed within the measurement period provided by SAB 118.
Our foreign subsidiaries have accumulated $2.5 billion of undistributed earnings for which we have not recorded a deferred tax liability. No additional income taxes have been provided for any remaining undistributed foreign earnings not subject to the transition tax, in connection with the enactment of the Tax Act, or any additional outside basis difference inherent in these entities, as these amounts continue to be indefinitely reinvested in foreign operations. Although tax liabilities might result from dividends being paid out of these earnings, or as a result of a sale or liquidation of non-U.S. subsidiaries, these earnings are permanently reinvested outside of the United States and we do not have any plans to repatriate them or to sell or liquidate any of our non-U.S. subsidiaries. To the extent that we are able to repatriate earnings in a tax efficient manner, we would be required to accrue and pay U.S. taxes to repatriate these funds, net of foreign tax credits. Determining our tax liability upon repatriation is not practicable.
See Note 14 of the Notes to Consolidated Financial Statements set forth in Item 8 of this Annual Report for further information regarding income taxes.
New Accounting Pronouncements
See New Accounting Pronouncements section within Note 2 of the Notes to Consolidated Financial Statements set forth in Item 8 of this Annual Report.
Seasonality
A significant portion of our revenue is seasonal, which an investor should keep in mind when comparing our financial condition and results of operations on a quarter-by-quarter basis. Historically, our revenue, operating income, net income and cash flow from operating activities tend to be lowest in the first quarter, and highest in the fourth quarter of each year. Revenue, earnings and cash flow have generally been concentrated in the fourth calendar quarter due to the focus on completing sales, financing and leasing transactions prior to year-end.
Inflation
Our commissions and other variable costs related to revenue are primarily affected by commercial real estate market supply and demand, which may be affected by inflation. However, to date, we do not believe that general inflation has had a material impact upon our operations.
29
When you read our financial statements and the information included in this Annual Report on Form 10-K, you should consider that we have experienced, and continue to experience, several material trends and uncertainties that have affected our financial condition and results of operations that make it challenging to predict our future performance based on our historical results. We believe that the following material trends and uncertainties are crucial to an understanding of the variability in our historical earnings and cash flows and the potential for continued variability in the future.
Economic trends and government policies affect global and regional commercial real estate markets as well as our operations directly. These include: overall economic activity and employment growth; interest rate levels and changes in interest rates; the cost and availability of credit; and the impact of tax and regulatory policies. Periods of economic weakness or recession, significantly rising interest rates, fiscal uncertainty, declining employment levels, decreasing demand for commercial real estate, falling real estate values, disruption to the global capital or credit markets, or the public perception that any of these events may occur, will negatively affect the performance of our business.
Compensation is our largest expense and our sales and leasing professionals generally are paid on a commission and/or bonus basis that correlates with their revenue production. As a result, the negative effect of difficult market conditions on our operating margins is partially mitigated by the inherent variability of our compensation cost structure. In addition, when negative economic conditions have been particularly severe, we have moved decisively to lower operating expenses to improve financial performance, and then have restored certain expenses as economic conditions improved. Nevertheless, adverse global and regional economic trends could pose significant risks to the performance of our operations and our financial condition.
Commercial real estate markets in the United States have generally been marked by increased demand for space, falling vacancies and higher rents since 2010. During this time, healthy U.S. property sales activity has been sustained by gradually improving market fundamentals, including higher occupancy rates and rents, broad, low-cost credit availability and increased acceptance of commercial real estate as an institutional asset class. Following years of strong growth, U.S. property sales volumes slowed in 2016 and 2017, but the market has remained active with significant capital continuing to target commercial real estate. Commercial mortgage markets also have remained highly active, driven by relatively low interest rates, a favorable lending environment and improved market fundamentals. The U.S. Government Sponsored Enterprises continue to be a significant source of debt capital for multi-family properties.
European economies began to emerge from recession in 2013, with economic growth accelerating in 2017. Sales and leasing activity has improved steadily across most of continental Europe for more than three years and this trend gained momentum in 2017. Since the United Kingdom’s June 2016 referendum to leave the European Union (EU), sentiment in that country has improved, leading to higher property leasing and sales volumes. However, there continues to be uncertainty about both the withdrawal process and the United Kingdom’s future relationship with the EU.
In Asia Pacific, real estate leasing and investment markets have strengthened broadly since late 2016. In 2017, investment activity, in particular, was very strong, and Asia Pacific investors continue to be a significant source of real estate investment both in the region and across other parts of the world.
Real estate investment management and property development markets have been generally favorable with abundant debt and equity capital flows into commercial real estate. Actively managed real estate equity strategies have been pressured by a shift in investor preferences from active to passive portfolio strategies and concerns about potentially higher interest rates.
The performance of our global real estate services and real estate investment businesses depends on sustained economic growth and job creation; stable, healthy global credit markets; and continued positive business and investor sentiment.
30
We historically have made significant use of strategic acquisitions to add and enhance service competencies around the world. For example, on September 1, 2015, CBRE, Inc., our wholly-owned subsidiary, pursuant to a Stock and Asset Purchase Agreement with Johnson Controls, Inc. (JCI), acquired JCI’s Global Workplace Solutions (JCI-GWS) business (which we refer to as the GWS Acquisition). The acquired JCI-GWS business was a market-leading provider of integrated facilities management solutions for major occupiers of commercial real estate and had significant operations around the world. The purchase price was $1.475 billion, paid in cash, plus adjustments totaling $46.5 million for working capital and other items. We completed the GWS Acquisition in order to advance our strategy of delivering globally integrated services to major occupiers in our Americas, EMEA and Asia Pacific segments. We merged the acquired JCI-GWS business with our existing occupier outsourcing business line, which adopted the “Global Workplace Solutions” name.
Strategic in-fill acquisitions have also played a key role in strengthening our service offerings. The companies we acquired have generally been regional or specialty firms that complement our existing platform, or independent affiliates in which, in some cases, we held a small equity interest. During 2017, we completed 11 in-fill acquisitions, including two leading Software as a Service (SaaS) platforms – one that produces scalable interactive visualization technologies for commercial real estate and one that provides technology solutions for facilities management operations, a healthcare-focused project manager in Australia, a full-service brokerage and management boutique in South Florida, a technology-enabled national boutique commercial real estate finance and consulting firm in the United States, a retail consultancy in France, a majority interest in a Toronto-based investment management business specializing in private infrastructure and private equity investments, a San Francisco-based technology-focused boutique real estate brokerage firm, a project management and design engineering firm operating across the United States, a Washington, D.C.-based retail brokerage operation and a leading technical engineering services provider in Italy. During 2016, we acquired our independent affiliate in Norway, a London-based retail property advisor specializing in the luxury goods retail sector and a leading provider of retail project management, shopping center development and tenant coordination services in the United States. We also made an equity investment in a property services firm in Malaysia, acquiring a 49% interest.
We believe that strategic acquisitions can significantly decrease the cost, time and commitment of management resources necessary to attain a meaningful competitive position within targeted markets or to expand our presence within our current markets. In general, however, most acquisitions will initially have an adverse impact on our operating and net income as a result of transaction-related expenditures. These include severance, lease termination, transaction and deferred financing costs, among others, and the charges and costs of integrating the acquired business and its financial and accounting systems into our own.
Our acquisition structures often include deferred and/or contingent purchase price payments in future periods that are subject to the passage of time or achievement of certain performance metrics and other conditions. As of December 31, 2017, we have accrued deferred consideration totaling $83.6 million, which is included in accounts payable and accrued expenses and in other long-term liabilities in the accompanying consolidated balance sheets set forth in Item 8 of this Annual Report.
International Operations
We are monitoring the economic and political developments related to the United Kingdom’s referendum to leave the European Union and the potential impact on our businesses in the United Kingdom and the rest of Europe, including, in particular, sales and leasing activity in the United Kingdom, as well as any associated currency volatility impact on our results of operations.
31
As we continue to increase our international operations through either acquisitions or organic growth, fluctuations in the value of the U.S. dollar relative to the other currencies in which we may generate earnings could adversely affect our business, financial condition and operating results. Our Global Investment Management business has a significant amount of euro-denominated assets under management, or AUM, as well as associated revenue and earnings in Europe. In addition, our Global Workplace Solutions business also has a significant amount of its revenue and earnings denominated in foreign currencies, such as the euro and the British pound sterling. Fluctuations in foreign currency exchange rates have resulted and may continue to result in corresponding fluctuations in our AUM, revenue and earnings.
During the year ended December 31, 2017, approximately 48% of our business was transacted in non-U.S. dollar currencies, the majority of which included the Australian dollar, Brazilian real, British pound sterling, Canadian dollar, Chinese yuan, Czech koruna, Danish krone, euro, Hong Kong dollar, Indian rupee, Japanese yen, Korean won, Mexican peso, Polish zloty, Singapore dollar, Swedish krona, Swiss franc and Thai baht. The following table sets forth our revenue derived from our most significant currencies (U.S. dollars in thousands):
|
|
|
Year Ended December 31, |
|
|||||||||||||||||||||
|
|
|
|
2017 |
|
|
|
|
|
|
|
2016 |
|
|
|
|
|
|
|
2015 |
|
|
|
|
|
|
United States dollar |
|
$ |
7,424,249 |
|
|
|
52.2 |
% |
|
$ |
6,917,221 |
|
|
|
52.9 |
% |
|
$ |
5,991,826 |
|
|
|
55.2 |
% |
|
British pound sterling |
|
|
2,104,517 |
|
|
|
14.8 |
% |
|
|
2,008,776 |
|
|
|
15.4 |
% |
|
|
1,861,199 |
|
|
|
17.1 |
% |
|
euro |
|
|
1,677,580 |
|
|
|
11.8 |
% |
|
|
1,541,461 |
|
|
|
11.8 |
% |
|
|
1,071,666 |
|
|
|
9.9 |
% |
|
Australian dollar |
|
|
407,804 |
|
|
|
2.9 |
% |
|
|
367,578 |
|
|
|
2.8 |
% |
|
|
360,284 |
|
|
|
3.3 |
% |
|
Canadian dollar |
|
|
367,194 |
|
|
|
2.6 |
% |
|
|
310,062 |
|
|
|
2.4 |
% |
|
|
291,273 |
|
|
|
2.7 |
% |
|
Indian rupee |
|
|
322,378 |
|
|
|
2.3 |
% |
|
|
244,087 |
|
|
|
1.9 |
% |
|
|
171,678 |
|
|
|
1.6 |
% |
|
Chinese yuan |
|
|
232,455 |
|
|
|
1.6 |
% |
|
|
207,773 |
|
|
|
1.6 |
% |
|
|
152,771 |
|
|
|
1.4 |
% |
|
Singapore dollar |
|
|
229,869 |
|
|
|
1.6 |
% |
|
|
173,967 |
|
|
|
1.3 |
% |
|
|
105,336 |
|
|
|
1.0 |
% |
|
Japanese yen |
|
|
229,486 |
|
|
|
1.6 |
% |
|
|
212,854 |
|
|
|
1.6 |
% |
|
|
155,842 |
|
|
|
1.4 |
% |
|
Swiss franc |
|
|
147,100 |
|
|
|
1.0 |
% |
|
|
145,000 |
|
|
|
1.2 |
% |
|
|
70,415 |
|
|
|
0.7 |
% |
|
Hong Kong dollar |
|
|
121,774 |
|
|
|
0.9 |
% |
|
|
106,869 |
|
|
|
0.8 |
% |
|
|
85,052 |
|
|
|
0.8 |
% |
|
Mexican peso |
|
|
107,961 |
|
|
|
0.8 |
% |
|
|
84,688 |
|
|
|
0.6 |
% |
|
|
68,429 |
|
|
|
0.6 |
% |
|
Brazilian real |
|
|
102,491 |
|
|
|
0.7 |
% |
|
|
83,738 |
|
|
|
0.6 |
% |
|
|
65,844 |
|
|
|
0.6 |
% |
|
Danish krone |
|
|
78,961 |
|
|
|
0.6 |
% |
|
|
68,639 |
|
|
|
0.5 |
% |
|
|
25,673 |
|
|
|
0.2 |
% |
|
Polish zloty |
|
|
67,675 |
|
|
|
0.5 |
% |
|
|
69,949 |
|
|
|
0.5 |
% |
|
|
49,998 |
|
|
|
0.5 |
% |
|
Swedish krona |
|
|
61,289 |
|
|
|
0.4 |
% |
|
|
59,603 |
|
|
|
0.5 |
% |
|
|
32,414 |
|
|
|
0.3 |
% |
|
Thai baht |
|
|
53,685 |
|
|
|
0.4 |
% |
|
|
46,844 |
|
|
|
0.4 |
% |
|
|
35,456 |
|
|
|
0.3 |
% |
|
Korean won |
|
|
46,791 |
|
|
|
0.3 |
% |
|
|
42,669 |
|
|
|
0.3 |
% |
|
|
36,055 |
|
|
|
0.3 |
% |
|
Czech koruna |
|
|
41,244 |
|
|
|
0.3 |
% |
|
|
33,504 |
|
|
|
0.3 |
% |
|
|
27,165 |
|
|
|
0.3 |
% |
|
Other currencies |
|
|
385,105 |
|
|
|
2.7 |
% |
|
|
346,307 |
|
|
|
2.6 |
% |
|
|
197,434 |
|
|
|
1.8 |
% |
|
Total revenue |
|
$ |
14,209,608 |
|
|
|
100.0 |
% |
|
$ |
13,071,589 |
|
|
|
100.0 |
% |
|
$ |
10,855,810 |
|
|
|
100.0 |
% |
Although we operate globally, we report our results in U.S. dollars. As a result, the strengthening or weakening of the U.S. dollar may positively or negatively impact our reported results. For example, we estimate that had the British pound sterling-to-U.S. dollar exchange rates been 10% higher during the year ended December 31, 2017, the net impact would have been an increase in pre-tax income of $10.9 million. Had the euro-to-U.S. dollar exchange rates been 10% higher during the year ended December 31, 2017, the net impact would have been an increase in pre-tax income of $12.0 million. These hypothetical calculations estimate the impact of translating results into U.S. dollars and do not include an estimate of the impact that a 10% change in the U.S. dollar against other currencies would have had on our foreign operations.
32
From time to time, we have entered into derivative financial instruments to attempt to protect the value or fix the amount of certain obligations in terms of our reporting currency, the U.S. dollar. In March 2014, we began a foreign currency exchange forward hedging program by entering into foreign currency exchange forward contracts, including agreements to buy U.S. dollars and sell Australian dollars, British pound sterling, Canadian dollars, euros and Japanese yen. The purpose of these forward contracts was to attempt to mitigate the risk of fluctuations in foreign currency exchange rates that would adversely impact some of our foreign currency denominated EBITDA. Hedge accounting was not elected for any of these contracts. As such, changes in the fair values of these contracts were recorded directly in earnings. As of December 31, 2017 and 2016, we had no foreign currency exchange forward contracts outstanding as we made the decision to let our program expire at the end of 2016. Included in the consolidated statement of operations set forth in Item 8 of this Annual Report were net gains of $7.7 million and $24.2 million from foreign currency exchange forward contracts for the years ended December 31, 2016 and 2015, respectively. We do not intend to hedge our foreign currency denominated EBITDA in 2018.
Due to the constantly changing currency exposures to which we are subject and the volatility of currency exchange rates, we cannot predict the effect of exchange rate fluctuations upon future operating results. In addition, fluctuations in currencies relative to the U.S. dollar may make it more difficult to perform period-to-period comparisons of our reported results of operations. Our international operations also are subject to, among other things, political instability and changing regulatory environments, which affects the currency markets and which as a result may adversely affect our future financial condition and results of operations. We routinely monitor these risks and related costs and evaluate the appropriate amount of oversight to allocate towards business activities in foreign countries where such risks and costs are particularly significant.
33
The following table sets forth items derived from our consolidated statements of operations for the years ended December 31, 2017, 2016 and 2015 (dollars in thousands):
|
|
|
Year Ended December 31, |
|
|||||||||||||||||||||
|
|
|
2017 |
|
|
2016 (1) |
|
|
2015 (1) |
|
|||||||||||||||
|
Revenue: |
|
|
|
|
|
|
|
|
|
|
|
|
|
|
|
|
|
|
|
|
|
|
|
|
|
Fee revenue (1): |
|
|
|
|
|
|
|
|
|
|
|
|
|
|
|
|
|
|
|
|
|
|
|
|
|
Occupier outsourcing |
|
$ |
2,523,264 |
|
|
|
17.8 |
% |
|
$ |
2,273,228 |
|
|
|
17.4 |
% |
|
$ |
1,443,582 |
|
|
|
13.3 |
% |
|
Property management |
|
|
549,953 |
|
|
|
3.9 |
% |
|
|
504,491 |
|
|
|
3.9 |
% |
|
|
491,314 |
|
|
|
4.5 |
% |
|
Valuation |
|
|
527,638 |
|
|
|
3.7 |
% |
|
|
504,370 |
|
|
|
3.9 |
% |
|
|
503,839 |
|
|
|
4.6 |
% |
|
Loan servicing |
|
|
157,449 |
|
|
|
1.1 |
% |
|
|
122,517 |
|
|
|
0.9 |
% |
|
|
100,429 |
|
|
|
0.9 |
% |
|
Investment management |
|
|
377,644 |
|
|
|
2.7 |
% |
|
|
369,800 |
|
|
|
2.8 |
% |
|
|
460,700 |
|
|
|
4.2 |
% |
|
Leasing |
|
|
2,861,265 |
|
|
|
20.1 |
% |
|
|
2,660,984 |
|
|
|
20.4 |
% |
|
|
2,524,154 |
|
|
|
23.3 |
% |
|
Capital Markets: |
|
|
|
|
|
|
|
|
|
|
|
|
|
|
|
|
|
|
|
|
|
|
|
|
|
Sales |
|
|
1,799,162 |
|
|
|
12.7 |
% |
|
|
1,699,387 |
|
|
|
13.0 |
% |
|
|
1,695,560 |
|
|
|
15.6 |
% |
|
Commercial mortgage origination |
|
|
450,511 |
|
|
|
3.2 |
% |
|
|
448,166 |
|
|
|
3.4 |
% |
|
|
379,872 |
|
|
|
3.5 |
% |
|
Other: |
|
|
|
|
|
|
|
|
|
|
|
|
|
|
|
|
|
|
|
|
|
|
|
|
|
Development services |
|
|
58,054 |
|
|
|
0.4 |
% |
|
|
56,651 |
|
|
|
0.4 |
% |
|
|
53,358 |
|
|
|
0.5 |
% |
|
Other |
|
|
84,472 |
|
|
|
0.5 |
% |
|
|
86,235 |
|
|
|
0.7 |
% |
|
|
77,529 |
|
|
|
0.8 |
% |
|
Total fee revenue |
|
|
9,389,412 |
|
|
|
66.1 |
% |
|
|
8,725,829 |
|
|
|
66.8 |
% |
|
|
7,730,337 |
|
|
|
71.2 |
% |
|
Pass through costs also recognized as revenue |
|
|
4,820,196 |
|
|
|
33.9 |
% |
|
|
4,345,760 |
|
|
|
33.2 |
% |
|
|
3,125,473 |
|
|
|
28.8 |
% |
|
Total revenue |
|
|
14,209,608 |
|
|
|
100.0 |
% |
|
|
13,071,589 |
|
|
|
100.0 |
% |
|
|
10,855,810 |
|
|
|
100.0 |
% |
|
|
|
|
|
|
|
|
|
|
|
|
|
|
|
|
|
|
|
|
|
|
|
|
|
|
|
Costs and expenses: |
|
|
|
|
|
|
|
|
|
|
|
|
|
|
|
|
|
|
|
|
|
|
|
|
|
Cost of services |
|
|
9,893,226 |
|
|
|
69.6 |
% |
|
|
9,123,727 |
|
|
|
69.8 |
% |
|
|
7,082,932 |
|
|
|
65.2 |
% |
|
Operating, administrative and other |
|
|
2,858,654 |
|
|
|
20.1 |
% |
|
|
2,781,310 |
|
|
|
21.3 |
% |
|
|
2,633,609 |
|
|
|
24.3 |
% |
|
Depreciation and amortization |
|
|
406,114 |
|
|
|
2.9 |
% |
|
|
366,927 |
|
|
|
2.8 |
% |
|
|
314,096 |
|
|
|
2.9 |
% |
|
Total costs and expenses |
|
|
13,157,994 |
|
|
|
92.6 |
% |
|
|
12,271,964 |
|
|
|
93.9 |
% |
|
|
10,030,637 |
|
|
|
92.4 |
% |
|
Gain on disposition of real estate |
|
|
19,828 |
|
|
|
0.1 |
% |
|
|
15,862 |
|
|
|
0.1 |
% |
|
|
10,771 |
|
|
|
0.1 |
% |
|
Operating income |
|
|
1,071,442 |
|
|
|
7.5 |
% |
|
|
815,487 |
|
|
|
6.2 |
% |
|
|
835,944 |
|
|
|
7.7 |
% |
|
|
|
|
|
|
|
|
|
|
|
|
|
|
|
|
|
|
|
|
|
|
|
|
|
|
|
Equity income from unconsolidated subsidiaries |
|
|
210,207 |
|
|
|
1.5 |
% |
|
|
197,351 |
|
|
|
1.5 |
% |
|
|
162,849 |
|
|
|
1.5 |
% |
|
Other income (loss) |
|
|
9,405 |
|
|
|
0.1 |
% |
|
|
4,688 |
|
|
|
0.0 |
% |
|
|
(3,809 |
) |
|
|
0.0 |
% |
|
Interest income |
|
|
9,853 |
|
|
|
0.1 |
% |
|
|
8,051 |
|
|
|
0.1 |
% |
|
|
6,311 |
|
|
|
0.0 |
% |
|
Interest expense |
|
|
136,814 |
|
|
|
1.0 |
% |
|
|
144,851 |
|
|
|
1.1 |
% |
|
|
118,880 |
|
|
|
1.1 |
% |
|
Write-off of financing costs on extinguished debt |
|
|
— |
|
|
|
0.0 |
% |
|
|
— |
|
|
|
0.0 |
% |
|
|
2,685 |
|
|
|
0.0 |
% |
|
Income before provision for income taxes |
|
|
1,164,093 |
|
|
|
8.2 |
% |
|
|
880,726 |
|
|
|
6.7 |
% |
|
|
879,730 |
|
|
|
8.1 |
% |
|
Provision for income taxes |
|
|
466,147 |
|
|
|
3.3 |
% |
|
|
296,662 |
|
|
|
2.2 |
% |
|
|
320,853 |
|
|
|
3.0 |
% |
|
Net income |
|
|
697,946 |
|
|
|
4.9 |
% |
|
|
584,064 |
|
|
|
4.5 |
% |
|
|
558,877 |
|
|
|
5.1 |
% |
|
Less: Net income attributable to non-controlling interests |
|
|
6,467 |
|
|
|
0.0 |
% |
|
|
12,091 |
|
|
|
0.1 |
% |
|
|
11,745 |
|
|
|
0.1 |
% |
|
Net income attributable to CBRE Group, Inc. |
|
$ |
691,479 |
|
|
|
4.9 |
% |
|
$ |
571,973 |
|
|
|
4.4 |
% |
|
$ |
547,132 |
|
|
|
5.0 |
% |
|
|
|
|
|
|
|
|
|
|
|
|
|
|
|
|
|
|
|
|
|
|
|
|
|
|
|
EBITDA |
|
$ |
1,690,701 |
|
|
|
11.9 |
% |
|
$ |
1,372,362 |
|
|
|
10.5 |
% |
|
$ |
1,297,335 |
|
|
|
12.0 |
% |
|
Adjusted EBITDA |
|
$ |
1,709,534 |
|
|
|
12.0 |
% |
|
$ |
1,561,003 |
|
|
|
11.9 |
% |
|
$ |
1,412,724 |
|
|
|
13.0 |
% |
|
(1) |
Certain adjustments have been made to 2016 and 2015 fee revenue to conform with current-year presentation. |
Fee revenue, EBITDA and adjusted EBITDA are not recognized measurements under GAAP. When analyzing our operating performance, investors should use these measures in addition to, and not as an alternative for, their most directly comparable financial measure calculated and presented in accordance with GAAP. We generally use
34
these non-GAAP financial measures to evaluate operating performance and for other discretionary purposes. We believe these measures provide a more complete understanding of ongoing operations, enhance comparability of current results to prior periods and may be useful for investors to analyze our financial performance because they eliminate the impact of selected charges that may obscure trends in the underlying performance of our business. Because not all companies use identical calculations, our presentation of fee revenue, EBITDA and adjusted EBITDA may not be comparable to similarly titled measures of other companies.
Fee revenue is gross revenue less both client reimbursed costs largely associated with employees that are dedicated to client facilities and subcontracted vendor work performed for clients. We believe that investors may find this measure useful to analyze the company’s overall financial performance because it excludes costs reimbursable by clients, and as such provides greater visibility into the underlying performance of our business.
EBITDA represents earnings before net interest expense, write-off of financing costs on extinguished debt, income taxes, depreciation and amortization. Amounts shown for adjusted EBITDA further remove (from EBITDA) the impact of certain cash and non-cash charges related to acquisitions, cost-elimination expenses and certain carried interest incentive compensation (reversal) expense to align with the timing of associated revenue. We believe that investors may find these measures useful in evaluating our operating performance compared to that of other companies in our industry because their calculations generally eliminate the effects of acquisitions, which would include impairment charges of goodwill and intangibles created from acquisitions, the effects of financings and income taxes and the accounting effects of capital spending.
EBITDA and adjusted EBITDA are not intended to be measures of free cash flow for our discretionary use because they do not consider certain cash requirements such as tax and debt service payments. These measures may also differ from the amounts calculated under similarly titled definitions in our debt instruments, which amounts are further adjusted to reflect certain other cash and non-cash charges and are used by us to determine compliance with financial covenants therein and our ability to engage in certain activities, such as incurring additional debt and making certain restricted payments. We also use adjusted EBITDA as a significant component when measuring our operating performance under our employee incentive compensation programs.
EBITDA and adjusted EBITDA are calculated as follows (dollars in thousands):
|
|
|
Year Ended December 31, |
|
|||||||||
|
|
|
|
2017 |
|
|
|
2016 |
|
|
|
2015 |
|
|
Net income attributable to CBRE Group, Inc. |
|
$ |
691,479 |
|
|
$ |
571,973 |
|
|
$ |
547,132 |
|
|
Add: |
|
|
|
|
|
|
|
|
|
|
|
|
|
Depreciation and amortization |
|
|
406,114 |
|
|
|
366,927 |
|
|
|
314,096 |
|
|
Interest expense |
|
|
136,814 |
|
|
|
144,851 |
|
|
|
118,880 |
|
|
Write-off of financing costs on extinguished debt |
|
|
— |
|
|
|
— |
|
|
|
2,685 |
|
|
Provision for income taxes |
|
|
466,147 |
|
|
|
296,662 |
|
|
|
320,853 |
|
|
Less: |
|
|
|
|
|
|
|
|
|
|
|
|
|
Interest income |
|
|
9,853 |
|
|
|
8,051 |
|
|
|
6,311 |
|
|
EBITDA |
|
|
1,690,701 |
|
|
|
1,372,362 |
|
|
|
1,297,335 |
|
|
Adjustments: |
|
|
|
|
|
|
|
|
|
|
|
|
|
Integration and other costs related to acquisitions |
|
|
27,351 |
|
|
|
125,743 |
|
|
|
48,865 |
|
|
Carried interest incentive compensation (reversal) expense to align with the timing of associated revenue |
|
|
(8,518 |
) |
|
|
(15,558 |
) |
|
|
26,085 |
|
|
Cost-elimination expenses (2) |
|
|
— |
|
|
|
78,456 |
|
|
|
40,439 |
|
|
Adjusted EBITDA |
|
$ |
1,709,534 |
|
|
$ |
1,561,003 |
|
|
$ |
1,412,724 |
|
35
|
respectively, of severance costs related to headcount reductions in connection with the program and $4.9 million and $7.8 million, respectively, of third-party contract termination costs. The total amount for each period does have a cash impact. |
Year Ended December 31, 2017 Compared to Year Ended December 31, 2016
We reported consolidated net income of $691.5 million for the year ended December 31, 2017 on revenue of $14.2 billion as compared to consolidated net income of $572.0 million on revenue of $13.1 billion for the year ended December 31, 2016.
Our revenue on a consolidated basis for the year ended December 31, 2017 increased by $1.1 billion, or 8.7%, as compared to the year ended December 31, 2016. The revenue increase reflects strong organic growth fueled by higher occupier outsourcing revenue (up 12.0%) and property management revenue (up 9.0%), increased sales (up 5.4%) and leasing activity (up 7.1%), and higher loan servicing revenue (up 28.9%). These increases were partially offset by foreign currency translation, which had a $34.5 million negative impact on total revenue during the year ended December 31, 2017, primarily driven by weakness in the British pound sterling and Venezuelan bolivar, partially offset by strength in the euro.
Our cost of services on a consolidated basis increased by $769.5 million, or 8.4%, during the year ended December 31, 2017 as compared to same period in 2016. This increase was primarily due to higher costs associated with our occupier outsourcing business as well as higher professional bonuses (particularly in the United States and United Kingdom). In addition, our sales professionals generally are paid on a commission basis, which substantially correlates with our transaction revenue performance. Accordingly, the increase in sales and lease transaction revenue led to a corresponding increase in commission expense. These increases were partially offset by foreign currency translation, which had a $37.8 million positive impact on cost of services during the year ended December 31, 2017. In addition, we incurred $37.1 million of costs in the prior year in connection with our cost-elimination project that did not recur in the current year. Cost of services as a percentage of revenue was relatively consistent at 69.6% for the year ended December 31, 2017 versus 69.8% for the year ended December 31, 2016.
Our operating, administrative and other expenses on a consolidated basis increased by $77.4 million, or 2.8%, during the year ended December 31, 2017 as compared to same period in 2016. The increase was mostly driven by higher payroll-related costs (including increases in bonus and stock compensation expense driven by improved operating performance). This increase was partially offset by a decrease of $96.7 million in integration and other costs related to the GWS Acquisition incurred during the year ended December 31, 2017 as well as the impact of $41.4 million of costs incurred during the year ended December 31, 2016 as part of our cost-elimination project, which did not recur during the year ended December 31, 2017. Foreign currency also had a $1.7 million positive impact on total operating expenses during the year ended December 31, 2017, including a $0.1 million positive impact from foreign currency translation and $1.6 million of favorable foreign currency transaction activity over the year ended December 31, 2016 (part of which related to net hedging activity during 2016, which did not recur in the current year given that we discontinued our hedging program at the end of 2016). Operating expenses as a percentage of revenue decreased from 21.3% for the year ended December 31, 2016 to 20.1% for the year ended December 31, 2017, primarily driven by the aforementioned decline in integration and other costs related to the GWS Acquisition as well as the costs associated with our cost-elimination project in 2016.
Our depreciation and amortization expense on a consolidated basis increased by $39.2 million, or 10.7%, during the year ended December 31, 2017 as compared to the same period in 2016. This increase was primarily attributable to higher amortization expense associated with mortgage servicing rights. A rise in depreciation expense of $14.5 million during the year ended December 31, 2017 driven by technology-related capital expenditures also contributed to the increase.
Our equity income from unconsolidated subsidiaries on a consolidated basis increased by $12.9 million, or 6.5%, during the year ended December 31, 2017 as compared to the same period in 2016, primarily driven by higher equity earnings associated with gains on property sales reported in our Development Services segment.
36
Our consolidated interest expense decreased by $8.0 million, or 5.5%, for the year ended December 31, 2017 as compared to the year ended December 31, 2016. This decrease was primarily driven by lower interest expense due to lower net borrowings under our credit agreement and a decrease in notes payable on real estate during 2017.
Our provision for income taxes on a consolidated basis was $466.1 million for the year ended December 31, 2017 as compared to $296.7 million for the same period in 2016. Our provision for income taxes for 2017 included a provisional net charge of $143.4 million attributable to the Tax Act. This net charge was primarily comprised of a transition tax on accumulated foreign earnings, net of a tax benefit from the re-measurement of certain deferred tax assets and liabilities using the lower U.S. corporate income tax rate and the release of valuation allowances on foreign tax credits that will decrease the liability related to the transition tax. Excluding this net charge, our effective tax rate for 2017, after adjusting pre-tax income to remove the portion attributable to non-controlling interests, would have been 27.9% compared to 34.1% for the year ended December 31, 2016. We benefited from a more favorable geographic mix of income, the re-measurement of income tax exposures relating to prior periods and release of valuation allowances. The release of valuation allowances during the year ended December 31, 2017 primarily related to valuation allowances on foreign income tax credits that are expected to be utilized as well as on net operating losses that have been utilized through current year operations. The re-measurement of income tax exposures, primarily due to the resolution of certain tax audits during the year ended December 31, 2017, contributed to the lower effective tax rate for 2017 as compared to 2016. In addition, the contribution of income from lower taxed jurisdictions to our total consolidated income for the year ended December 31, 2017, provided a more favorable geographic mix of income, resulting in a decrease to the overall effective tax rate. For the year ended December 31, 2017, the U.S. corporate tax rate was 35%. For 2018, the U.S. corporate tax rate will decrease to 21%.
Year Ended December 31, 2016 Compared to Year Ended December 31, 2015
We reported consolidated net income of $572.0 million for the year ended December 31, 2016 on revenue of $13.1 billion as compared to consolidated net income of $547.1 million on revenue of $10.9 billion for the year ended December 31, 2015.
Our revenue on a consolidated basis for the year ended December 31, 2016 increased by $2.2 billion, or 20.4%, as compared to the year ended December 31, 2015. This increase was largely due to contributions from the GWS Acquisition, which added $1.8 billion of revenue, with a full year of activity reflected in 2016 versus only four months of activity in 2015. Additionally, the revenue increase reflects strong organic growth, fueled by higher occupier outsourcing revenue (excluding the impact of the GWS Acquisition, up 14.0%), as well as increased leasing (up 6.7%), commercial mortgage origination (up 18.0%), loan servicing (up 23.3%) and sales (up 1.4%) activity. These increases were partially offset by lower carried interest revenue in 2016 as well as foreign currency translation, which had a $277.8 million negative impact on total revenue during the year ended December 31, 2016 versus the same period in 2015, primarily driven by weakness in the British pound sterling.
Our cost of services on a consolidated basis increased by $2.0 billion, or 28.8%, during the year ended December 31, 2016 as compared to same period in 2015. This increase was primarily due to higher costs associated with our occupier outsourcing business, particularly due to the GWS Acquisition. In addition, as previously mentioned, our sales professionals generally are paid on a commission basis, which substantially correlates with our transaction revenue performance. Accordingly, the increase in sales and lease transaction revenue led to a corresponding increase in commission expense. We also incurred $18.9 million of additional costs in 2016 versus 2015 in connection with our cost-elimination project that began in the fourth quarter of 2015 and ended in the third quarter of 2016 to enhance margins and reduce our global cost structure going forward (the expenses of which primarily consisted of severance costs related to headcount reductions and third-party contract termination costs). These increases were partially offset by foreign currency translation, which had a $205.5 million positive impact on cost of services during the year ended December 31, 2016. Cost of services as a percentage of revenue increased from 65.2% for the year ended December 31, 2015 to 69.8% for the year ended December 31, 2016, largely due to the GWS Acquisition. Excluding activity associated with the acquired JCI-GWS business, cost of services as a percentage of revenue was 62.5% for the year ended December 31, 2015, compared to 64.0% for the year ended December 31, 2016. This increase was partly driven by the aforementioned increase in costs incurred in connection with our cost-elimination project in 2016 and lower non-commissionable revenue in 2016. In addition, outsourcing revenue (excluding the impact of the GWS Acquisition), which has a lower margin than sales and lease transaction revenue, was a lower percentage of revenue in 2015 than in 2016.
37
Our operating, administrative and other expenses on a consolidated basis increased by $147.7 million, or 5.6%, during the year ended December 31, 2016 as compared to the year ended December 31, 2015. The increase was mostly driven by costs associated with the GWS Acquisition. Also contributing to the variance were higher worldwide payroll-related costs (particularly bonuses largely attributable to improved results, most notably in our Development Services segment). Lastly, we incurred an additional $19.1 million of costs in 2016 versus 2015 in connection with our cost-elimination project. These items were partly offset by lower carried interest expense as well as foreign currency, which had a net $46.2 million positive impact on total operating expenses during the year ended December 31, 2016, including $10.9 million of unfavorable foreign currency transaction activity over the same period last year, much of which related to hedging activities, that was more than offset by a $57.1 million positive impact from foreign currency translation. Operating expenses as a percentage of revenue decreased from 24.3% for the year ended December 31, 2015 to 21.3% for the year ended December 31, 2016, primarily due to the GWS Acquisition. Excluding activity associated with the acquired JCI-GWS business, operating expenses as a percentage of revenue was 25.7% for the year ended December 31, 2015 as compared to 24.7% for the same period in 2016, partly driven by the lower carried interest expense during the year ended December 31, 2016.
Our depreciation and amortization expense on a consolidated basis increased by $52.8 million, or 16.8%, during the year ended December 31, 2016 as compared to the same period in 2015. This increase was primarily attributable to higher amortization expense related to intangibles acquired in the GWS Acquisition, with a full year of amortization reflected during the year ended December 31, 2016 versus only four months of amortization during the year ended December 31, 2015. A rise in depreciation expense of $14.1 million during the year ended December 31, 2016 driven by technology-related capital expenditures also contributed to the increase.
Our equity income from unconsolidated subsidiaries on a consolidated basis increased by $34.5 million, or 21.2%, for the year ended December 31, 2016 as compared to the same period in 2015, primarily driven by higher equity earnings associated with gains on property sales reported in our Development Services segment.
Our consolidated interest expense increased by $26.0 million, or 21.8%, for the year ended December 31, 2016 as compared to the year ended December 31, 2015. This increase was primarily driven by a full year of interest expense during the year ended December 31, 2016 associated with our $600.0 million of 4.875% senior notes issued in August 2015 as well as higher interest expense associated with borrowings under our amended and restated credit agreement dated January 9, 2015 (2015 Credit Agreement) due to an increase in interest rates.
Our write-off of financing costs on extinguished debt on a consolidated basis was $2.7 million for the year ended December 31, 2015. These costs included the write-off of $1.7 million of unamortized deferred financing costs associated with our prior credit agreement dated March 28, 2013, as amended (2013 Credit Agreement), and $1.0 million of fees incurred in connection with our 2015 Credit Agreement.
Our provision for income taxes on a consolidated basis was $296.7 million for the year ended December 31, 2016 as compared to $320.9 million for the same period in 2015. Our effective tax rate, after adjusting pre-tax income to remove the portion attributable to non-controlling interests, decreased to 34.1% for the year ended December 31, 2016 compared to 37.0% for the year ended December 31, 2015. We experienced a favorable change in earnings mix in the current year, with 60% of our earnings, after removing the portion attributable to non-controlling interests, from the United States for 2016 versus 68% for 2015. In addition, we realized certain discrete tax benefits during the year ended December 31, 2016 that were not applicable in 2015. These items were offset, in part, by higher losses sustained during the year ended December 31, 2016 in jurisdictions where no tax benefit could be provided.
Segment Operations
We report our operations through the following segments: (1) Americas, (2) EMEA, (3) Asia Pacific, (4) Global Investment Management, and (5) Development Services. The Americas consists of operations located in the United States, Canada and key markets in Latin America. EMEA mainly consists of operations in Europe, while Asia Pacific includes operations in Asia, Australia and New Zealand. The Global Investment Management business consists of investment management operations in North America, Europe and Asia Pacific. The Development Services business consists of real estate development and investment activities primarily in the United States.
38
The following table summarizes our results of operations by our Americas, EMEA, Asia Pacific, Global Investment Management and Development Services operating segments for the years ended December 31, 2017, 2016 and 2015 (dollars in thousands):
|
|
|
Year Ended December 31, |
|
|||||||||||||||||||||
|
|
|
2017 |
|
|
2016 (1) |
|
|
2015 |
|
|||||||||||||||
|
Americas |
|
|
|
|
|
|
|
|
|
|
|
|
|
|
|
|
|
|
|
|
|
|
|
|
|
Revenue: |
|
|
|
|
|
|
|
|
|
|
|
|
|
|
|
|
|
|
|
|
|
|
|
|
|
Fee revenue: |
|
|
|
|
|
|
|
|
|
|
|
|
|
|
|
|
|
|
|
|
|
|
|
|
|
Occupier outsourcing |
|
$ |
1,113,722 |
|
|
|
14.2 |
% |
|
$ |
948,341 |
|
|
|
13.1 |
% |
|
$ |
587,678 |
|
|
|
9.5 |
% |
|
Property management |
|
|
284,913 |
|
|
|
3.6 |
% |
|
|
272,075 |
|
|
|
3.8 |
% |
|
|
265,577 |
|
|
|
4.3 |
% |
|
Valuation |
|
|
245,179 |
|
|
|
3.1 |
% |
|
|
245,389 |
|
|
|
3.4 |
% |
|
|
239,048 |
|
|
|
3.9 |
% |
|
Loan servicing |
|
|
146,460 |
|
|
|
1.9 |
% |
|
|
111,373 |
|
|
|
1.5 |
% |
|
|
87,296 |
|
|
|
1.4 |
% |
|
Leasing |
|
|
2,052,863 |
|
|
|
26.1 |
% |
|
|
1,934,077 |
|
|
|
26.7 |
% |
|
|
1,814,746 |
|
|
|
29.3 |
% |
|
Capital Markets: |
|
|
|
|
|
|
|
|
|
|
|
|
|
|
|
|
|
|
|
|
|
|
|
|
|
Sales |
|
|
1,104,657 |
|
|
|
14.1 |
% |
|
|
1,102,336 |
|
|
|
15.2 |
% |
|
|
1,094,573 |
|
|
|
17.6 |
% |
|
Commercial mortgage origination |
|
|
442,955 |
|
|
|
5.6 |
% |
|
|
443,149 |
|
|
|
6.1 |
% |
|
|
373,780 |
|
|
|
6.0 |
% |
|
Other |
|
|
48,243 |
|
|
|
0.6 |
% |
|
|
50,231 |
|
|
|
0.7 |
% |
|
|
42,351 |
|
|
|
0.6 |
% |
|
Total fee revenue |
|
|
5,438,992 |
|
|
|
69.2 |
% |
|
|
5,106,971 |
|
|
|
70.5 |
% |
|
|
4,505,049 |
|
|
|
72.6 |
% |
|
Pass through costs also recognized as revenue |
|
|
2,421,247 |
|
|
|
30.8 |
% |
|
|
2,139,488 |
|
|
|
29.5 |
% |
|
|
1,696,627 |
|
|
|
27.4 |
% |
|
Total revenue |
|
|
7,860,239 |
|
|
|
100.0 |
% |
|
|
7,246,459 |
|
|
|
100.0 |
% |
|
|
6,201,676 |
|
|
|
100.0 |
% |
|
Costs and expenses: |
|
|
|
|
|
|
|
|
|
|
|
|
|
|
|
|
|
|
|
|
|
|
|
|
|
Cost of services |
|
|
5,476,929 |
|
|
|
69.7 |
% |
|
|
5,049,774 |
|
|
|
69.7 |
% |
|
|
4,126,865 |
|
|
|
66.5 |
% |
|
Operating, administrative and other |
|
|
1,405,411 |
|
|
|
17.9 |
% |
|
|
1,357,781 |
|
|
|
18.7 |
% |
|
|
1,277,407 |
|
|
|
20.6 |
% |
|
Depreciation and amortization |
|
|
289,338 |
|
|
|
3.6 |
% |
|
|
254,118 |
|
|
|
3.5 |
% |
|
|
198,986 |
|
|
|
3.3 |
% |
|
Operating income |
|
|
688,561 |
|
|
|
8.8 |
% |
|
|
584,786 |
|
|
|
8.1 |
% |
|
|
598,418 |
|
|
|
9.6 |
% |
|
Equity income from unconsolidated subsidiaries |
|
|
18,789 |
|
|
|
0.3 |
% |
|
|
17,892 |
|
|
|
0.2 |
% |
|
|
18,413 |
|
|
|
0.3 |
% |
|
Other income (loss) |
|
|
37 |
|
|
|
0.0 |
% |
|
|
(90 |
) |
|
|
0.0 |
% |
|
|
1,613 |
|
|
|
0.0 |
% |
|
Less: Net income attributable to non-controlling interests |
|
|
— |
|
|
|
0.0 |
% |
|
|
— |
|
|
|
0.0 |
% |
|
|
2 |
|
|
|
0.0 |
% |
|
Add-back: Depreciation and amortization |
|
|
289,338 |
|
|
|
3.6 |
% |
|
|
254,118 |
|
|
|
3.5 |
% |
|
|
198,986 |
|
|
|
3.3 |
% |
|
EBITDA |
|
$ |
996,725 |
|
|
|
12.7 |
% |
|
$ |
856,706 |
|
|
|
11.8 |
% |
|
$ |
817,428 |
|
|
|
13.2 |
% |
|
Adjusted EBITDA |
|
$ |
1,013,864 |
|
|
|
12.9 |
% |
|
$ |
950,355 |
|
|
|
13.1 |
% |
|
$ |
858,174 |
|
|
|
13.8 |
% |
|
(1) |
In 2017, we changed the presentation of the operating results of one of our emerging businesses among our regional services reporting segments. Prior year amounts have been reclassified to conform with the current-year presentation. This change had no impact on our consolidated results. Additionally, certain adjustments have been made to 2016 and 2015 fee revenue to conform with current-year presentation. |
39
|
|
|
Year Ended December 31, |
|
|||||||||||||||||||||
|
|
|
2017 |
|
|
2016 (1) |
|
|
2015 (1) |
|
|||||||||||||||
|
EMEA |
|
|
|
|
|
|
|
|
|
|
|
|
|
|
|
|
|
|
|
|
|
|
|
|
|
Revenue: |
|
|
|
|
|
|
|
|
|
|
|
|
|
|
|
|
|
|
|
|
|
|
|
|
|
Fee revenue: |
|
|
|
|
|
|
|
|
|
|
|
|
|
|
|
|
|
|
|
|
|
|
|
|
|
Occupier outsourcing |
|
$ |
1,162,679 |
|
|
|
27.9 |
% |
|
$ |
1,111,260 |
|
|
|
28.6 |
% |
|
$ |
740,853 |
|
|
|
24.8 |
% |
|
Property management |
|
|
165,022 |
|
|
|
4.0 |
% |
|
|
148,325 |
|
|
|
3.8 |
% |
|
|
147,576 |
|
|
|
4.9 |
% |
|
Valuation |
|
|
165,082 |
|
|
|
4.0 |
% |
|
|
148,856 |
|
|
|
3.8 |
% |
|
|
156,119 |
|
|
|
5.2 |
% |
|
Loan servicing |
|
|
10,989 |
|
|
|
0.3 |
% |
|
|
11,144 |
|
|
|
0.3 |
% |
|
|
13,133 |
|
|
|
0.4 |
% |
|
Leasing |
|
|
445,649 |
|
|
|
10.7 |
% |
|
|
410,756 |
|
|
|
10.6 |
% |
|
|
425,373 |
|
|
|
14.3 |
% |
|
Capital Markets: |
|
|
|
|
|
|
|
|
|
|
|
|
|
|
|
|
|
|
|
|
|
|
|
|
|
Sales |
|
|
397,130 |
|
|
|
9.5 |
% |
|
|
334,398 |
|
|
|
8.6 |
% |
|
|
351,888 |
|
|
|
11.8 |
% |
|
Commercial mortgage origination |
|
|
5,447 |
|
|
|
0.1 |
% |
|
|
2,881 |
|
|
|
0.1 |
% |
|
|
5,087 |
|
|
|
0.2 |
% |
|
Other |
|
|
26,584 |
|
|
|
0.6 |
% |
|
|
23,612 |
|
|
|
0.6 |
% |
|
|
27,324 |
|
|
|
1.0 |
% |
|
Total fee revenue |
|
|
2,378,582 |
|
|
|
57.1 |
% |
|
|
2,191,232 |
|
|
|
56.4 |
% |
|
|
1,867,353 |
|
|
|
62.6 |
% |
|
Pass through costs also recognized as revenue |
|
|
1,786,207 |
|
|
|
42.9 |
% |
|
|
1,693,364 |
|
|
|
43.6 |
% |
|
|
1,116,959 |
|
|
|
37.4 |
% |
|
Total revenue |
|
|
4,164,789 |
|
|
|
100.0 |
% |
|
|
3,884,596 |
|
|
|
100.0 |
% |
|
|
2,984,312 |
|
|
|
100.0 |
% |
|
Costs and expenses: |
|
|
|
|
|
|
|
|
|
|
|
|
|
|
|
|
|
|
|
|
|
|
|
|
|
Cost of services |
|
|
3,180,830 |
|
|
|
76.4 |
% |
|
|
3,001,724 |
|
|
|
77.3 |
% |
|
|
2,188,268 |
|
|
|
73.3 |
% |
|
Operating, administrative and other |
|
|
689,432 |
|
|
|
16.6 |
% |
|
|
686,079 |
|
|
|
17.7 |
% |
|
|
614,550 |
|
|
|
20.6 |
% |
|
Depreciation and amortization |
|
|
72,322 |
|
|
|
1.7 |
% |
|
|
66,619 |
|
|
|
1.6 |
% |
|
|
68,263 |
|
|
|
2.3 |
% |
|
Operating income |
|
$ |
222,205 |
|
|
|
5.3 |
% |
|
$ |
130,174 |
|
|
|
3.4 |
% |
|
$ |
113,231 |
|
|
|
3.8 |
% |
|
Equity income from unconsolidated subsidiaries |
|
|
1,553 |
|
|
|
0.1 |
% |
|
|
1,817 |
|
|
|
0.1 |
% |
|
|
1,934 |
|
|
|
0.1 |
% |
|
Other (loss) income |
|
|
(67 |
) |
|
|
0.0 |
% |
|
|
22 |
|
|
|
0.0 |
% |
|
|
(43 |
) |
|
|
0.0 |
% |
|
Less: Net income (loss) attributable to non-controlling interests |
|
|
64 |
|
|
|
0.0 |
% |
|
|
476 |
|
|
|
0.0 |
% |
|
|
(420 |
) |
|
|
0.0 |
% |
|
Add-back: Depreciation and amortization |
|
|
72,322 |
|
|
|
1.7 |
% |
|
|
66,619 |
|
|
|
1.6 |
% |
|
|
68,263 |
|
|
|
2.3 |
% |
|
EBITDA |
|
$ |
295,949 |
|
|
|
7.1 |
% |
|
$ |
198,156 |
|
|
|
5.1 |
% |
|
$ |
183,805 |
|
|
|
6.2 |
% |
|
Adjusted EBITDA |
|
$ |
305,743 |
|
|
|
7.3 |
% |
|
$ |
271,648 |
|
|
|
7.0 |
% |
|
$ |
212,687 |
|
|
|
7.1 |
% |
|
(1) |
In 2017, we changed the presentation of the operating results of one of our emerging businesses among our regional services reporting segments. Prior year amounts have been reclassified to conform with the current-year presentation. This change had no impact on our consolidated results. Additionally, certain adjustments have been made to 2016 and 2015 fee revenue to conform with current-year presentation. |
40
|
|
|
Year Ended December 31, |
|
|||||||||||||||||||||
|
|
|
2017 |
|
|
2016 (1) |
|
|
2015 (1) |
|
|||||||||||||||
|
Asia Pacific |
|
|
|
|
|
|
|
|
|
|
|
|
|
|
|
|
|
|
|
|
|
|
|
|
|
Revenue: |
|
|
|
|
|
|
|
|
|
|
|
|
|
|
|
|
|
|
|
|
|
|
|
|
|
Fee revenue: |
|
|
|
|
|
|
|
|
|
|
|
|
|
|
|
|
|
|
|
|
|
|
|
|
|
Occupier outsourcing |
|
$ |
246,863 |
|
|
|
14.3 |
% |
|
$ |
213,627 |
|
|
|
14.2 |
% |
|
$ |
115,051 |
|
|
|
10.1 |
% |
|
Property management |
|
|
86,104 |
|
|
|
5.0 |
% |
|
|
74,589 |
|
|
|
5.0 |
% |
|
|
69,839 |
|
|
|
6.1 |
% |
|
Valuation |
|
|
117,377 |
|
|
|
6.8 |
% |
|
|
110,125 |
|
|
|
7.3 |
% |
|
|
108,672 |
|
|
|
9.5 |
% |
|
Leasing |
|
|
358,071 |
|
|
|
20.7 |
% |
|
|
312,223 |
|
|
|
20.8 |
% |
|
|
280,812 |
|
|
|
24.6 |
% |
|
Capital Markets: |
|
|
|
|
|
|
|
|
|
|
|
|
|
|
|
|
|
|
|
|
|
|
|
|
|
Sales |
|
|
296,398 |
|
|
|
17.1 |
% |
|
|
261,320 |
|
|
|
17.4 |
% |
|
|
248,359 |
|
|
|
21.7 |
% |
|
Commercial mortgage origination |
|
|
2,119 |
|
|
|
0.1 |
% |
|
|
2,136 |
|
|
|
0.1 |
% |
|
|
1,005 |
|
|
|
0.1 |
% |
|
Other |
|
|
9,635 |
|
|
|
0.6 |
% |
|
|
12,392 |
|
|
|
1.0 |
% |
|
|
7,854 |
|
|
|
0.6 |
% |
|
Total fee revenue |
|
|
1,116,567 |
|
|
|
64.6 |
% |
|
|
986,412 |
|
|
|
65.8 |
% |
|
|
831,592 |
|
|
|
72.7 |
% |
|
Pass through costs also recognized as revenue |
|
|
612,742 |
|
|
|
35.4 |
% |
|
|
512,908 |
|
|
|
34.2 |
% |
|
|
311,887 |
|
|
|
27.3 |
% |
|
Total revenue |
|
|
1,729,309 |
|
|
|
100.0 |
% |
|
|
1,499,320 |
|
|
|
100.0 |
% |
|
|
1,143,479 |
|
|
|
100.0 |
% |
|
Costs and expenses: |
|
|
|
|
|
|
|
|
|
|
|
|
|
|
|
|
|
|
|
|
|
|
|
|
|
Cost of services |
|
|
1,235,467 |
|
|
|
71.4 |
% |
|
|
1,072,229 |
|
|
|
71.5 |
% |
|
|
767,799 |
|
|
|
67.1 |
% |
|
Operating, administrative and other |
|
|
318,757 |
|
|
|
18.4 |
% |
|
|
301,097 |
|
|
|
20.1 |
% |
|
|
276,098 |
|
|
|
24.1 |
% |
|
Depreciation and amortization |
|
|
18,258 |
|
|
|
1.1 |
% |
|
|
17,810 |
|
|
|
1.2 |
% |
|
|
15,609 |
|
|
|
1.3 |
% |
|
Operating income |
|
$ |
156,827 |
|
|
|
9.1 |
% |
|
$ |
108,184 |
|
|
|
7.2 |
% |
|
$ |
83,973 |
|
|
|
7.5 |
% |
|
Equity income from unconsolidated subsidiaries |
|
|
397 |
|
|
|
0.0 |
% |
|
|
223 |
|
|
|
0.0 |
% |
|
|
83 |
|
|
|
0.0 |
% |
|
Other loss |
|
|
— |
|
|
|
0.0 |
% |
|
|
— |
|
|
|
0.0 |
% |
|
|
(72 |
) |
|
|
0.0 |
% |
|
Less: Net income attributable to non-controlling interests |
|
|
— |
|
|
|
0.0 |
% |
|
|
85 |
|
|
|
0.0 |
% |
|
|
191 |
|
|
|
0.0 |
% |
|
Add-back: Depreciation and amortization |
|
|
18,258 |
|
|
|
1.1 |
% |
|
|
17,810 |
|
|
|
1.2 |
% |
|
|
15,609 |
|
|
|
1.3 |
% |
|
EBITDA |
|
$ |
175,482 |
|
|
|
10.2 |
% |
|
$ |
126,132 |
|
|
|
8.4 |
% |
|
$ |
99,402 |
|
|
|
8.8 |
% |
|
Adjusted EBITDA |
|
$ |
175,900 |
|
|
|
10.2 |
% |
|
$ |
141,912 |
|
|
|
9.5 |
% |
|
$ |
117,557 |
|
|
|
10.3 |
% |
|
(1) |
In 2017, we changed the presentation of the operating results of one of our emerging businesses among our regional services reporting segments. Prior year amounts have been reclassified to conform with the current-year presentation. This change had no impact on our consolidated results. Additionally, certain adjustments have been made to 2016 and 2015 fee revenue to conform with current-year presentation. |
41
|
|
|
Year Ended December 31, |
|
|||||||||||||||||||||
|
|
|
2017 |
|
|
2016 |
|
|
2015 |
|
|||||||||||||||
|
Global Investment Management |
|
|
|
|
|
|
|
|
|
|
|
|
|
|
|
|
|
|
|
|
|
|
|
|
|
Revenue |
|
$ |
377,644 |
|
|
|
100.0 |
% |
|
$ |
369,800 |
|
|
|
100.0 |
% |
|
$ |
460,700 |
|
|
|
100.0 |
% |
|
Costs and expenses: |
|
|
|
|
|
|
|
|
|
|
|
|
|
|
|
|
|
|
|
|
|
|
|
|
|
Operating, administrative and other |
|
|
285,831 |
|
|
|
75.7 |
% |
|
|
297,194 |
|
|
|
80.4 |
% |
|
|
347,974 |
|
|
|
75.5 |
% |
|
Depreciation and amortization |
|
|
24,123 |
|
|
|
6.4 |
% |
|
|
25,911 |
|
|
|
7.0 |
% |
|
|
29,020 |
|
|
|
6.3 |
% |
|
Operating income |
|
$ |
67,690 |
|
|
|
17.9 |
% |
|
$ |
46,695 |
|
|
|
12.6 |
% |
|
$ |
83,706 |
|
|
|
18.2 |
% |
|
Equity income from unconsolidated subsidiaries |
|
|
7,923 |
|
|
|
2.1 |
% |
|
|
7,243 |
|
|
|
1.9 |
% |
|
|
5,972 |
|
|
|
1.3 |
% |
|
Other income (loss) |
|
|
9,435 |
|
|
|
2.5 |
% |
|
|
4,756 |
|
|
|
1.3 |
% |
|
|
(5,307 |
) |
|
|
(1.2 |
%) |
|
Less: Net income attributable to non-controlling interests |
|
|
6,280 |
|
|
|
1.7 |
% |
|
|
7,174 |
|
|
|
1.9 |
% |
|
|
6,757 |
|
|
|
1.5 |
% |
|
Add-back: Depreciation and amortization |
|
|
24,123 |
|
|
|
6.4 |
% |
|
|
25,911 |
|
|
|
7.0 |
% |
|
|
29,020 |
|
|
|
6.3 |
% |
|
EBITDA |
|
$ |
102,891 |
|
|
|
27.2 |
% |
|
$ |
77,431 |
|
|
|
20.9 |
% |
|
$ |
106,634 |
|
|
|
23.1 |
% |
|
Adjusted EBITDA |
|
$ |
94,373 |
|
|
|
25.0 |
% |
|
$ |
83,151 |
|
|
|
22.5 |
% |
|
$ |
134,240 |
|
|
|
29.1 |
% |
|
|
|
Year Ended December 31, |
|
|||||||||||||||||||||
|
|
|
2017 |
|
|
2016 |
|
|
2015 |
|
|||||||||||||||
|
Development Services |
|
|
|
|
|
|
|
|
|
|
|
|
|
|
|
|
|
|
|
|
|
|
|
|
|
Revenue: |
|
|
|
|
|
|
|
|
|
|
|
|
|
|
|
|
|
|
|
|
|
|
|
|
|
Property management |
|
$ |
13,914 |
|
|
|
17.9 |
% |
|
$ |
9,502 |
|
|
|
13.3 |
% |
|
$ |
8,322 |
|
|
|
12.7 |
% |
|
Leasing |
|
|
4,682 |
|
|
|
6.0 |
% |
|
|
3,928 |
|
|
|
5.5 |
% |
|
|
3,223 |
|
|
|
4.9 |
% |
|
Capital Markets: |
|
|
|
|
|
|
|
|
|
|
|
|
|
|
|
|
|
|
|
|
|
|
|
|
|
Sales |
|
|
977 |
|
|
|
1.3 |
% |
|
|
1,333 |
|
|
|
1.9 |
% |
|
|
740 |
|
|
|
1.1 |
% |
|
Other: |
|
|
|
|
|
|
|
|
|
|
|
|
|
|
|
|
|
|
|
|
|
|
|
|
|
Development services |
|
|
58,054 |
|
|
|
74.8 |
% |
|
|
56,651 |
|
|
|
79.3 |
% |
|
|
53,358 |
|
|
|
81.3 |
% |
|
Total revenue |
|
|
77,627 |
|
|
|
100.0 |
% |
|
|
71,414 |
|
|
|
100.0 |
% |
|
|
65,643 |
|
|
|
100.0 |
% |
|
Costs and expenses: |
|
|
|
|
|
|
|
|
|
|
|
|
|
|
|
|
|
|
|
|
|
|
|
|
|
Operating, administrative and other |
|
|
159,223 |
|
|
|
205.1 |
% |
|
|
139,159 |
|
|
|
194.9 |
% |
|
|
117,580 |
|
|
|
179.1 |
% |
|
Depreciation and amortization |
|
|
2,073 |
|
|
|
2.7 |
% |
|
|
2,469 |
|
|
|
3.4 |
% |
|
|
2,218 |
|
|
|
3.4 |
% |
|
Gain on disposition of real estate |
|
|
19,828 |
|
|
|
25.6 |
% |
|
|
15,862 |
|
|
|
22.2 |
% |
|
|
10,771 |
|
|
|
16.4 |
% |
|
Operating loss |
|
$ |
(63,841 |
) |
|
|
(82.2 |
%) |
|
$ |
(54,352 |
) |
|
|
(76.1 |
%) |
|
$ |
(43,384 |
) |
|
|
(66.1 |
%) |
|
Equity income from unconsolidated subsidiaries |
|
|
181,545 |
|
|
|
233.8 |
% |
|
|
170,176 |
|
|
|
238.3 |
% |
|
|
136,447 |
|
|
|
207.8 |
% |
|
Less: Net income attributable to non-controlling interests |
|
|
123 |
|
|
|
0.2 |
% |
|
|
4,356 |
|
|
|
6.1 |
% |
|
|
5,215 |
|
|
|
7.9 |
% |
|
Add-back: Depreciation and amortization |
|
|
2,073 |
|
|
|
2.7 |
% |
|
|
2,469 |
|
|
|
3.4 |
% |
|
|
2,218 |
|
|
|
3.4 |
% |
|
EBITDA and Adjusted EBITDA |
|
$ |
119,654 |
|
|
|
154.1 |
% |
|
$ |
113,937 |
|
|
|
159.5 |
% |
|
$ |
90,066 |
|
|
|
137.2 |
% |
42
Year Ended December 31, 2017 Compared to Year Ended December 31, 2016
Americas
Revenue increased by $613.8 million, or 8.5%, for the year ended December 31, 2017 compared to the year ended December 31, 2016. The revenue increase reflects strong organic growth fueled by higher occupier outsourcing and property management revenue, improved leasing activity and higher loan servicing revenue. Foreign currency translation had an $8.8 million negative impact on revenue during the year ended December 31, 2017, primarily driven by weakness in the Venezuelan bolivar, partially offset by strength in the Brazilian real and the Canadian dollar.
Cost of services increased by $427.2 million, or 8.5%, for the year ended December 31, 2017 as compared to the same period in 2016, primarily due to higher costs associated with our occupier outsourcing business and higher professional bonuses in the United States. Also contributing to the variance was higher commission expense resulting from improved lease transaction revenue. Foreign currency translation had an $8.8 million positive impact on cost of services during the year ended December 31, 2017. These items were partially offset by the impact of $11.9 million of costs incurred during the year ended December 31, 2016 in connection with our cost-elimination project that did not recur during the year ended December 31, 2017. Cost of services as a percentage of revenue was consistent at 69.7% for both years ended December 31, 2017 and 2016.
Operating, administrative and other expenses increased by $47.6 million, or 3.5%, for the year ended December 31, 2017 as compared to the year ended December 31, 2016. The increase was partly driven by higher payroll-related costs (including increases in bonus and stock compensation expense due to improved operating performance). Foreign currency also had a $9.0 million negative impact on total operating expenses during the year ended December 31, 2017, which included a negative impact from foreign currency translation of $2.4 million and $6.6 million of unfavorable foreign currency transaction activity over the year ended December 31, 2016 (part of which related to net hedging activity in 2016, which did not recur in the current year). These increases were partially offset by a decrease of $52.6 million in integration and other costs related to the GWS Acquisition incurred during the year ended December 31, 2017 as well as the impact of $10.4 million of costs incurred during the year ended December 31, 2016 as part of our cost-elimination project, which did not recur during the year ended December 31, 2017.
In connection with the origination and sale of mortgage loans for which the company retains servicing rights, we record servicing assets or liabilities based on the fair value of the retained mortgage servicing rights (MSRs) on the date the loans are sold. Upon origination of a mortgage loan held for sale, the fair value of the mortgage servicing rights to be retained is included in the forecasted proceeds from the anticipated loan sale and results in a net gain (which is reflected in revenue). Subsequent to the initial recording, MSRs are amortized (within amortization expense) and carried at the lower of amortized cost or fair value in other intangible assets in the accompanying consolidated balance sheets. They are amortized in proportion to and over the estimated period that the servicing income is expected to be received. For the year ended December 31, 2017, MSRs contributed to operating income $145.1 million of gains recognized in conjunction with the origination and sale of mortgage loans, offset by $98.6 million of amortization of related intangible assets. For the year ended December 31, 2016, MSRs contributed to operating income $154.0 million of gains recognized in conjunction with the origination and sale of mortgage loans, offset by $73.3 million of amortization of related intangible assets.
EMEA
Revenue increased by $280.2 million, or 7.2%, for the year ended December 31, 2017 as compared to the same period in 2016. We achieved strong organic growth fueled by higher occupier outsourcing and property management revenue, as well as higher sales and leasing activity. Such growth was partially offset by foreign currency translation, which had a $35.0 million negative impact on total revenue during the year ended December 31, 2017, primarily driven by weakness in the British pound sterling, partially offset by strength in the euro.
43
Cost of services increased by $179.1 million, or 6.0%, for the year ended December 31, 2017 as compared to the same period in 2016, primarily due to higher costs associated with our occupier outsourcing business and higher professional bonuses, particularly in the United Kingdom resulting from improved operating performance. These items were partly offset by foreign currency translation, which had a $36.9 million positive impact on cost of services. In addition, we incurred $18.8 million of costs during the year ended December 31, 2016 in connection with our cost-elimination project that did not recur during the year ended December 31, 2017. The absence of such costs contributed to cost of services as a percentage of revenue decreasing from 77.3% for the year ended December 31, 2016 to 76.4% for the year ended December 31, 2017.
Operating, administrative and other expenses increased by $3.4 million, or 0.5%, for the year ended December 31, 2017 as compared to the same period in 2016. This increase was primarily driven by higher payroll-related costs, including increased bonus and stock compensation expense due to improved operating performance during the year ended December 31, 2017. These items were largely offset by a decrease of $38.1 million in integration and other costs related to the GWS Acquisition incurred during the year ended December 31, 2017 as well as the impact of $6.8 million of costs incurred during the year ended December 31, 2016 as part of our cost-elimination project, which did not recur during the year ended December 31, 2017. Foreign currency also had a $1.3 million net positive impact on total operating expenses during the year ended December 31, 2017, including a $3.6 million positive impact from foreign currency translation, partially offset by $2.3 million of unfavorable foreign currency transaction activity over the year ended December 31, 2016 (part of which related to net hedging activity in 2016, which did not recur in the current year).
Asia Pacific
Revenue increased by $230.0 million, or 15.3%, for the year ended December 31, 2017 as compared to the year ended December 31, 2016. The revenue increase reflects strong organic growth, fueled by higher occupier outsourcing and property management revenue as well as improved sales and leasing activity. In addition, foreign currency translation had a $10.9 million positive impact on total revenue during the year ended December 31, 2017, primarily driven by strength in the Australian dollar and Indian rupee, partially offset by weakness in the Chinese yuan and Japanese yen.
Cost of services increased by $163.2 million, or 15.2%, for the year ended December 31, 2017 as compared to the same period in 2016, driven by higher costs associated with our occupier outsourcing business. Also contributing to the variance was higher commission expense resulting from improved sales and lease transaction revenue. In addition, foreign currency translation had a $7.9 million negative impact on cost of services during the year ended December 31, 2017. These items were partially offset by the impact of $6.4 million of costs incurred during the year ended December 31, 2016 in connection with our cost-elimination project that did not recur during the year ended December 31, 2017. Cost of services as a percentage of revenue was relatively consistent at 71.4% for the year ended December 31, 2017 versus 71.5% for the year ended December 31, 2016.
Operating, administrative and other expenses increased by $17.7 million, or 5.9%, for the year ended December 31, 2017 as compared to the same period in 2016. We incurred higher payroll-related costs (including increased stock compensation and bonus expense due to improved operating performance) during the year ended December 31, 2017. This was partially offset by a decrease of $6.0 million in integration and other costs related to the GWS Acquisition incurred during the year ended December 31, 2017 as well as the impact of $2.9 million of costs incurred during the year ended December 31, 2016 as part of our cost-elimination project, which did not recur during the year ended December 31, 2017. Foreign currency activity also had an overall net positive impact of $9.3 million for the year ended December 31, 2017, due to $11.1 million of favorable foreign currency transaction activity over the year ended December 31, 2016 (part of which related to net hedging activity in 2016, which did not recur in the current year), partially offset by a $1.8 million negative impact from foreign currency translation.
Global Investment Management
Revenue increased by $7.8 million, or 2.1%, for the year ended December 31, 2017 as compared to the year ended December 31, 2016, primarily driven by higher carried interest revenue. Foreign currency translation had a $1.6 million negative impact on total revenue during the year ended December 31, 2017, primarily driven by weakness in the British pound sterling, partially offset by strength in the euro.
44
Operating, administrative and other expenses decreased by $11.4 million, or 3.8%, for the year ended December 31, 2017 as compared to the same period in 2016, primarily driven by the impact of $21.3 million of costs incurred during the year ended December 31, 2016 in connection with our cost-elimination project that did not recur during the year ended December 31, 2017. This was partly offset by higher carried interest expense in the current year. Foreign currency had a $0.1 million net positive impact on total operating expenses during the year ended December 31, 2017, which included a $0.7 million positive impact from foreign currency translation, most offset by $0.6 million of unfavorable foreign currency transaction activity over the year ended December 31, 2016 (part of which related to net hedging activity in 2016, which did not recur in the current year).
A roll forward of our AUM by product type for the year ended December 31, 2017 is as follows (dollars in billions):
|
|
|
|
|
|
|
Separate |
|
|
|
|
|
|
|
|
|
|
|
|
|
Funds |
|
|
Accounts |
|
|
Securities |
|
|
Total |
|
||||
|
Balance at January 1, 2017 |
|
$ |
31.6 |
|
|
$ |
37.5 |
|
|
$ |
17.5 |
|
|
$ |
86.6 |
|
|
Inflows |
|
|
5.8 |
|
|
|
17.5 |
|
|
|
1.9 |
|
|
|
25.2 |
|
|
Outflows |
|
|
(5.9 |
) |
|
|
(4.9 |
) |
|
|
(6.0 |
) |
|
|
(16.8 |
) |
|
Market appreciation |
|
|
0.2 |
|
|
|
6.6 |
|
|
|
1.4 |
|
|
|
8.2 |
|
|
Balance at December 31, 2017 |
|
$ |
31.7 |
|
|
$ |
56.7 |
|
|
$ |
14.8 |
|
|
$ |
103.2 |
|
AUM generally refers to the properties and other assets with respect to which we provide (or participate in) oversight, investment management services and other advice, and which generally consist of real estate properties or loans, securities portfolios and investments in operating companies and joint ventures. Our AUM is intended principally to reflect the extent of our presence in the real estate market, not the basis for determining our management fees. Our assets under management consist of:
|
|
• |
the total fair market value of the real estate properties and other assets either wholly-owned or held by joint ventures and other entities in which our sponsored funds or investment vehicles and client accounts have invested or to which they have provided financing. Committed (but unfunded) capital from investors in our sponsored funds is not included in this component of our AUM. The value of development properties is included at estimated completion cost. In the case of real estate operating companies, the total value of real properties controlled by the companies, generally through joint ventures, is included in AUM; and |
|
|
• |
the net asset value of our managed securities portfolios, including investments (which may be comprised of committed but uncalled capital) in private real estate funds under our fund of funds investments. |
Our calculation of AUM may differ from the calculations of other asset managers, and as a result, this measure may not be comparable to similar measures presented by other asset managers.
Development Services
Revenue increased by $6.2 million, or 8.7%, for the year ended December 31, 2017 as compared to the year ended December 31, 2016, primarily driven by higher management and development fees during the year ended December 31, 2017.
Operating, administrative and other expenses increased by $20.1 million, or 14.4%, for the year ended December 31, 2017 as compared to the same period in 2016. This increase was primarily driven by higher payroll-related costs, including increased bonus expense during the year ended December 31, 2017 due to improved operating performance (property sales reflected in equity income from unconsolidated subsidiaries and gain on disposition of real estate were significantly higher during the year ended December 31, 2017).
As of December 31, 2017, development projects in process totaled $6.8 billion, up $0.2 billion from year-end 2016. The new projects pipeline totaled $3.8 billion at December 31, 2017, down $0.4 billion from year-end 2016.
45
Year Ended December 31, 2016 Compared to Year Ended December 31, 2015
Americas
Revenue increased by $1.0 billion, or 16.8%, for the year ended December 31, 2016 compared to the year ended December 31, 2015. This increase was in part due to contributions from the GWS Acquisition, which added $641.6 million of revenue, with a full year of activity reflected during the year ended December 31, 2016 versus only four months of activity in 2015. Additionally, the revenue increase reflects strong organic growth, fueled by higher occupier outsourcing revenue (excluding the impact of the GWS Acquisition, up 10.4%), as well as improved leasing and commercial mortgage origination and loan servicing activity. Foreign currency translation had a $30.6 million negative impact on revenue during the year ended December 31, 2016 versus the same period in 2015, primarily driven by weakness in the Canadian dollar and Mexican peso.
Cost of services increased by $922.9 million, or 22.4%, for the year ended December 31, 2016 as compared to the same period in 2015, primarily due to higher costs associated with our occupier outsourcing business, particularly due to the GWS Acquisition. Also contributing to the variance was higher commission expense resulting from improved lease transaction revenue. We also incurred $10.3 million of additional costs in 2016 versus 2015 in connection with our cost-elimination project. Foreign currency translation had a $21.8 million positive impact on cost of services during the year ended December 31, 2016. Cost of services as a percentage of revenue increased to 69.7% for the year ended December 31, 2016 compared to 66.5% for the same period in 2015, largely due to the GWS Acquisition. Excluding activity associated with the acquired JCI-GWS business, cost of services as a percentage of revenue was 66.2% for the year ended December 31, 2016, compared to 65.2% for the year ended December 31, 2015, partly driven by the aforementioned costs associated with our cost-elimination project.
Operating, administrative and other expenses increased by $80.4 million, or 6.3%, for the year ended December 31, 2016 as compared to the year ended December 31, 2015. The increase was partly driven by costs associated with the GWS Acquisition as well as higher payroll-related costs, including an increase in 401(k) contributions in the United States. Higher software license and maintenance contract costs also contributed to the increase. Foreign currency had a net $4.5 million positive impact on total operating expenses during the year ended December 31, 2016, which included a positive impact from foreign currency translation of $6.2 million, partially offset by unfavorable foreign currency transaction activity, mostly hedging related, of $1.7 million.
For the year ended December 31, 2016, MSRs contributed to operating income $154.0 million of gains recognized in conjunction with the origination and sale of mortgage loans, offset by $73.3 million of amortization of related intangible assets. For the year ended December 31, 2015, MSRs contributed to operating income $110.4 million of gains recognized in conjunction with the origination and sale of mortgage loans, offset by $59.3 million of amortization of related intangible assets.
EMEA
Revenue increased by $900.3 million, or 30.2%, for the year ended December 31, 2016 as compared to the year ended December 31, 2015. This increase was largely due to contributions from the GWS Acquisition, which added $924.9 million of revenue, with a full year of activity reflected during the year ended December 31, 2016 versus only four months of activity in 2015. In addition, the revenue increase also reflects strong organic growth, fueled by higher occupier outsourcing revenue (excluding the impact of the GWS Acquisition, up 15.8%). Leasing activity was up slightly and sales activity was flat during the year ended December 31, 2016 versus the year ended December 31, 2015. Foreign currency translation had a $232.5 million negative impact on total revenue during the year ended December 31, 2016 versus the same period in 2015, primarily driven by weakness in the British pound sterling.
Cost of services increased by $813.5 million, or 37.2%, for the year ended December 31, 2016 as compared to the same period in 2015. This increase was primarily due to higher costs associated with our occupier outsourcing business, particularly due to the GWS Acquisition. We also incurred $9.3 million of additional costs in 2016 versus 2015 in connection with our cost-elimination project. These increases were partially reduced by foreign currency translation, which had a $177.8 million positive impact on cost of services during the year ended December 31, 2016. Cost of services as a percentage of revenue increased to 77.3% for the year ended December 31, 2016 from 73.3% for the year ended December 31, 2015, largely due to the GWS Acquisition. Excluding activity associated with the acquired JCI-GWS business, cost of services as a percentage of revenue was 69.0% for both the year ended December 31, 2016 and 2015.
46
Operating, administrative and other expenses increased by $71.5 million, or 11.6%, for the year ended December 31, 2016 as compared to the year ended December 31, 2015, primarily driven by higher costs associated with the GWS Acquisition. Higher payroll-related costs (including bonuses) during the year ended December 31, 2016 also contributed to the variance. These increases were partially mitigated by foreign currency, which had a $44.2 million positive impact on total operating expenses during the year ended December 31, 2016, including $1.0 million in favorable foreign currency transaction activity over the same period in 2015, much of which related to hedging activities, and a $43.2 million positive impact from foreign currency translation.
Asia Pacific
Revenue increased by $355.8 million, or 31.1%, for the year ended December 31, 2016 as compared to the year ended December 31, 2015. This increase was largely due to contributions from the GWS Acquisition, which added $229.4 million of revenue, with a full year of activity reflected during the year ended December 31, 2016 versus only four months of activity in 2015. The revenue increase also reflects strong organic growth, fueled by higher occupier outsourcing revenue (excluding the impact of the GWS Acquisition, up 33.4%) as well as improved sales and leasing activity. This increase was partially offset by foreign currency translation, which had a $2.9 million negative impact on total revenue during the year ended December 31, 2016 versus the same period in 2015, primarily driven by weakness in the Chinese yuan and Indian rupee, largely mitigated by strength in the Japanese yen.
Cost of services increased by $304.4 million, or 39.7%, for the year ended December 31, 2016 as compared to the same period in 2015, driven by higher costs associated with our occupier outsourcing businesses, including the acquired GWS business. This was partially offset by foreign currency translation, which had a $5.9 million positive impact on cost of services during the year ended December 31, 2016. Cost of services as a percentage of revenue increased to 71.5% for the year ended December 31, 2016 as compared to 67.1% for the same period in 2015, primarily due to the GWS Acquisition. Excluding activity associated with the acquired JCI-GWS business, cost of services as a percentage of revenue was 65.6% for the year ended December 31, 2016, compared to 64.1% for the same period in 2015, primarily driven by our revenue mix, with outsourcing revenue, which has a lower margin than sales and lease revenue, being a higher percentage of revenue than in the prior year.
Operating, administrative and other expenses increased by $25.0 million, or 9.1%, for the year ended December 31, 2016 as compared to the year ended December 31, 2015, mainly driven by costs associated with the GWS Acquisition. Additionally, foreign currency activity had an overall negative impact of $7.5 million for the year ended December 31, 2016, due to unfavorable foreign currency transaction activity, mostly related to hedging.
Global Investment Management
Revenue decreased by $90.9 million, or 19.7%, for the year ended December 31, 2016 as compared to the year ended December 31, 2015. This decrease was primarily driven by lower carried interest revenue as well as lower acquisition, asset management and incentive fees during the year ended December 31, 2016. Foreign currency translation had an $11.8 million negative impact on total revenue during the year ended December 31, 2016 versus the same period in 2015, primarily driven by weakness in the British pound sterling.
Operating, administrative and other expenses decreased by $50.8 million, or 14.6%, for the year ended December 31, 2016 as compared to the same period in 2015, primarily driven by lower carried interest expense incurred during the year ended December 31, 2016. Additionally, foreign currency had a net $5.0 million positive impact on total operating expenses during the year ended December 31, 2016, which included $2.7 million of unfavorable foreign currency transaction activity over the same period in 2015, much of which related to hedging activities, that was more than offset by a $7.7 million positive impact from foreign currency translation. These decreases were partially offset by $19.8 million of additional costs in 2016 versus 2015 in connection with our cost-elimination project.
47
A roll forward of our AUM by product type for the year ended December 31, 2016 is as follows (dollars in billions):
|
|
|
|
|
|
|
Separate |
|
|
|
|
|
|
|
|
|
|
|
|
|
Funds |
|
|
Accounts |
|
|
Securities |
|
|
Total |
|
||||
|
Balance at January 1, 2016 |
|
$ |
28.3 |
|
|
$ |
39.9 |
|
|
$ |
20.8 |
|
|
$ |
89.0 |
|
|
Inflows |
|
|
5.4 |
|
|
|
5.7 |
|
|
|
2.7 |
|
|
|
13.8 |
|
|
Outflows |
|
|
(4.7 |
) |
|
|
(6.1 |
) |
|
|
(6.3 |
) |
|
|
(17.1 |
) |
|
Market appreciation (depreciation) |
|
|
2.6 |
|
|
|
(2.0 |
) |
|
|
0.3 |
|
|
|
0.9 |
|
|
Balance at December 31, 2016 |
|
$ |
31.6 |
|
|
$ |
37.5 |
|
|
$ |
17.5 |
|
|
$ |
86.6 |
|
Development Services
Revenue increased by $5.8 million, or 8.8%, for the year ended December 31, 2016 as compared to the year ended December 31, 2015, primarily driven by higher development fees during the year ended December 31, 2016.
Operating, administrative and other expenses increased by $21.6 million, or 18.3%, for the year ended December 31, 2016 as compared to the same period in 2015. This increase was primarily driven by higher bonuses during the year ended December 31, 2016 as a result of significantly improved operating performance due to property sales (reflected in equity income from unconsolidated subsidiaries and gain on disposition of real estate).
As of December 31, 2016, development projects in process totaled $6.6 billion, down $0.1 billion from year-end 2015. The new projects pipeline totaled $4.2 billion at December 31, 2016, up $0.6 billion from year-end 2015.
Liquidity and Capital Resources
We believe that we can satisfy our working capital and funding requirements with internally generated cash flow and, as necessary, borrowings under our revolving credit facility. Our expected capital requirements for 2018 include up to approximately $180 million of anticipated capital expenditures, net of tenant concessions. As of December 31, 2017, we had aggregate commitments of $38.6 million to fund future co-investments in our Global Investment Management business, $31.9 million of which is expected to be funded in 2018. Additionally, as of December 31, 2017, we are committed to fund $20.8 million of additional capital to unconsolidated subsidiaries within our Development Services business, which we may be required to fund at any time. As of December 31, 2017, we had $2.8 billion of borrowings available under our $2.8 billion revolving credit facility.
We have historically relied on our internally generated cash flow and our revolving credit facility to fund our working capital, capital expenditure and general investment requirements (including strategic in-fill acquisitions) and have not sought other external sources of financing to help fund these requirements. In the absence of extraordinary events or a large strategic acquisition, we anticipate that our cash flow from operations and our revolving credit facility would be sufficient to meet our anticipated cash requirements for the foreseeable future, and at a minimum for the next 12 months. We may seek to take advantage of market opportunities to refinance existing debt instruments, as we have done in the past, with new debt instruments at interest rates, maturities and terms we deem attractive. We may also, from time to time in our sole discretion, purchase, redeem, or retire our existing senior notes, through tender offers, in privately negotiated or open market transactions, or otherwise.
In February 2018, we gave the notice required under the indenture governing our 5.00% senior notes of our intent to redeem such notes in full on March 15, 2018. We intend to fund this redemption with $550.0 million of borrowings from our tranche A term loan facility and borrowings from our revolving credit facility under our credit agreement as well as with cash on hand.
As noted above, we believe that any future significant acquisitions that we may make could require us to obtain additional debt or equity financing. In the past, we have been able to obtain such financing for material transactions on terms that we believed to be reasonable. However, it is possible that we may not be able to obtain acquisition financing on favorable terms, or at all, in the future if we decide to make any further significant acquisitions.
48
Our long-term liquidity needs, other than those related to ordinary course obligations and commitments such as operating leases, are generally comprised of two elements. The first is the repayment of the outstanding and anticipated principal amounts of our long-term indebtedness. We are unable to project with certainty whether our long-term cash flow from operations will be sufficient to repay our long-term debt when it comes due. If our cash flow is insufficient, then we expect that we would need to refinance such indebtedness or otherwise amend its terms to extend the maturity dates. We cannot make any assurances that such refinancing or amendments would be available on attractive terms, if at all.
The second long-term liquidity need is the payment of obligations related to acquisitions. Our acquisition structures often include deferred and/or contingent purchase price payments in future periods that are subject to the passage of time or achievement of certain performance metrics and other conditions. As of December 31, 2017 and 2016, we had accrued $83.6 million ($23.2 million of which was a current liability) and $91.0 million ($29.3 million of which was a current liability), respectively, of deferred purchase consideration, which was included in accounts payable and accrued expenses and in other long-term liabilities in the accompanying consolidated balance sheets set forth in Item 8 of this Annual Report.
In addition, on October 27, 2016, we announced that our board of directors had authorized the company to repurchase up to an aggregate of $250 million of our Class A common stock over three years. The timing of the repurchase and the actual amount repurchased will depend on a variety of factors, including the market price of our common stock, general market and economic conditions and other factors. We intend to fund the repurchases, if any, with cash on hand or borrowings under our revolving credit facility. As of December 31, 2017, the authorization remained unused.
Historical Cash Flows
Operating Activities
Net cash provided by operating activities totaled $710.5 million for the year ended December 31, 2017, an increase of $260.2 million as compared to the year ended December 31, 2016. The increase in net cash provided by operating activities was primarily due to improved operating performance and lower net payments to vendors. These items were partially offset by higher net receivables recorded during the year ended December 31, 2017.
Net cash provided by operating activities totaled $450.3 million for the year ended December 31, 2016, a decrease of $201.6 million as compared to the year ended December 31, 2015. The decrease in net cash provided by operating activities was primarily due to higher net payments to vendors and income taxes paid during the year ended December 31, 2016. These items were partially offset by higher commissions paid during the year ended December 31, 2015.
Investing Activities
Net cash used in investing activities totaled $141.4 million for the year ended December 31, 2017, an increase of $134.0 million as compared to the year ended December 31, 2016. The increase in net cash used in investing activities was primarily driven by a greater amount invested in in-fill acquisitions during the current year.
Net cash used in investing activities totaled $7.4 million for the year ended December 31, 2016, a decrease of $1.6 billion as compared to the year ended December 31, 2015. This variance was primarily driven by a greater amount invested in acquisitions during the year ended December 31, 2015, particularly the GWS Acquisition.
Financing Activities
Net cash used in financing activities totaled $603.7 million for the year ended December 31, 2017, an increase of $404.1 million as compared to the year ended December 31, 2016. The increase was primarily due to higher net repayments of senior term loans during the year ended December 31, 2017.
49
Net cash used in financing activities totaled $199.6 million for the year ended December 31, 2016, as compared to net cash provided by financing activities of $789.5 million for the year ended December 31, 2015. This variance was primarily due to proceeds received from the issuance of $600.0 million of 4.875% senior notes in August 2015 as well as $378.8 million of higher net borrowings of term loans under our 2015 Credit Agreement during the year ended December 31, 2015. These collective borrowings during the year ended December 31, 2015, as well as cash on hand, were used to fund the GWS Acquisition, which closed on September 1, 2015.
Summary of Contractual Obligations and Other Commitments
The following is a summary of our various contractual obligations and other commitments as of December 31, 2017 (dollars in thousands):
|
|
|
Payments Due by Period |
|
|||||||||||||||||
|
Contractual Obligations |
|
Total |
|
|
Less than 1 year |
|
|
1 - 3 years |
|
|
3 - 5 years |
|
|
More than 5 years |
|
|||||
|
Total gross long-term debt (1) (2) |
|
$ |
2,025,008 |
|
|
$ |
8 |
|
|
$ |
— |
|
|
$ |
200,000 |
|
|
$ |
1,825,000 |
|
|
Short-term borrowings (3) |
|
|
910,782 |
|
|
|
910,782 |
|
|
|
— |
|
|
|
— |
|
|
|
— |
|
|
Operating leases (4) |
|
|
1,363,535 |
|
|
|
230,083 |
|
|
|
392,001 |
|
|
|
303,330 |
|
|
|
438,121 |
|
|
Defined benefit pension liability (5) |
|
|
122,055 |
|
|
|
— |
|
|
|
— |
|
|
|
— |
|
|
|
122,055 |
|
|
Total gross notes payable on real estate |
|
|
|
|
|
|
|
|
|
|
|
|
|
|
|
|
|
|
|
|
|
(non-recourse) (6) |
|
|
18,037 |
|
|
|
3,947 |
|
|
|
7,086 |
|
|
|
4,667 |
|
|
|
2,337 |
|
|
Deferred purchase consideration (7) |
|
|
83,611 |
|
|
|
23,169 |
|
|
|
41,045 |
|
|
|
13,219 |
|
|
|
6,178 |
|
|
Total Contractual Obligations |
|
$ |
4,523,028 |
|
|
$ |
1,167,989 |
|
|
$ |
440,132 |
|
|
$ |
521,216 |
|
|
$ |
2,393,691 |
|
|
|
|
|
|
|
|
|
|
|
|
|
|
|
|
|
|
|
|
|
|
|
|
|
|
|
|
|
|
|
|
|
|
|
|
|
|
|
|
|
|
|
|
|
|
|
|
Amount of Other Commitments Expiration |
|
|||||||||||||||||
|
Other Commitments |
|
Total |
|
|
Less than 1 year |
|
|
1 - 3 years |
|
|
3 - 5 years |
|
|
More than 5 years |
|
|||||
|
Letters of credit (4) |
|
$ |
69,412 |
|
|
$ |
69,412 |
|
|
$ |
— |
|
|
$ |
— |
|
|
$ |
— |
|
|
Guarantees (4) (8) |
|
|
56,063 |
|
|
|
56,063 |
|
|
|
— |
|
|
|
— |
|
|
|
— |
|
|
Co-investments (4) (9) |
|
|
59,361 |
|
|
|
52,680 |
|
|
|
5,002 |
|
|
|
250 |
|
|
|
1,429 |
|
|
Tax liabilities (10) |
|
|
135,417 |
|
|
|
17,473 |
|
|
|
20,512 |
|
|
|
39,742 |
|
|
|
57,690 |
|
|
Other (11) |
|
|
93,687 |
|
|
|
93,687 |
|
|
|
— |
|
|
|
— |
|
|
|
— |
|
|
Total Other Commitments |
|
$ |
413,940 |
|
|
$ |
289,315 |
|
|
$ |
25,514 |
|
|
$ |
39,992 |
|
|
$ |
59,119 |
|
|
(1) |
Reflects gross outstanding long-term debt balances as of December 31, 2017, assumed to be paid at maturity, excluding unamortized discount, premium and deferred financing costs. See Note 11 of our Notes to the Consolidated Financial Statements set forth in Item 8 of this Annual Report. Figures do not include scheduled interest payments. Assuming each debt obligation is held until maturity, we estimate that we will make the following interest payments (dollars in thousands): 2018 – $96,584; 2019 to 2020 – $193,168; 2021 to 2022 – $192,329 and thereafter – $149,818. |
|
(2) |
In February 2018, we gave the notice required under the indenture governing our 5.00% senior notes of our intent to redeem such notes in full on March 15, 2018. We intend to fund this redemption with $550.0 million of borrowings from our tranche A term loan facility and borrowings from our revolving credit facility under our credit agreement as well as with cash on hand. Overall, these transactions will reduce the estimated future interest payments detailed in footnote (1). |
|
(3) |
Primarily represents our warehouse lines of credit, which are recourse only to our wholly-owned subsidiary CBRE Capital Markets, Inc. (CBRE Capital Markets) and are secured by our related warehouse receivables. See Notes 4 and 11 of our Notes to the Consolidated Financial Statements set forth in Item 8 of this Annual Report. |
|
(4) |
See Note 12 of our Notes to the Consolidated Financial Statements set forth in Item 8 of this Annual Report. |
50
|
(6) |
Figures do not include scheduled interest payments. The notes have either fixed or variable interest rates, ranging from 3.88% to 6.04% at December 31, 2017. |
|
(7) |
Represents deferred obligations related to previous acquisitions, which are included in accounts payable and accrued expenses and other long-term liabilities in the consolidated balance sheets at December 31, 2017 set forth in Item 8 of this Annual Report. |
|
(8) |
Due to the nature of guarantees, payments could be due at any time upon the occurrence of certain triggering events, including default. Accordingly, all guarantees are reflected as expiring in less than one year. |
|
(9) |
Includes $38.6 million related to our Global Investment Management segment, $31.9 million of which is expected to be funded in 2018, and $20.8 million related to our Development Services segment (callable at any time). |
|
(10) |
As of December 31, 2017, our current and non-current tax liabilities, including interest and penalties, totaled $23.8 million. Of this amount, we can reasonably estimate that $0.8 million will require cash settlement in less than one year. We are unable to reasonably estimate the timing of the effective settlement of tax positions for the remaining $23.0 million. In addition, we recognized an estimated tax liability of $134.6 million related to the transition tax on mandatory deemed repatriation due to the Tax Act, net of $55.4 million of foreign income tax credit carryforwards used to reduce the liability. The estimated state tax liability and a portion of the estimated federal tax liability totaling $16.7 million is payable in less than one year. The remainder of the federal tax liability of $117.9 million is payable over the following seven years with no interest charged. |
|
(11) |
Represents outstanding reserves for claims under certain insurance programs, which are included in other current and other long-term liabilities in the consolidated balance sheets at December 31, 2017 set forth in Item 8 of this Annual Report. Due to the nature of this item, payments could be due at any time upon the occurrence of certain events. Accordingly, the entire balance has been reflected as expiring in less than one year. |
Indebtedness
Our level of indebtedness increases the possibility that we may be unable to pay the principal amount of our indebtedness and other obligations when due. In addition, we may incur additional debt from time to time to finance strategic acquisitions, investments, joint ventures or for other purposes, subject to the restrictions contained in the documents governing our indebtedness. If we incur additional debt, the risks associated with our leverage, including our ability to service our debt, would increase.
Long-Term Debt
We maintain credit facilities with third-party lenders, which we use for a variety of purposes. On March 28, 2013, CBRE Services, Inc. (CBRE Services), our wholly-owned subsidiary, entered into the 2013 Credit Agreement with a syndicate of banks led by Credit Suisse AG, or CS, as administrative and collateral agent, to completely refinance a previous credit agreement. On January 9, 2015, CBRE Services entered into the 2015 Credit Agreement with a syndicate of banks jointly led by Merrill Lynch, Pierce, Fenner & Smith Incorporated, J.P. Morgan Securities LLC and CS. In January 2015, we used the proceeds from the tranche A term loan facility under the 2015 Credit Agreement and from the December 2014 issuance of $125.0 million of 5.25% senior notes due 2025, along with cash on hand, to pay off the prior tranche A and tranche B term loans and the balance on our revolving credit facility under the 2013 Credit Agreement. On September 3, 2015, CBRE Services entered into an incremental assumption agreement with a syndicate of banks jointly led by Wells Fargo Securities, LLC and CS to establish new tranche B-1 and tranche B-2 term loan facilities under the 2015 Credit Agreement in an aggregate principal amount of $400.0 million. On March 21, 2016, CBRE Services executed an amendment to the 2015 Credit Agreement that, among other things, extended the maturity on the revolving credit facility to March 2021 and increased the borrowing capacity under the revolving credit facility by $200.0 million. On October 31, 2017, we entered into a new Credit Agreement (the 2017 Credit Agreement), which refinanced and replaced the 2015 Credit Agreement. We used $200.0 million of borrowings from the tranche A term loan facility and $83.0 million of revolving credit facility borrowings under the 2017 Credit Agreement, in addition to cash on hand, to repay all amounts outstanding under the 2015 Credit Agreement.
51
The 2017 Credit Agreement is a senior unsecured credit facility that is jointly and severally guaranteed by us and certain of our subsidiaries. The 2017 Credit Agreement currently provides for the following: (1) a $2.8 billion revolving credit facility, which includes the capacity to obtain letters of credit and swingline loans and matures on October 31, 2022 and (2) a $750.0 million delayed draw tranche A term loan facility, requiring quarterly principal payments, which begin on March 5, 2018 and continue through maturity on October 31, 2022, provided that in the event that our leverage ratio (as defined in the 2017 Credit Agreement) is less than or equal to 2.50 to 1.00 on the last day of the fiscal quarter immediately preceding any such payment date, no such quarterly principal payment shall be required on such date.
On August 13, 2015, CBRE Services issued $600.0 million in aggregate principal amount of 4.875% senior notes due March 1, 2026 at a price equal to 99.24% of their face value. The 4.875% senior notes are unsecured obligations of CBRE Services, senior to all of its current and future subordinated indebtedness, but effectively subordinated to all of its current and future secured indebtedness. The 4.875% senior notes are jointly and severally guaranteed on a senior basis by us and each domestic subsidiary of CBRE Services that guarantees our 2017 Credit Agreement. Interest accrues at a rate of 4.875% per year and is payable semi-annually in arrears on March 1 and September 1.
On September 26, 2014, CBRE Services issued $300.0 million in aggregate principal amount of 5.25% senior notes due March 15, 2025. On December 12, 2014, CBRE Services issued an additional $125.0 million in aggregate principal amount of 5.25% senior notes due March 15, 2025 at a price equal to 101.5% of their face value, plus interest deemed to have accrued from September 26, 2014. The 5.25% senior notes are unsecured obligations of CBRE Services, senior to all of its current and future subordinated indebtedness, but effectively subordinated to all of its current and future secured indebtedness. The 5.25% senior notes are jointly and severally guaranteed on a senior basis by us and each domestic subsidiary of CBRE Services that guarantees our 2017 Credit Agreement. Interest accrues at a rate of 5.25% per year and is payable semi-annually in arrears on March 15 and September 15.
On March 14, 2013, CBRE Services issued $800.0 million in aggregate principal amount of 5.00% senior notes due March 15, 2023. The 5.00% senior notes are unsecured obligations of CBRE Services, senior to all of its current and future subordinated indebtedness, but effectively subordinated to all of its current and future secured indebtedness. The 5.00% senior notes are jointly and severally guaranteed on a senior basis by us and each domestic subsidiary of CBRE Services that guarantees our 2017 Credit Agreement. Interest accrues at a rate of 5.00% per year and is payable semi-annually in arrears on March 15 and September 15. In February 2018, we gave the notice required under the indenture governing our 5.00% senior notes of our intent to redeem such notes in full on March 15, 2018. In connection with this early redemption, we will incur charges of $28.0 million, including a premium of $20.0 million and the write-off of $8.0 million of unamortized deferred financing costs. We intend to fund this redemption with $550.0 million of borrowings from our tranche A term loan facility and borrowings from our revolving credit facility under the 2017 Credit Agreement as well as with cash on hand.
The indentures governing our 5.00% senior notes, 4.875% senior notes and 5.25% senior notes contain restrictive covenants that, among other things, limit our ability to create or permit liens on assets securing indebtedness, enter into sale/leaseback transactions and enter into consolidations or mergers.
For additional information on all of our long-term debt, see Note 11 of the Notes to Consolidated Financial Statements set forth in Item 8 of this Annual Report.
Short-Term Borrowings
Our wholly-owned subsidiary, CBRE Capital Markets, has the following warehouse lines of credit: i) credit agreements with JP Morgan Chase Bank, N.A., Bank of America, TD Bank, N.A. and Capital One, N.A. for the purpose of funding mortgage loans that will be resold; and ii) a funding arrangement with Federal National Mortgage Association, or Fannie Mae, for the purpose of selling a percentage of certain closed multifamily loans to Fannie Mae. For more information on these warehouse lines, see Notes 4 and 11 of the Notes to Consolidated Financial Statements set forth in Item 8 of this Annual Report.
52
In March 2011, we entered into five interest rate swap agreements with a total notional amount of $400.0 million, all with effective dates in October 2011, and immediately designated them as cash flow hedges in accordance with the “Derivatives and Hedging” Topic of the FASB ASC (Topic 815). The purpose of these interest rate swap agreements is to attempt to hedge potential changes to our cash flows due to the variable interest nature of our senior term loan facilities. A notional amount of $200.0 million of these interest rate swap agreements expired on October 2, 2017. The remaining total notional amount of these interest rate swap agreements at December 31, 2017 was $200.0 million, which expire in September 2019. As of December 31, 2017 and 2016, the fair values of such interest rate swap agreements were reflected as a $4.8 million liability and a $13.2 million liability, respectively, and were included in other long-term liabilities in the accompanying consolidated balance sheets set forth in Item 8 of this Annual Report.
In July 2015, we entered into three interest rate swap agreements with an aggregate notional amount of $300.0 million, all with effective dates in August 2015, and designated them as cash flow hedges in accordance with FASB ASC Topic 815. In August 2015, we elected to terminate these agreements and paid a $6.2 million cash settlement, which has been recorded to accumulated other comprehensive loss in the accompanying consolidated balance sheets set forth in Item 8 of this Annual Report. This settlement fee is being amortized to interest expense throughout the remaining term of the terminated hedge transaction until August 2025.
Our exposure to market risk primarily consists of foreign currency exchange rate fluctuations related to our international operations and changes in interest rates on debt obligations. We manage such risk primarily by managing the amount, sources, and duration of our debt funding and by using derivative financial instruments. We apply the “Derivatives and Hedging” Topic of the Financial Accounting Standards Board (FASB) Accounting Standards Codification (ASC) (Topic 815) when accounting for derivative financial instruments. In all cases, we view derivative financial instruments as a risk management tool and, accordingly, do not use derivatives for trading or speculative purposes.
Exchange Rates
Our foreign operations expose us to fluctuations in foreign exchange rates. These fluctuations may impact the value of our cash receipts and payments in terms of our functional (reporting) currency, which is U.S. dollars. See the discussion of international operations, which is included in Item 7. “Management's Discussion and Analysis of Financial Condition and Results of Operations” under the caption “International Operations” and is incorporated by reference herein.
Interest Rates
We manage our interest expense by using a combination of fixed and variable rate debt. We enter into interest rate swap agreements to attempt to hedge the variability of future interest payments due to changes in interest rates. See discussion of our interest rate swap agreements, which is included in Item 7. “Management’s Discussion and Analysis of Financial Condition and Results of Operations” under the caption “Indebtedness-Interest Rate Swap Agreements” and is incorporated by reference herein.
The estimated fair value of our senior term loans was approximately $199.9 million at December 31, 2017. Based on dealers’ quotes, the estimated fair values of our 5.00% senior notes, 4.875% senior notes and 5.25% senior notes were $823.8 million, $645.7 million and $468.0 million, respectively, at December 31, 2017.
As of December 31, 2017, our outstanding gross variable rate debt was $200.0 million and we had interest rate swap agreements in place for a like amount in order to hedge the variability of future interest payments due. As such, we have not utilized sensitivity analyses to assess the potential effect of a rise in interest rates on our variable rate debt as the impact would be minimal.
53
INDEX TO CONSOLIDATED FINANCIAL STATEMENTS
AND FINANCIAL STATEMENT SCHEDULES
All other schedules are omitted because they are either not applicable, not required or the information required is included in the Consolidated Financial Statements, including the notes thereto.
54
Report of Independent Registered Public Accounting Firm
To the Stockholders and Board of Directors
CBRE Group, Inc.:
Opinions on the Consolidated Financial Statements and Internal Control Over Financial Reporting
We have audited the accompanying consolidated balance sheets of CBRE Group, Inc. and subsidiaries (the “Company”) as of December 31, 2017 and 2016, the related consolidated statements of operations, comprehensive income, cash flows, and equity for each of the years in the three-year period ended December 31, 2017, and the related notes and financial statement schedule II (collectively, the “consolidated financial statements”). We also have audited the Company’s internal control over financial reporting as of December 31, 2017, based on criteria established in Internal Control – Integrated Framework (2013) issued by the Committee of Sponsoring Organizations of the Treadway Commission.
In our opinion, the consolidated financial statements referred to above present fairly, in all material respects, the financial position of the Company as of December 31, 2017 and 2016, and the results of its operations and its cash flows for each of the years in the three-year period ended December 31, 2017, in conformity with U.S. generally accepted accounting principles. Also in our opinion, the Company maintained, in all material respects, effective internal control over financial reporting as of December 31, 2017, based on criteria established in Internal Control – Integrated Framework (2013) issued by the Committee of Sponsoring Organizations of the Treadway Commission.
Basis for Opinion
The Company’s management is responsible for these consolidated financial statements, for maintaining effective internal control over financial reporting, and for its assessment of the effectiveness of internal control over financial reporting, included in the accompanying Management’s Report on Internal Control Over Financial Reporting. Our responsibility is to express an opinion on the Company’s consolidated financial statements and an opinion on the Company’s internal control over financial reporting based on our audits. We are a public accounting firm registered with the Public Company Accounting Oversight Board (United States) (“PCAOB”) and are required to be independent with respect to the Company in accordance with the U.S. federal securities laws and the applicable rules and regulations of the Securities and Exchange Commission and the PCAOB.
We conducted our audits in accordance with the standards of the PCAOB. Those standards require that we plan and perform the audits to obtain reasonable assurance about whether the consolidated financial statements are free of material misstatement, whether due to error or fraud, and whether effective internal control over financial reporting was maintained in all material respects.
Our audits of the consolidated financial statements included performing procedures to assess the risks of material misstatement of the consolidated financial statements, whether due to error or fraud, and performing procedures that respond to those risks. Such procedures included examining, on a test basis, evidence regarding the amounts and disclosures in the consolidated financial statements. Our audits also included evaluating the accounting principles used and significant estimates made by management, as well as evaluating the overall presentation of the consolidated financial statements. Our audit of internal control over financial reporting included obtaining an understanding of internal control over financial reporting, assessing the risk that a material weakness exists, and testing and evaluating the design and operating effectiveness of internal control based on the assessed risk. Our audits also included performing such other procedures as we considered necessary in the circumstances. We believe that our audits provide a reasonable basis for our opinions.
55
Definition and Limitations of Internal Control Over Financial Reporting
A company’s internal control over financial reporting is a process designed to provide reasonable assurance regarding the reliability of financial reporting and the preparation of financial statements for external purposes in accordance with generally accepted accounting principles. A company’s internal control over financial reporting includes those policies and procedures that (1) pertain to the maintenance of records that, in reasonable detail, accurately and fairly reflect the transactions and dispositions of the assets of the company; (2) provide reasonable assurance that transactions are recorded as necessary to permit preparation of financial statements in accordance with generally accepted accounting principles, and that receipts and expenditures of the company are being made only in accordance with authorizations of management and directors of the company; and (3) provide reasonable assurance regarding prevention or timely detection of unauthorized acquisition, use, or disposition of the company’s assets that could have a material effect on the financial statements.
Because of its inherent limitations, internal control over financial reporting may not prevent or detect misstatements. Also, projections of any evaluation of effectiveness to future periods are subject to the risk that controls may become inadequate because of changes in conditions, or that the degree of compliance with the policies or procedures may deteriorate.
/s/ KPMG LLP
We have served as the Company’s auditor since 2008.
Los Angeles, California
March 1, 2018
56
(Dollars in thousands, except share data)
|
|
|
December 31, |
|
|||||
|
|
|
|
2017 |
|
|
|
2016 |
|
|
ASSETS |
|
|
|
|
|
|
|
|
|
Current Assets: |
|
|
|
|
|
|
|
|
|
Cash and cash equivalents |
|
$ |
751,774 |
|
|
$ |
762,576 |
|
|
Restricted cash |
|
|
73,045 |
|
|
|
68,836 |
|
|
Receivables, less allowance for doubtful accounts of $46,789 and $39,469 at December 31, 2017 and 2016, respectively |
|
|
3,207,285 |
|
|
|
2,605,602 |
|
|
Warehouse receivables |
|
|
928,038 |
|
|
|
1,276,047 |
|
|
Prepaid expenses |
|
|
215,336 |
|
|
|
184,107 |
|
|
Income taxes receivable |
|
|
49,628 |
|
|
|
45,626 |
|
|
Other current assets |
|
|
227,421 |
|
|
|
179,656 |
|
|
Total Current Assets |
|
|
5,452,527 |
|
|
|
5,122,450 |
|
|
Property and equipment, net |
|
|
617,739 |
|
|
|
560,756 |
|
|
Goodwill |
|
|
3,254,740 |
|
|
|
2,981,392 |
|
|
Other intangible assets, net of accumulated amortization of $1,000,738 and $771,673 at December 31, 2017 and 2016, respectively |
|
|
1,399,112 |
|
|
|
1,411,039 |
|
|
Investments in unconsolidated subsidiaries |
|
|
238,001 |
|
|
|
232,238 |
|
|
Deferred tax assets, net |
|
|
98,746 |
|
|
|
105,324 |
|
|
Other assets, net |
|
|
422,965 |
|
|
|
366,388 |
|
|
Total Assets |
|
$ |
11,483,830 |
|
|
$ |
10,779,587 |
|
|
LIABILITIES AND EQUITY |
|
|
|
|
|
|
|
|
|
Current Liabilities: |
|
|
|
|
|
|
|
|
|
Accounts payable and accrued expenses |
|
$ |
1,674,287 |
|
|
$ |
1,446,438 |
|
|
Accrued bonus and profit sharing |
|
|
1,072,976 |
|
|
|
890,321 |
|
|
Compensation and employee benefits payable |
|
|
803,504 |
|
|
|
772,922 |
|
|
Income taxes payable |
|
|
70,634 |
|
|
|
58,351 |
|
|
Short-term borrowings: |
|
|
|
|
|
|
|
|
|
Warehouse lines of credit (which fund loans that U.S. Government Sponsored Enterprises have committed to purchase) |
|
|
910,766 |
|
|
|
1,254,653 |
|
|
Other |
|
|
16 |
|
|
|
16 |
|
|
Total short-term borrowings |
|
|
910,782 |
|
|
|
1,254,669 |
|
|
Current maturities of long-term debt |
|
|
8 |
|
|
|
11 |
|
|
Other current liabilities |
|
|
74,454 |
|
|
|
102,717 |
|
|
Total Current Liabilities |
|
|
4,606,645 |
|
|
|
4,525,429 |
|
|
Long-term debt, net of current maturities |
|
|
1,999,603 |
|
|
|
2,548,126 |
|
|
Non-current tax liabilities |
|
|
140,792 |
|
|
|
54,042 |
|
|
Deferred tax liabilities, net |
|
|
114,017 |
|
|
|
70,719 |
|
|
Other liabilities |
|
|
543,225 |
|
|
|
524,026 |
|
|
Total Liabilities |
|
|
7,404,282 |
|
|
|
7,722,342 |
|
|
Commitments and contingencies |
|
|
— |
|
|
|
— |
|
|
Equity: |
|
|
|
|
|
|
|
|
|
CBRE Group, Inc. Stockholders’ Equity: |
|
|
|
|
|
|
|
|
|
Class A common stock; $0.01 par value; 525,000,000 shares authorized; 339,459,138 and 337,279,449 shares issued and outstanding at December 31, 2017 and 2016, respectively |
|
|
3,395 |
|
|
|
3,373 |
|
|
Additional paid-in capital |
|
|
1,220,508 |
|
|
|
1,145,226 |
|
|
Accumulated earnings |
|
|
3,348,385 |
|
|
|
2,656,906 |
|
|
Accumulated other comprehensive loss |
|
|
(552,858 |
) |
|
|
(791,018 |
) |
|
Total CBRE Group, Inc. Stockholders’ Equity |
|
|
4,019,430 |
|
|
|
3,014,487 |
|
|
Non-controlling interests |
|
|
60,118 |
|
|
|
42,758 |
|
|
Total Equity |
|
|
4,079,548 |
|
|
|
3,057,245 |
|
|
Total Liabilities and Equity |
|
$ |
11,483,830 |
|
|
$ |
10,779,587 |
|
The accompanying notes are an integral part of these consolidated financial statements.
57
CONSOLIDATED STATEMENTS OF OPERATIONS
(Dollars in thousands, except share data)
|
|
|
Year Ended December 31, |
|
|||||||||
|
|
|
|
2017 |
|
|
|
2016 |
|
|
|
2015 |
|
|
Revenue |
|
$ |
14,209,608 |
|
|
$ |
13,071,589 |
|
|
$ |
10,855,810 |
|
|
Costs and expenses: |
|
|
|
|
|
|
|
|
|
|
|
|
|
Cost of services |
|
|
9,893,226 |
|
|
|
9,123,727 |
|
|
|
7,082,932 |
|
|
Operating, administrative and other |
|
|
2,858,654 |
|
|
|
2,781,310 |
|
|
|
2,633,609 |
|
|
Depreciation and amortization |
|
|
406,114 |
|
|
|
366,927 |
|
|
|
314,096 |
|
|
Total costs and expenses |
|
|
13,157,994 |
|
|
|
12,271,964 |
|
|
|
10,030,637 |
|
|
Gain on disposition of real estate |
|
|
19,828 |
|
|
|
15,862 |
|
|
|
10,771 |
|
|
Operating income |
|
|
1,071,442 |
|
|
|
815,487 |
|
|
|
835,944 |
|
|
Equity income from unconsolidated subsidiaries |
|
|
210,207 |
|
|
|
197,351 |
|
|
|
162,849 |
|
|
Other income (loss) |
|
|
9,405 |
|
|
|
4,688 |
|
|
|
(3,809 |
) |
|
Interest income |
|
|
9,853 |
|
|
|
8,051 |
|
|
|
6,311 |
|
|
Interest expense |
|
|
136,814 |
|
|
|
144,851 |
|
|
|
118,880 |
|
|
Write-off of financing costs on extinguished debt |
|
|
— |
|
|
|
— |
|
|
|
2,685 |
|
|
Income before provision for income taxes |
|
|
1,164,093 |
|
|
|
880,726 |
|
|
|
879,730 |
|
|
Provision for income taxes |
|
|
466,147 |
|
|
|
296,662 |
|
|
|
320,853 |
|
|
Net income |
|
|
697,946 |
|
|
|
584,064 |
|
|
|
558,877 |
|
|
Less: Net income attributable to non-controlling interests |
|
|
6,467 |
|
|
|
12,091 |
|
|
|
11,745 |
|
|
Net income attributable to CBRE Group, Inc. |
|
$ |
691,479 |
|
|
$ |
571,973 |
|
|
$ |
547,132 |
|
|
Basic income per share: |
|
|
|
|
|
|
|
|
|
|
|
|
|
Net income per share attributable to CBRE Group, Inc. |
|
$ |
2.05 |
|
|
$ |
1.71 |
|
|
$ |
1.64 |
|
|
Weighted average shares outstanding for basic income per share |
|
|
337,658,017 |
|
|
|
335,414,831 |
|
|
|
332,616,301 |
|
|
Diluted income per share: |
|
|
|
|
|
|
|
|
|
|
|
|
|
Net income per share attributable to CBRE Group, Inc. |
|
$ |
2.03 |
|
|
$ |
1.69 |
|
|
$ |
1.63 |
|
|
Weighted average shares outstanding for diluted income per share |
|
|
340,783,556 |
|
|
|
338,424,563 |
|
|
|
336,414,856 |
|
The accompanying notes are an integral part of these consolidated financial statements.
58
CONSOLIDATED STATEMENTS OF COMPREHENSIVE INCOME
(Dollars in thousands)
|
|
|
Year Ended December 31, |
|
|||||||||
|
|
|
|
2017 |
|
|
|
2016 |
|
|
|
2015 |
|
|
Net income |
|
$ |
697,946 |
|
|
$ |
584,064 |
|
|
$ |
558,877 |
|
|
Other comprehensive income (loss): |
|
|
|
|
|
|
|
|
|
|
|
|
|
Foreign currency translation gain (loss) |
|
|
217,221 |
|
|
|
(235,278 |
) |
|
|
(164,350 |
) |
|
Fees associated with termination of interest rate swaps, net of $2,244 income tax benefit for the year ended December 31, 2015 |
|
|
— |
|
|
|
— |
|
|
|
(3,908 |
) |
|
Amounts reclassified from accumulated other comprehensive loss to interest expense, net of $3,066, $4,443 and $4,411 income tax expense for the years ended December 31, 2017, 2016 and 2015, respectively |
|
|
4,964 |
|
|
|
6,839 |
|
|
|
7,680 |
|
|
Unrealized gains (losses) on interest rate swaps, net of $362 income tax expense, and $929 and $2,358 income tax benefit for the years ended December 31, 2017, 2016 and 2015, respectively |
|
|
585 |
|
|
|
(1,431 |
) |
|
|
(4,107 |
) |
|
Unrealized holding gains (losses) on available for sale securities, net of $1,685 and $250 income tax expense and $405 income tax benefit for the years ended December 31, 2017, 2016 and 2015, respectively |
|
|
2,737 |
|
|
|
384 |
|
|
|
(705 |
) |
|
Pension liability adjustments, net of $2,601 income tax expense, $13,057 income tax benefit and $773 income tax expense for the years ended December 31, 2017, 2016 and 2015, respectively |
|
|
12,701 |
|
|
|
(63,749 |
) |
|
|
3,741 |
|
|
Other, net of $342 income tax expense and $3,705 income tax benefit for the years ended December 31, 2017 and 2016, respectively |
|
|
364 |
|
|
|
(12,091 |
) |
|
|
3 |
|
|
Total other comprehensive income (loss) |
|
|
238,572 |
|
|
|
(305,326 |
) |
|
|
(161,646 |
) |
|
Comprehensive income |
|
|
936,518 |
|
|
|
278,738 |
|
|
|
397,231 |
|
|
Less: Comprehensive income attributable to non-controlling interests |
|
|
6,879 |
|
|
|
12,108 |
|
|
|
11,754 |
|
|
Comprehensive income attributable to CBRE Group, Inc. |
|
$ |
929,639 |
|
|
$ |
266,630 |
|
|
$ |
385,477 |
|
The accompanying notes are an integral part of these consolidated financial statements.
59
CONSOLIDATED STATEMENTS OF CASH FLOWS
(Dollars in thousands)
|
|
|
Year Ended December 31, |
|
|||||||||
|
|
|
|
2017 |
|
|
|
2016 |
|
|
|
2015 |
|
|
CASH FLOWS FROM OPERATING ACTIVITIES: |
|
|
|
|
|
|
|
|
|
|
|
|
|
Net income |
|
$ |
697,946 |
|
|
$ |
584,064 |
|
|
$ |
558,877 |
|
|
Adjustments to reconcile net income to net cash provided by operating activities: |
|
|
|
|
|
|
|
|
|
|
|
|
|
Depreciation and amortization |
|
|
406,114 |
|
|
|
366,927 |
|
|
|
314,096 |
|
|
Amortization and write-off of financing costs on extinguished debt |
|
|
10,783 |
|
|
|
10,935 |
|
|
|
12,311 |
|
|
Gains related to mortgage servicing rights, premiums on loan sales and sales of other assets |
|
|
(200,386 |
) |
|
|
(201,362 |
) |
|
|
(140,828 |
) |
|
Net realized and unrealized (gains) losses from investments |
|
|
(9,405 |
) |
|
|
(4,688 |
) |
|
|
3,809 |
|
|
Gain on disposition of real estate held for investment |
|
|
— |
|
|
|
(9,901 |
) |
|
|
(8,573 |
) |
|
Equity income from unconsolidated subsidiaries |
|
|
(210,207 |
) |
|
|
(197,351 |
) |
|
|
(162,849 |
) |
|
Provision for doubtful accounts |
|
|
8,044 |
|
|
|
4,711 |
|
|
|
10,211 |
|
|
Deferred income taxes |
|
|
(8,989 |
) |
|
|
(9,642 |
) |
|
|
(14,935 |
) |
|
Compensation expense for equity awards |
|
|
93,087 |
|
|
|
63,484 |
|
|
|
74,709 |
|
|
Proceeds from sale of mortgage loans |
|
|
18,052,756 |
|
|
|
15,833,633 |
|
|
|
11,266,224 |
|
|
Origination of mortgage loans |
|
|
(17,655,104 |
) |
|
|
(15,297,471 |
) |
|
|
(12,488,511 |
) |
|
(Decrease) increase in warehouse lines of credit |
|
|
(343,887 |
) |
|
|
(496,128 |
) |
|
|
1,249,596 |
|
|
Distribution of earnings from unconsolidated subsidiaries |
|
|
27,945 |
|
|
|
29,031 |
|
|
|
36,630 |
|
|
Tenant concessions received |
|
|
19,337 |
|
|
|
22,547 |
|
|
|
7,861 |
|
|
Purchase of trading securities |
|
|
(110,570 |
) |
|
|
(87,765 |
) |
|
|
(85,707 |
) |
|
Proceeds from sale of trading securities |
|
|
68,547 |
|
|
|
105,866 |
|
|
|
78,798 |
|
|
Proceeds from securities sold, not yet purchased |
|
|
13,320 |
|
|
|
17,932 |
|
|
|
16,014 |
|
|
Securities purchased to cover short sales |
|
|
(13,840 |
) |
|
|
(19,017 |
) |
|
|
(13,147 |
) |
|
Increase in receivables |
|
|
(483,712 |
) |
|
|
(234,720 |
) |
|
|
(230,307 |
) |
|
Increase in prepaid expenses and other assets |
|
|
(66,452 |
) |
|
|
(93,192 |
) |
|
|
(84,997 |
) |
|
Decrease (increase) in real estate held for sale and under development |
|
|
8,399 |
|
|
|
(2,245 |
) |
|
|
(16,003 |
) |
|
Increase in accounts payable and accrued expenses |
|
|
171,346 |
|
|
|
2,235 |
|
|
|
177,567 |
|
|
Increase in compensation and employee benefits payable and accrued bonus and profit sharing |
|
|
152,235 |
|
|
|
132,947 |
|
|
|
115,805 |
|
|
Decrease (increase) in income taxes receivable/payable |
|
|
108,151 |
|
|
|
(6,334 |
) |
|
|
43,085 |
|
|
Increase (decrease) in other liabilities |
|
|
1,787 |
|
|
|
(3,231 |
) |
|
|
(15,543 |
) |
|
Other operating activities, net |
|
|
(26,740 |
) |
|
|
(60,950 |
) |
|
|
(52,296 |
) |
|
Net cash provided by operating activities |
|
|
710,505 |
|
|
|
450,315 |
|
|
|
651,897 |
|
|
CASH FLOWS FROM INVESTING ACTIVITIES: |
|
|
|
|
|
|
|
|
|
|
|
|
|
Capital expenditures |
|
|
(178,042 |
) |
|
|
(191,205 |
) |
|
|
(139,464 |
) |
|
Acquisition of Global Workplace Solutions (GWS), including net assets acquired, intangibles and goodwill, net of cash acquired |
|
|
— |
|
|
|
(10,477 |
) |
|
|
(1,421,663 |
) |
|
Acquisition of businesses (other than GWS), including net assets acquired, intangibles and goodwill, net of cash acquired |
|
|
(142,433 |
) |
|
|
(31,634 |
) |
|
|
(161,106 |
) |
|
Contributions to unconsolidated subsidiaries |
|
|
(68,700 |
) |
|
|
(66,816 |
) |
|
|
(71,208 |
) |
|
Distributions from unconsolidated subsidiaries |
|
|
247,574 |
|
|
|
213,446 |
|
|
|
187,577 |
|
|
Net proceeds from disposition of real estate held for investment |
|
|
— |
|
|
|
44,326 |
|
|
|
3,584 |
|
|
Decrease (increase) in restricted cash |
|
|
1,281 |
|
|
|
(2,552 |
) |
|
|
(49,012 |
) |
|
Purchase of available for sale securities |
|
|
(34,864 |
) |
|
|
(37,661 |
) |
|
|
(40,287 |
) |
|
Proceeds from the sale of available for sale securities |
|
|
31,377 |
|
|
|
35,051 |
|
|
|
42,572 |
|
|
Other investing activities, net |
|
|
2,392 |
|
|
|
40,083 |
|
|
|
30,048 |
|
|
Net cash used in investing activities |
|
|
(141,415 |
) |
|
|
(7,439 |
) |
|
|
(1,618,959 |
) |
The accompanying notes are an integral part of these consolidated financial statements.
60
CONSOLIDATED STATEMENTS OF CASH FLOWS
(Dollars in thousands)
|
|
|
Year Ended December 31, |
|
|||||||||
|
|
|
|
2017 |
|
|
|
2016 |
|
|
|
2015 |
|
|
CASH FLOWS FROM FINANCING ACTIVITIES: |
|
|
|
|
|
|
|
|
|
|
|
|
|
Proceeds from senior term loans |
|
|
200,000 |
|
|
|
— |
|
|
|
900,000 |
|
|
Repayment of senior term loans |
|
|
(751,876 |
) |
|
|
(136,250 |
) |
|
|
(657,488 |
) |
|
Proceeds from revolving credit facility |
|
|
1,521,000 |
|
|
|
2,909,000 |
|
|
|
2,643,500 |
|
|
Repayment of revolving credit facility |
|
|
(1,521,000 |
) |
|
|
(2,909,000 |
) |
|
|
(2,648,012 |
) |
|
Proceeds from issuance of 4.875% senior notes, net |
|
|
— |
|
|
|
— |
|
|
|
595,440 |
|
|
Proceeds from notes payable on real estate held for investment |
|
|
137 |
|
|
|
7,274 |
|
|
|
— |
|
|
Repayment of notes payable on real estate held for investment |
|
|
(1,779 |
) |
|
|
(33,944 |
) |
|
|
(1,576 |
) |
|
Proceeds from notes payable on real estate held for sale and under development |
|
|
4,196 |
|
|
|
17,727 |
|
|
|
20,879 |
|
|
Repayment of notes payable on real estate held for sale and under development |
|
|
(10,777 |
) |
|
|
(4,102 |
) |
|
|
(1,186 |
) |
|
Shares and units repurchased for payment of taxes on equity awards |
|
|
(29,549 |
) |
|
|
(27,426 |
) |
|
|
(24,523 |
) |
|
Non-controlling interest contributions |
|
|
5,301 |
|
|
|
2,272 |
|
|
|
5,909 |
|
|
Non-controlling interest distributions |
|
|
(8,715 |
) |
|
|
(19,133 |
) |
|
|
(16,582 |
) |
|
Payment of financing costs |
|
|
(7,999 |
) |
|
|
(5,618 |
) |
|
|
(30,664 |
) |
|
Other financing activities, net |
|
|
(2,675 |
) |
|
|
(443 |
) |
|
|
3,851 |
|
|
Net cash (used in) provided by financing activities |
|
|
(603,736 |
) |
|
|
(199,643 |
) |
|
|
789,548 |
|
|
Effect of currency exchange rate changes on cash and cash equivalents |
|
|
23,844 |
|
|
|
(21,060 |
) |
|
|
(22,967 |
) |
|
NET (DECREASE) INCREASE IN CASH AND CASH EQUIVALENTS |
|
|
(10,802 |
) |
|
|
222,173 |
|
|
|
(200,481 |
) |
|
CASH AND CASH EQUIVALENTS, AT BEGINNING OF PERIOD |
|
|
762,576 |
|
|
|
540,403 |
|
|
|
740,884 |
|
|
CASH AND CASH EQUIVALENTS, AT END OF PERIOD |
|
$ |
751,774 |
|
|
$ |
762,576 |
|
|
$ |
540,403 |
|
|
|
|
|
|
|
|
|
|
|
|
|
|
|
|
SUPPLEMENTAL DISCLOSURES OF CASH FLOW INFORMATION: |
|
|
|
|
|
|
|
|
|
|
|
|
|
Cash paid during the period for: |
|
|
|
|
|
|
|
|
|
|
|
|
|
Interest |
|
$ |
117,164 |
|
|
$ |
125,800 |
|
|
$ |
88,078 |
|
|
Income taxes, net |
|
$ |
356,997 |
|
|
$ |
294,848 |
|
|
$ |
285,730 |
|
The accompanying notes are an integral part of these consolidated financial statements.
61
CONSOLIDATED STATEMENTS OF EQUITY
(Dollars in thousands)
|
|
|
CBRE Group, Inc. Shareholders |
|
|
|
|
|
|
|
|
|
|||||||||||||||||||||
|
|
|
|
|
|
|
|
|
|
|
|
|
|
|
|
|
|
|
Accumulated other |
|
|
|
|
|
|
|
|
|
|||||
|
|
|
|
|
|
|
|
|
|
|
|
|
|
|
|
|
|
|
comprehensive loss |
|
|
|
|
|
|
|
|
|
|||||
|
|
|
|
|
|
|
|
|
|
|
|
|
|
|
|
|
|
|
|
|
|
|
Foreign |
|
|
|
|
|
|
|
|
|
|
|
|
|
|
|
|
|
Class A |
|
|
Additional |
|
|
|
|
|
|
Minimum |
|
|
currency |
|
|
|
|
|
|
|
|
|
||||
|
|
|
|
|
|
|
common |
|
|
paid-in |
|
|
Accumulated |
|
|
pension |
|
|
translation |
|
|
Non-controlling |
|
|
|
|
|
||||||
|
|
|
Shares |
|
|
stock |
|
|
capital |
|
|
earnings |
|
|
liability |
|
|
and other |
|
|
interests |
|
|
Total |
|
||||||||
|
Balance at December 31, 2014 |
|
|
332,991,031 |
|
|
$ |
3,330 |
|
|
$ |
1,039,425 |
|
|
$ |
1,541,095 |
|
|
$ |
(105,662 |
) |
|
$ |
(218,358 |
) |
|
$ |
41,568 |
|
|
$ |
2,301,398 |
|
|
Net income |
|
|
— |
|
|
|
— |
|
|
|
— |
|
|
|
547,132 |
|
|
|
— |
|
|
|
— |
|
|
|
11,745 |
|
|
|
558,877 |
|
|
Pension liability adjustments, net of tax |
|
|
— |
|
|
|
— |
|
|
|
— |
|
|
|
— |
|
|
|
3,741 |
|
|
|
— |
|
|
|
— |
|
|
|
3,741 |
|
|
Stock options exercised (including tax benefit) |
|
|
561,583 |
|
|
|
6 |
|
|
|
9,796 |
|
|
|
— |
|
|
|
— |
|
|
|
— |
|
|
|
— |
|
|
|
9,802 |
|
|
Restricted stock awards vesting (including tax benefit) |
|
|
1,021,950 |
|
|
|
10 |
|
|
|
6,714 |
|
|
|
— |
|
|
|
— |
|
|
|
— |
|
|
|
— |
|
|
|
6,724 |
|
|
Compensation expense for equity awards |
|
|
— |
|
|
|
— |
|
|
|
74,709 |
|
|
|
— |
|
|
|
— |
|
|
|
— |
|
|
|
— |
|
|
|
74,709 |
|
|
Shares and units repurchased for payment of taxes on equity awards |
|
|
(332,799 |
) |
|
|
(3 |
) |
|
|
(24,520 |
) |
|
|
— |
|
|
|
— |
|
|
|
— |
|
|
|
— |
|
|
|
(24,523 |
) |
|
Fees associated with termination of interest rate swaps, net of tax (see Note 7) |
|
|
— |
|
|
|
— |
|
|
|
— |
|
|
|
— |
|
|
|
— |
|
|
|
(3,908 |
) |
|
|
— |
|
|
|
(3,908 |
) |
|
Amounts reclassified from accumulated other comprehensive loss to interest expense, net of tax |
|
|
— |
|
|
|
— |
|
|
|
— |
|
|
|
— |
|
|
|
— |
|
|
|
7,680 |
|
|
|
— |
|
|
|
7,680 |
|
|
Unrealized losses on interest rate swaps, net of tax |
|
|
— |
|
|
|
— |
|
|
|
— |
|
|
|
— |
|
|
|
— |
|
|
|
(4,107 |
) |
|
|
— |
|
|
|
(4,107 |
) |
|
Unrealized holding losses on available for sale securities, net of tax |
|
|
— |
|
|
|
— |
|
|
|
— |
|
|
|
— |
|
|
|
— |
|
|
|
(705 |
) |
|
|
— |
|
|
|
(705 |
) |
|
Foreign currency translation (loss) gain |
|
|
— |
|
|
|
— |
|
|
|
— |
|
|
|
— |
|
|
|
— |
|
|
|
(164,359 |
) |
|
|
9 |
|
|
|
(164,350 |
) |
|
Cancellation of non-vested stock awards |
|
|
(13,338 |
) |
|
|
(1 |
) |
|
|
— |
|
|
|
— |
|
|
|
— |
|
|
|
— |
|
|
|
— |
|
|
|
(1 |
) |
|
Contributions from non-controlling interests |
|
|
— |
|
|
|
— |
|
|
|
— |
|
|
|
— |
|
|
|
— |
|
|
|
— |
|
|
|
5,909 |
|
|
|
5,909 |
|
|
Distributions to non-controlling interests |
|
|
— |
|
|
|
— |
|
|
|
— |
|
|
|
— |
|
|
|
— |
|
|
|
— |
|
|
|
(16,582 |
) |
|
|
(16,582 |
) |
|
Other |
|
|
2,069 |
|
|
|
— |
|
|
|
634 |
|
|
|
— |
|
|
|
— |
|
|
|
3 |
|
|
|
3,769 |
|
|
|
4,406 |
|
|
Balance at December 31, 2015 |
|
|
334,230,496 |
|
|
$ |
3,342 |
|
|
$ |
1,106,758 |
|
|
$ |
2,088,227 |
|
|
$ |
(101,921 |
) |
|
$ |
(383,754 |
) |
|
$ |
46,418 |
|
|
$ |
2,759,070 |
|
|
Net income |
|
|
— |
|
|
|
— |
|
|
|
— |
|
|
|
571,973 |
|
|
|
— |
|
|
|
— |
|
|
|
12,091 |
|
|
|
584,064 |
|
|
Adoption of Accounting Standards Update 2016-09, net of tax (see Note 2) |
|
|
— |
|
|
|
— |
|
|
|
4,975 |
|
|
|
(3,294 |
) |
|
|
— |
|
|
|
— |
|
|
|
— |
|
|
|
1,681 |
|
|
Pension liability adjustments, net of tax |
|
|
— |
|
|
|
— |
|
|
|
− |
|
|
|
— |
|
|
|
(63,749 |
) |
|
|
— |
|
|
|
— |
|
|
|
(63,749 |
) |
|
Stock options exercised |
|
|
89,727 |
|
|
|
1 |
|
|
|
914 |
|
|
|
— |
|
|
|
— |
|
|
|
— |
|
|
|
— |
|
|
|
915 |
|
|
Restricted stock awards vesting |
|
|
2,955,142 |
|
|
|
30 |
|
|
|
(30 |
) |
|
|
— |
|
|
|
— |
|
|
|
— |
|
|
|
— |
|
|
|
— |
|
|
Compensation expense for equity awards |
|
|
— |
|
|
|
— |
|
|
|
63,484 |
|
|
|
— |
|
|
|
— |
|
|
|
— |
|
|
|
— |
|
|
|
63,484 |
|
|
Units repurchased for payment of taxes on equity awards |
|
|
— |
|
|
|
— |
|
|
|
(27,426 |
) |
|
|
— |
|
|
|
— |
|
|
|
— |
|
|
|
— |
|
|
|
(27,426 |
) |
|
Amounts reclassified from accumulated other comprehensive loss to interest expense, net of tax |
|
|
— |
|
|
|
— |
|
|
|
— |
|
|
|
— |
|
|
|
— |
|
|
|
6,839 |
|
|
|
— |
|
|
|
6,839 |
|
The accompanying notes are an integral part of these consolidated financial statements.
62
CONSOLIDATED STATEMENTS OF EQUITY
(Dollars in thousands)
|
|
|
CBRE Group, Inc. Shareholders |
|
|
|
|
|
|
|
|
|
|||||||||||||||||||||
|
|
|
|
|
|
|
|
|
|
|
|
|
|
|
|
|
|
|
Accumulated other |
|
|
|
|
|
|
|
|
|
|||||
|
|
|
|
|
|
|
|
|
|
|
|
|
|
|
|
|
|
|
comprehensive loss |
|
|
|
|
|
|
|
|
|
|||||
|
|
|
|
|
|
|
|
|
|
|
|
|
|
|
|
|
|
|
|
|
|
|
Foreign |
|
|
|
|
|
|
|
|
|
|
|
|
|
|
|
|
|
Class A |
|
|
Additional |
|
|
|
|
|
|
Minimum |
|
|
currency |
|
|
|
|
|
|
|
|
|
||||
|
|
|
|
|
|
|
common |
|
|
paid-in |
|
|
Accumulated |
|
|
pension |
|
|
translation |
|
|
Non-controlling |
|
|
|
|
|
||||||
|
|
|
Shares |
|
|
stock |
|
|
capital |
|
|
earnings |
|
|
liability |
|
|
and other |
|
|
interests |
|
|
Total |
|
||||||||
|
Unrealized losses on interest rate swaps, net of tax |
|
|
— |
|
|
|
— |
|
|
|
— |
|
|
|
— |
|
|
|
— |
|
|
|
(1,431 |
) |
|
|
— |
|
|
|
(1,431 |
) |
|
Unrealized holding gains on available for sale securities, net of tax |
|
|
— |
|
|
|
— |
|
|
|
— |
|
|
|
— |
|
|
|
— |
|
|
|
384 |
|
|
|
— |
|
|
|
384 |
|
|
Foreign currency translation (loss) gain |
|
|
— |
|
|
|
— |
|
|
|
— |
|
|
|
— |
|
|
|
— |
|
|
|
(235,295 |
) |
|
|
17 |
|
|
|
(235,278 |
) |
|
Contributions from non-controlling interests |
|
|
— |
|
|
|
— |
|
|
|
— |
|
|
|
— |
|
|
|
— |
|
|
|
− |
|
|
|
2,272 |
|
|
|
2,272 |
|
|
Distributions to non-controlling interests |
|
|
— |
|
|
|
— |
|
|
|
— |
|
|
|
— |
|
|
|
— |
|
|
|
− |
|
|
|
(19,133 |
) |
|
|
(19,133 |
) |
|
Other |
|
|
4,084 |
|
|
|
— |
|
|
|
(3,449 |
) |
|
|
— |
|
|
|
— |
|
|
|
(12,091 |
) |
|
|
1,093 |
|
|
|
(14,447 |
) |
|
Balance at December 31, 2016 |
|
|
337,279,449 |
|
|
$ |
3,373 |
|
|
$ |
1,145,226 |
|
|
$ |
2,656,906 |
|
|
$ |
(165,670 |
) |
|
$ |
(625,348 |
) |
|
$ |
42,758 |
|
|
$ |
3,057,245 |
|
|
Net income |
|
|
— |
|
|
|
— |
|
|
|
— |
|
|
|
691,479 |
|
|
|
— |
|
|
|
— |
|
|
|
6,467 |
|
|
|
697,946 |
|
|
Pension liability adjustments, net of tax |
|
|
— |
|
|
|
— |
|
|
|
— |
|
|
|
— |
|
|
|
12,701 |
|
|
|
— |
|
|
|
— |
|
|
|
12,701 |
|
|
Non-cash issuance of common stock related to acquisition |
|
|
495,828 |
|
|
|
5 |
|
|
|
11,688 |
|
|
|
— |
|
|
|
— |
|
|
|
— |
|
|
|
— |
|
|
|
11,693 |
|
|
Restricted stock awards vesting |
|
|
1,660,269 |
|
|
|
17 |
|
|
|
(17 |
) |
|
|
— |
|
|
|
— |
|
|
|
— |
|
|
|
— |
|
|
|
— |
|
|
Compensation expense for equity awards |
|
|
— |
|
|
|
— |
|
|
|
93,087 |
|
|
|
— |
|
|
|
— |
|
|
|
— |
|
|
|
— |
|
|
|
93,087 |
|
|
Units repurchased for payment of taxes on equity awards |
|
|
— |
|
|
|
— |
|
|
|
(29,549 |
) |
|
|
— |
|
|
|
— |
|
|
|
— |
|
|
|
— |
|
|
|
(29,549 |
) |
|
Amounts reclassified from accumulated other comprehensive loss to interest expense, net of tax |
|
|
— |
|
|
|
— |
|
|
|
— |
|
|
|
— |
|
|
|
— |
|
|
|
4,964 |
|
|
|
— |
|
|
|
4,964 |
|
|
Unrealized gains on interest rate swaps, net of tax |
|
|
— |
|
|
|
— |
|
|
|
— |
|
|
|
— |
|
|
|
— |
|
|
|
585 |
|
|
|
— |
|
|
|
585 |
|
|
Unrealized holding gains on available for sale securities, net of tax |
|
|
— |
|
|
|
— |
|
|
|
— |
|
|
|
— |
|
|
|
— |
|
|
|
2,737 |
|
|
|
— |
|
|
|
2,737 |
|
|
Foreign currency translation gain |
|
|
— |
|
|
|
— |
|
|
|
— |
|
|
|
— |
|
|
|
— |
|
|
|
216,809 |
|
|
|
412 |
|
|
|
217,221 |
|
|
Contributions from non-controlling interests |
|
|
— |
|
|
|
— |
|
|
|
— |
|
|
|
— |
|
|
|
— |
|
|
|
— |
|
|
|
5,301 |
|
|
|
5,301 |
|
|
Distributions to non-controlling interests |
|
|
— |
|
|
|
— |
|
|
|
— |
|
|
|
— |
|
|
|
— |
|
|
|
— |
|
|
|
(8,715 |
) |
|
|
(8,715 |
) |
|
Acquisition of non-controlling interests |
|
|
— |
|
|
|
— |
|
|
|
— |
|
|
|
— |
|
|
|
— |
|
|
|
— |
|
|
|
12,671 |
|
|
|
12,671 |
|
|
Other |
|
|
23,592 |
|
|
|
— |
|
|
|
73 |
|
|
|
— |
|
|
|
— |
|
|
|
364 |
|
|
|
1,224 |
|
|
|
1,661 |
|
|
Balance at December 31, 2017 |
|
|
339,459,138 |
|
|
$ |
3,395 |
|
|
$ |
1,220,508 |
|
|
$ |
3,348,385 |
|
|
$ |
(152,969 |
) |
|
$ |
(399,889 |
) |
|
$ |
60,118 |
|
|
$ |
4,079,548 |
|
The accompanying notes are an integral part of these consolidated financial statements.
63
NOTES TO CONSOLIDATED FINANCIAL STATEMENTS
|
1. |
Nature of Operations |
CBRE Group, Inc., a Delaware corporation (which may be referred to in these financial statements as the “company”, “we”, “us” and “our”), was incorporated on February 20, 2001. We are the world’s largest commercial real estate services and investment firm, based on 2017 revenue, with leading global market positions in our leasing, property sales, occupier outsourcing and valuation businesses. Our business is focused on providing services to both occupiers of real estate and investors in real estate. For occupiers, we provide facilities management, project management, transaction (both property sales and tenant leasing) and consulting services, among others. For investors, we provide capital markets (property sales, commercial mortgage brokerage, loan origination and servicing), leasing, investment management, property management, valuation and development services, among others. We generate revenue from both management fees (large multi-year portfolio and per-project contracts) and commissions on transactions. As of December 31, 2017, we operated in more than 450 offices worldwide with over 80,000 employees, excluding independent affiliates, providing commercial real estate services under the “CBRE” brand name, investment management services under the “CBRE Global Investors” brand name and development services under the “Trammell Crow Company” brand name.
|
2. |
Significant Accounting Policies |
Principles of Consolidation
The accompanying consolidated financial statements include our accounts and those of our consolidated subsidiaries, which are comprised of variable interest entities in which we are the primary beneficiary and voting interest entities, in which we determined we have a controlling financial interest, under the “Consolidations” Topic of the Financial Accounting Standards Board (FASB) Accounting Standards Codification (ASC) (Topic 810). The equity attributable to non-controlling interests in subsidiaries is shown separately in the accompanying consolidated balance sheets. All significant intercompany accounts and transactions have been eliminated in consolidation.
Variable Interest Entities (VIEs)
We determine whether an entity is a VIE and, if so, whether it should be consolidated by utilizing judgments and estimates that are inherently subjective. Our determination of whether an entity in which we hold a direct or indirect variable interest is a VIE is based on several factors, including whether the entity’s total equity investment at risk upon inception is sufficient to finance the entity’s activities without additional subordinated financial support. We make judgments regarding the sufficiency of the equity at risk based first on a qualitative analysis, and then a quantitative analysis, if necessary.
We analyze any investments in VIEs to determine if we are the primary beneficiary. In evaluating whether we are the primary beneficiary, we evaluate our direct and indirect economic interests in the entity. A reporting entity is determined to be the primary beneficiary if it holds a controlling financial interest in the VIE. Determining which reporting entity, if any, has a controlling financial interest in a VIE is primarily a qualitative approach focused on identifying which reporting entity has both (1) the power to direct the activities of a VIE that most significantly impact such entity’s economic performance and (2) the obligation to absorb losses or the right to receive benefits from such entity that could potentially be significant to such entity. Performance of that analysis requires the exercise of judgment.
We consider a variety of factors in identifying the entity that holds the power to direct matters that most significantly impact the VIE’s economic performance including, but not limited to, the ability to direct financing, leasing, construction and other operating decisions and activities. In addition, we consider the rights of other investors to participate in those decisions, to replace the manager and to sell or liquidate the entity. We determine whether we are the primary beneficiary of a VIE at the time we become involved with a variable interest entity and reconsider that conclusion continually.
64
CBRE GROUP, INC.
NOTES TO CONSOLIDATED FINANCIAL STATEMENTS—(Continued)
We consolidate any VIE of which we are the primary beneficiary and disclose significant VIEs of which we are not the primary beneficiary, if any, as well as disclose our maximum exposure to loss related to VIEs that are not consolidated (see Note 5).
Voting Interest Entities (VOEs)
For VOEs, we consolidate the entity if we have a controlling financial interest. We have a controlling financial interest in a VOE if (i) for legal entities other than limited partnerships, we own a majority voting interest in the VOE or, for limited partnerships and similar entities, we own a majority of the entity’s kick-out rights through voting limited partnership interests and (ii) non-controlling shareholders or partners do not hold substantive participating rights and no other conditions exist that would indicate that we do not control the entity.
Other Investments
Our investments in unconsolidated subsidiaries in which we have the ability to exercise significant influence over operating and financial policies, but do not control, or entities which are variable interest entities in which we are not the primary beneficiary are accounted for under the equity method. We eliminate transactions with such equity method subsidiaries to the extent of our ownership in such subsidiaries. Accordingly, our share of the earnings from these equity-method basis companies is included in consolidated net income. All other investments held on a long-term basis are valued at cost less any impairment in value.
Impairment Evaluation
Under either the equity or cost method, impairment losses are recognized upon evidence of other-than-temporary losses of value. When testing for impairment on investments that are not actively traded on a public market, we generally use a discounted cash flow approach to estimate the fair value of our investments and/or look to comparable activities in the marketplace. Management’s judgment is required in developing the assumptions for the discounted cash flow approach. These assumptions include net asset values, internal rates of return, discount and capitalization rates, interest rates and financing terms, rental rates, timing of leasing activity, estimates of lease terms and related concessions, etc. When determining if impairment is other-than-temporary, we also look to the length of time and the extent to which fair value has been less than cost as well as the financial condition and near-term prospects of each investment.
Use of Estimates
Our consolidated financial statements have been prepared in accordance with accounting principles generally accepted in the United States (U.S.), or GAAP, which require management to make estimates and assumptions about future events. These estimates and assumptions affect the amounts of assets, liabilities, revenue and expenses we report. Such estimates include the value of goodwill, intangibles and other long-lived assets, accounts receivable, investments in unconsolidated subsidiaries and assumptions used in the calculation of income taxes, retirement and other post-employment benefits, among others. These estimates and assumptions are based on management’s best judgment, and are evaluated on an ongoing basis and adjusted, as needed, using historical experience and other factors, including consideration of the macroeconomic environment. As future events and their effects cannot be forecast with precision, actual results could differ significantly from these estimates. Changes in estimates resulting from continuing changes in the economic environment will be reflected in the financial statements in future periods.
Cash and cash equivalents generally consist of cash and highly liquid investments with an original maturity of three months or less. Included in the accompanying consolidated balance sheets as of December 31, 2017 and 2016 is cash and cash equivalents of $123.8 million and $73.3 million, respectively, from consolidated funds and other entities, which are not available for general corporate use. We also manage certain cash and cash equivalents as an agent for our investment and property and facilities management clients. These amounts are not included in the accompanying consolidated balance sheets (see Note 17).
65
CBRE GROUP, INC.
NOTES TO CONSOLIDATED FINANCIAL STATEMENTS—(Continued)
Included in the accompanying consolidated balance sheets as of December 31, 2017 and 2016 is restricted cash of $73.0 million and $68.8 million, respectively. The balances primarily include restricted cash set aside to cover funding obligations as required by contracts executed by us in the ordinary course of business.
Concentration of Credit Risk
Financial instruments that potentially subject us to credit risk consist principally of trade receivables and interest-bearing investments. Users of real estate services account for a substantial portion of trade receivables and collateral is generally not required. The risk associated with this concentration is limited due to the large number of users and their geographic dispersion.
We place substantially all of our interest-bearing investments with several major financial institutions to limit the amount of credit exposure with any one financial institution.
Property and Equipment
Property and equipment, which includes leasehold improvements, is stated at cost, net of accumulated depreciation. Depreciation and amortization of property and equipment is computed primarily using the straight-line method over estimated useful lives ranging up to 10 years. Leasehold improvements are amortized over the term of their associated leases, excluding options to renew, since such leases generally do not carry prohibitive penalties for non-renewal. We capitalize expenditures that significantly increase the life of our assets and expense the costs of maintenance and repairs.
We review property and equipment for impairment whenever events or changes in circumstances indicate that the carrying amount of an asset may not be recoverable. If this review indicates that such assets are considered to be impaired, the impairment is recognized in the period the changes occur and represents the amount by which the carrying value exceeds the fair value of the asset.
Certain costs related to the development or purchase of internal-use software are capitalized. Internal-use software costs that are incurred in the preliminary project stage are expensed as incurred. Significant direct consulting costs and certain payroll and related costs, which are incurred during the development stage of a project are generally capitalized and amortized over a three-year period (except for enterprise software development platforms, which range from three to seven years) when placed into production.
Goodwill and Other Intangible Assets
Our acquisitions require the application of purchase accounting, which results in tangible and identifiable intangible assets and liabilities of the acquired entity being recorded at fair value. The difference between the purchase price and the fair value of net assets acquired is recorded as goodwill. The majority of our goodwill balance has resulted from our acquisition of CBRE Services, Inc. (CBRE Services) in 2001 (the 2001 Acquisition), our acquisition of Insignia Financial Group, Inc. (Insignia) in 2003 (the Insignia Acquisition), our acquisition of the Trammell Crow Company in 2006 (the Trammell Crow Company Acquisition), our acquisition of substantially all of the ING Group N.V. (ING) Real Estate Investment Management (REIM) operations in Europe and Asia, as well as substantially all of Clarion Real Estate Securities (CRES) in 2011 (collectively referred to as the REIM Acquisitions), our acquisition of Norland Managed Services Ltd (Norland) in 2013 (the Norland Acquisition) and our acquisition of Johnson Controls, Inc. (JCI)’s Global Workplace Solutions (JCI-GWS) business in 2015. Other intangible assets that have indefinite estimated useful lives that are not being amortized include certain management contracts identified in the REIM Acquisitions, a trademark, which was separately identified as a result of the 2001 Acquisition, as well as a trade name separately identified as a result of the REIM Acquisitions. The remaining other intangible assets primarily include customer relationships, mortgage servicing rights, trademarks, management contracts and covenants not to compete, which are all being amortized over estimated useful lives ranging up to 20 years.
66
CBRE GROUP, INC.
NOTES TO CONSOLIDATED FINANCIAL STATEMENTS—(Continued)
We are required to test goodwill and other intangible assets deemed to have indefinite useful lives for impairment at least annually, or more often if circumstances or events indicate a change in the impairment status. The goodwill impairment analysis is a two-step process. The first step used to identify potential impairment involves comparing each reporting unit’s estimated fair value to its carrying value, including goodwill. We use a discounted cash flow approach to estimate the fair value of our reporting units. Management’s judgment is required in developing the assumptions for the discounted cash flow model. These assumptions include revenue growth rates, profit margin percentages, discount rates, etc. If the estimated fair value of a reporting unit exceeds its carrying value, goodwill is considered not to be impaired. If the carrying value exceeds estimated fair value, there is an indication of potential impairment and the second step is performed to measure the amount of impairment. The second step of the process involves the calculation of an implied fair value of goodwill for each reporting unit for which step one indicated impairment. The implied fair value of goodwill is determined by measuring the excess of the estimated fair value of the reporting unit as calculated in step one, over the estimated fair values of the individual assets, liabilities and identifiable intangibles as if the reporting unit was being acquired in a business combination. Due to the many variables inherent in the estimation of a business’s fair value and the relative size of our goodwill, if different assumptions and estimates were used, it could have an adverse effect on our impairment analysis.
Deferred Financing Costs
Costs incurred in connection with financing activities are generally deferred and amortized over the terms of the related debt agreements ranging up to ten years. Debt issuance costs related to a recognized debt liability are presented in the accompanying consolidated balance sheets as a direct deduction from the carrying amount of that debt liability. Amortization of these costs is charged to interest expense in the accompanying consolidated statements of operations. Accounting Standards Update (ASU) 2015-15, “Interest—Imputation of Interest (Subtopic 835-30): Presentation and Subsequent Measurement of Debt Issuance Costs Associated with Line-of-Credit Arrangements” permits classifying debt issuance costs associated with a line of credit arrangement as an asset, regardless of whether there are any outstanding borrowings on the arrangement. Total deferred financing costs, net of accumulated amortization, related to our revolving line of credit have been included in other assets in the accompanying consolidated balance sheets and were $23.0 million and $22.2 million as of December 31, 2017 and 2016, respectively.
During 2017, we entered into a new credit agreement providing for a $750.0 million delayed draw tranche A term loan facility and a $2.8 billion revolving credit facility. During the year ended December 31, 2017, in connection with these financing activities, we incurred approximately $8.0 million of financing costs.
On March 21, 2016, we executed an amendment to our 2015 amended and restated credit agreement which, among other things, extended the maturity on our revolving credit facility and increased the borrowing capacity under our revolving credit facility. In connection with this amendment, we incurred approximately $5.4 million of financing costs.
During 2015, we entered into our 2015 amended and restated credit agreement providing for a $500.0 million tranche A term loan facility and a $2.6 billion revolving credit facility. In addition, we added new tranche B-1 and tranche B-2 term loan facilities under this same credit facility pursuant to which we borrowed an additional $400.0 million in aggregate principal amount. During the year ended December 31, 2015, in connection with these financing activities, we incurred approximately $21.7 million of financing costs, of which $1.0 million was expensed. In addition, we expensed $1.7 million of previously-deferred financing costs. All of these write-offs were included in write-off of financing costs on extinguished debt in the accompanying consolidated statements of operations.
See Note 11 for additional information on activities associated with our debt.
67
CBRE GROUP, INC.
NOTES TO CONSOLIDATED FINANCIAL STATEMENTS—(Continued)
We record commission revenue on real estate sales generally upon close of escrow or transfer of title, except when future contingencies exist. Real estate commissions on leases are generally recorded in revenue when all obligations under the commission agreement are satisfied. Terms and conditions of a commission agreement may include, but are not limited to, execution of a signed lease agreement and future contingencies including tenant occupancy, payment of a deposit or payment of a first month’s rent (or a combination thereof). A commission agreement may provide that we earn a portion of a lease commission upon the execution of the lease agreement by the tenant and landlord, with the remaining portion(s) of the lease commission earned at a later date, usually upon tenant occupancy or payment of rent. The existence of any significant future contingencies results in the delay of recognition of corresponding revenue until such contingencies are satisfied. For example, if we do not earn all or a portion of the lease commission until the tenant pays its first month’s rent, and the lease agreement provides the tenant with a free rent period, we delay revenue recognition until rent is paid by the tenant. As some of these conditions are outside of our control and are often not clearly defined, judgment must be exercised in determining when such required events have occurred in order to recognize revenue.
Property and facilities management revenues are generally based on measures consistent with the terms of the customer contracts. These contracts are negotiated utilizing a variety of terms covering various lengths of time. The fees are recognized when earned under the provisions of the related agreements. We also may earn revenue based on certain qualitative and quantitative performance measures. We recognize this revenue when the performance has been completed, the measure has been calculated and fees are deemed collectible.
Our clients reimburse us for certain expenses incurred on their behalf, primarily in our property and facilities management operations. Our treatment of these reimbursements is based upon the terms of the underlying contract. We use certain indicators as to whether we record the reimbursements on a gross versus net basis, such as whether we are the primary obligor on the contracts, whether the contract is based on a fixed fee, credit risk and our discretion in making vendor selections and establishing prices.
In certain instances, we have determined we are acting as the principal in the transaction and, accordingly, report these reimbursements as revenue on a gross basis with the total costs reflected in cost of services. Reimbursement revenue is recognized when the underlying reimbursable costs are incurred. When we determine we are not the primary obligor and are acting as an agent, we account for the transaction on a net basis.
Investment management fees are based predominantly upon a percentage of the equity deployed on behalf of our limited partners. Fees related to our indirect investment management programs are based upon a percentage of the fair value of those investments. These fees are recognized when earned under the provisions of the related investment management agreements. Our Global Investment Management segment earns performance-based incentive fees with regard to many of its investments. Such revenue is recognized at the end of the measurement periods when the conditions of the applicable incentive fee arrangements have been satisfied and following the expiration of any potential claw back provision. With many of these investments, our Global Investment Management professionals have participation interests in such incentive fees, which are commonly referred to as carried interest. This carried interest expense is generally accrued for based upon the probability of such performance-based incentive fees being earned over the related vesting period. In addition, our Global Investment Management segment also earns success-based transaction fees with regard to buying or selling properties on behalf of certain funds and separate accounts. Such revenue is recognized at the completion of a successful transaction and is not subject to any claw back provision.
Appraisal fees are recorded after services have been rendered. Loan origination fees are recognized at the time a loan closes and we have no significant remaining obligations for performance in connection with the transaction, while loan servicing fees are recorded in revenue as monthly principal and interest payments are collected from mortgagors. Other commissions, consulting fees and referral fees are recorded as revenue at the time the related services have been performed, unless future contingencies exist.
68
CBRE GROUP, INC.
NOTES TO CONSOLIDATED FINANCIAL STATEMENTS—(Continued)
Development services and project management services generate fees from development and construction management projects. Most development and construction management and project management assignments are subject to agreements that describe the calculation of fees and when we earn such fees. The earnings terms of these agreements dictate when we recognize the related revenue. Generally, development fees are recognized based on the lower of the amount billed or the amount determined on a straight-line basis over the development period. We may earn incentive fees for project management services based upon achievement of certain performance criteria as set forth in the project management services agreement. Incentive development fees are recognized when quantitative criteria have been met (such as specified leasing, budget or time-based targets) or for those incentive fees based on qualitative criteria, upon approval of the fee by our clients. Certain incentive development fees allow us to share in the fair value of the developed real estate asset above cost. This sharing creates additional revenue potential to us with no exposure to loss other than opportunity cost. We recognize such fees when the specified target is attained and fees are deemed collectible.
We record deferred income to the extent that cash payments have been received in accordance with the terms of underlying agreements, but such amounts have not yet met the criteria for revenue recognition in accordance with generally accepted accounting principles. We recognize such revenues when the appropriate criteria are met.
In establishing the appropriate provisions for trade receivables, we make assumptions with respect to future collectability. Our assumptions are based on an assessment of a customer’s credit quality as well as subjective factors and trends, including the aging of receivables balances. In addition to these assessments, in general, outstanding trade accounts receivable amounts that are more than 180 days overdue are evaluated for collectability and fully provided for if deemed uncollectible. Historically, our credit losses have generally been insignificant. However, estimating losses requires significant judgment, and conditions may change or new information may become known after any periodic evaluation. As a result, actual credit losses may differ from our estimates.
Business Promotion and Advertising Costs
The costs of business promotion and advertising are expensed as incurred. Business promotion and advertising costs of $63.1 million, $65.8 million and $62.7 million were included in operating, administrative and other expenses for the years ended December 31, 2017, 2016 and 2015, respectively.
Foreign Currencies
The financial statements of subsidiaries located outside the U.S. are generally measured using the local currency as the functional currency. The assets and liabilities of these subsidiaries are translated at the rates of exchange at the balance sheet date, and income and expenses are translated at the average monthly rate. The resulting translation adjustments are included in the accumulated other comprehensive loss component of equity. Gains and losses resulting from foreign currency transactions are included in the results of operations.
Derivative Financial Instruments and Hedging Activities
As required by FASB ASC Topic 815 “Derivatives and Hedging,” we record all derivatives on the balance sheet at fair value. We do not net derivatives on our balance sheet. The accounting for changes in the fair value of derivatives depends on the intended use of the derivative, whether we have elected to designate a derivative in a hedging relationship and apply hedge accounting and whether the hedging relationship has satisfied the criteria necessary to apply hedge accounting. Derivatives designated and qualifying as a hedge of the exposure to changes in the fair value of an asset, liability, or firm commitment attributable to a particular risk, such as interest rate risk, are considered fair value hedges. Derivatives designated and qualifying as a hedge of the exposure to variability in expected future cash flows, or other types of forecasted transactions, are considered cash flow hedges. Derivatives may also be designated as hedges of the foreign currency exposure of a net investment in a foreign operation. Hedge accounting generally provides for the matching of the timing of gain or loss recognition on the hedging instrument with the recognition of the changes in the fair value of the hedged asset or liability that are attributable to the hedged risk in a fair value hedge or the earnings effect of the hedged forecasted transactions in a cash flow hedge. We may enter into derivative contracts that are intended to economically hedge certain of our risk, even though hedge accounting does not apply or we elect not to apply hedge accounting. In all cases, we view derivative financial instruments as a risk management tool and, accordingly, do not use derivatives for trading or speculative purposes.
69
CBRE GROUP, INC.
NOTES TO CONSOLIDATED FINANCIAL STATEMENTS—(Continued)
Comprehensive income consists of net income and other comprehensive income (loss). In the accompanying consolidated balance sheets, accumulated other comprehensive loss consists of foreign currency translation adjustments, fees associated with the termination of interest rate swaps, unrealized gains (losses) on interest rate swaps, unrealized holding gains (losses) on available for sale securities and pension liability adjustments. Foreign currency translation adjustments exclude any income tax effect given that earnings of non-U.S. subsidiaries are deemed to be reinvested for an indefinite period of time (see Note 14).
We account for investments in marketable debt and equity securities in accordance with the “Investments – Debt and Equity Securities” Topic of the FASB ASC (Topic 320). We determine the appropriate classification of debt and equity securities at the time of purchase and reevaluate such designation as of each balance sheet date. Marketable securities we acquire with the intent to generate a profit from short-term movements in market prices are classified as trading securities. Debt securities are classified as held to maturity when we have the positive intent and ability to hold the securities to maturity. Marketable equity and debt securities not classified as trading or held to maturity are classified as available for sale.
Trading securities are carried at their fair value with realized and unrealized gains and losses included in net income. Available for sale securities are carried at their fair value and any difference between cost and fair value is recorded as unrealized gain or loss, net of income taxes, and is reported as accumulated other comprehensive loss in the consolidated statement of equity. Premiums and discounts are recognized in interest using the effective interest method. Realized gains and losses and declines in value expected to be other-than-temporary on available for sale securities have not been significant. The cost of securities sold is based on the specific identification method. Interest and dividends on securities classified as available for sale are included in interest income.
For investments classified as available for sale, we assess impairment at the individual security level. An investment is impaired if the fair value of the investment is less than its amortized cost basis. When an impairment exists, we assess whether such impairment is temporary or other-than-temporary. We review the volatility and intended holding period of our investments and also determine if we believe that there is a reasonable possibility that the value would be recovered over the intended holding period. Based on our review, we did not record any significant other-than-temporary impairment losses during the years ending December 31, 2017, 2016 and 2015.
Warehouse Receivables
Our wholly-owned subsidiary CBRE Capital Markets, Inc. (CBRE Capital Markets) is a Federal Home Loan Mortgage Corporation (Freddie Mac) approved Multifamily Program Plus Seller/Servicer and an approved Federal National Mortgage Association (Fannie Mae) Aggregation and Negotiated Transaction Seller/Servicer. In addition, CBRE Capital Markets’ wholly-owned subsidiary CBRE Multifamily Capital, Inc. (CBRE MCI) is an approved Fannie Mae Delegated Underwriting and Servicing (DUS) Seller/Servicer and CBRE Capital Markets’ wholly-owned subsidiary CBRE HMF is a U.S. Department of Housing and Urban Development (HUD) approved Non-Supervised Federal Housing Authority (FHA) Title II Mortgagee, an approved Multifamily Accelerated Processing (MAP) lender and an approved Government National Mortgage Association (Ginnie Mae) issuer of mortgage-backed securities (MBS). Under these arrangements, before loans are originated through proceeds from warehouse lines of credit, we obtain either a contractual loan purchase commitment from either Freddie Mac or Fannie Mae or a confirmed forward trade commitment for the issuance and purchase of a Fannie Mae or Ginnie Mae MBS that will be secured by the loans. The warehouse lines of credit are generally repaid within a one-month period when Freddie Mac or Fannie Mae buys the loans or upon settlement of the Fannie Mae or Ginnie Mae MBS, while we retain the servicing rights. Loans are funded at the prevailing market rates. We elect the fair value option for all warehouse receivables. At December 31, 2017 and 2016, all of the warehouse receivables included in the accompanying consolidated balance sheets were either under commitment to be purchased by Freddie Mac or had confirmed forward trade commitments for the issuance and purchase of Fannie Mae or Ginnie Mae mortgage-backed securities that will be secured by the underlying loans.
70
CBRE GROUP, INC.
NOTES TO CONSOLIDATED FINANCIAL STATEMENTS—(Continued)
In connection with the origination and sale of mortgage loans with servicing rights retained, we record servicing assets or liabilities based on the fair value of the mortgage servicing rights on the date the loans are sold. Our mortgage service rights (MSRs) are initially recorded at fair value. Subsequent to the initial recording, MSRs are amortized and carried at the lower of amortized cost or fair value in other intangible assets in the accompanying consolidated balance sheets. They are amortized in proportion to and over the estimated period that net servicing income is expected to be received based on projections and timing of estimated future net cash flows.
Our initial recording of MSRs at their fair value resulted in net gains, as the fair value of servicing contracts that result in MSR assets exceeded the fair value of servicing contracts that result in MSR liabilities. The net assets and net gains are presented in the accompanying consolidated financial statements. The amount of MSRs recognized during the years ended December 31, 2017 and 2016 was as follows (dollars in thousands):
|
|
|
Year Ended December 31, |
|
|||||
|
|
|
|
2017 |
|
|
|
2016 |
|
|
Beginning balance, mortgage servicing rights |
|
$ |
320,524 |
|
|
$ |
244,723 |
|
|
Mortgage servicing rights recognized |
|
|
145,103 |
|
|
|
154,040 |
|
|
Mortgage servicing rights sold |
|
|
(71 |
) |
|
|
(790 |
) |
|
Amortization expense |
|
|
(98,559 |
) |
|
|
(73,273 |
) |
|
Other |
|
|
6,134 |
|
|
|
(4,176 |
) |
|
Ending balance, mortgage servicing rights |
|
$ |
373,131 |
|
|
$ |
320,524 |
|
MSRs do not actively trade in an open market with readily available observable prices; therefore, fair value is determined based on certain assumptions and judgments, including the estimation of the present value of future cash flows realized from servicing the underlying mortgage loans. Management’s assumptions include the benefits of servicing (servicing fee income and interest on escrow deposits), inflation, the cost of servicing, prepayment rates, delinquencies, discount rates and the estimated life of servicing cash flows. The assumptions used are subject to change based on management’s judgments and estimates of changes in future cash flows and interest rates, among other things. The key assumptions used during the years ended December 31, 2017, 2016 and 2015 in measuring fair value were as follows:
|
|
|
Year Ended December 31, |
|
|||||||||
|
|
|
2017 |
|
|
|
2016 |
|
|
|
2015 |
|
|
|
Discount rate |
|
|
10.06 |
% |
|
|
10.16 |
% |
|
|
10.11 |
% |
|
Conditional prepayment rate |
|
|
8.88 |
% |
|
|
9.66 |
% |
|
|
6.03 |
% |
The estimated fair value of our MSRs was $446.3 million and $375.5 million as of December 31, 2017 and 2016, respectively. Impairment is evaluated through a comparison of the carrying amount and fair value of the MSRs, and recognized with the establishment of a valuation allowance. We did not incur any impairment charges related to our MSRs during the years ended December 31, 2017, 2016 or 2015. No valuation allowance was created previously and we did not record a valuation allowance for MSRs in 2017 or 2016.
Included in revenue in the accompanying consolidated statements of operations are contractually specified servicing fees from loans serviced for others of $144.2 million, $115.3 million and $92.0 million for the years ended December 31, 2017, 2016 and 2015, respectively, and prepayment fees/late fees/ancillary income earned from loans serviced for others of $13.2 million, $7.2 million and $8.4 million for the years ended December 31, 2017, 2016 and 2015, respectively.
71
CBRE GROUP, INC.
NOTES TO CONSOLIDATED FINANCIAL STATEMENTS—(Continued)
As part of our recruitment efforts relative to new U.S. brokers, we offer a transitional broker draw arrangement. Our broker draw arrangements generally last until such time as a broker’s pipeline of business is sufficient to allow him or her to earn sustainable commissions. This program is intended to provide the broker with a minimal amount of cash flow to allow adequate time for his or her training as well as time for him or her to develop business relationships. Similar to traditional salaries, the broker draws are paid irrespective of the actual revenues generated by the broker. Often these broker draws represent the only form of compensation received by the broker. Furthermore, it is not our general policy to pursue collection of unearned broker draws paid under this arrangement. As a result, we have concluded that broker draws are economically equivalent to salaries paid and accordingly charge them to compensation expense as incurred. The broker is also entitled to earn a commission on completed revenue transactions. This amount is calculated as the commission that would have been payable under our full commission program, less any amounts previously paid to the broker in the form of a draw.
Stock-Based Compensation
We account for all employee awards under the fair value recognition provisions of the “Compensation – Stock Compensation” Topic of the FASB ASC (Topic 718). Topic 718 requires the measurement of compensation cost at the grant date, based upon the estimated fair value of the award, and requires amortization of the related expense over the employee’s requisite service period.
In the third quarter of 2016, we elected to early adopt the provisions of ASU 2016-09, “Compensation - Stock Compensation (Topic 718): Improvements to Employee Share-Based Payment Accounting,” which required us to reflect any adjustments as of January 1, 2016. ASU 2016-09 permitted companies to make an accounting policy election to either estimate forfeitures on share-based payment awards, as previously required, or to recognize forfeitures as they occur. We elected to change our accounting policy to recognize forfeitures when they occur and the impact of this change in accounting policy was recorded as a $3.3 million cumulative effect adjustment to accumulated earnings as of January 1, 2016.
See Note 13 for additional information on our stock-based compensation plans.
Income Per Share
Basic income per share attributable to CBRE Group, Inc. is computed by dividing net income attributable to CBRE Group, Inc. shareholders by the weighted average number of common shares outstanding during each period. The computation of diluted income per share attributable to CBRE Group, Inc. generally further assumes the dilutive effect of potential common shares, which include stock options and certain contingently issuable shares. Contingently issuable shares consist of non-vested stock awards.
Income Taxes
Income taxes are accounted for under the asset and liability method in accordance with the “Accounting for Income Taxes” Topic of the FASB ASC (Topic 740). Deferred tax assets and liabilities are determined based on temporary differences between the financial reporting and tax basis of assets and liabilities and operating loss and tax credit carry forwards. Deferred tax assets and liabilities are measured by applying enacted tax rates and laws and are released in the years in which the temporary differences are expected to be recovered or settled. The effect on deferred tax assets and liabilities of a change in tax rates is recognized in income in the period that includes the enactment date. Valuation allowances are provided against deferred tax assets when it is more likely than not that some portion or all of the deferred tax asset will not be realized.
See Note 14 for additional information on income taxes, including a discussion of the impact of the Tax Cuts and Jobs Act (the Tax Act), which was signed into law on December 22, 2017.
72
CBRE GROUP, INC.
NOTES TO CONSOLIDATED FINANCIAL STATEMENTS—(Continued)
Our wholly-owned captive insurance company, which is subject to applicable insurance rules and regulations, insures our exposure related to workers’ compensation insurance, general liability insurance and automotive insurance for our U.S. operations risk on a primary basis and we purchase excess coverage from unrelated insurance carriers. The captive insurance company also insures primary risk relating to professional indemnity claims globally. Given the nature of these types of claims, it may take several years for resolution and determination of the cost of these claims. We are required to estimate the cost of these claims in our financial statements.
The estimates that we utilize to record our potential losses on claims are inherently subjective, and actual claims could differ from amounts recorded, which could result in increased or decreased expense in future periods. As of December 31, 2017 and 2016, our reserves for claims under these insurance programs were $93.7 million and $80.6 million, respectively, of which $2.8 million and $1.7 million, respectively, represented our estimated current liabilities.
New Accounting Pronouncements
Recent Accounting Pronouncements Pending Adoption
The FASB has recently issued five ASUs related to revenue recognition (“new revenue recognition guidance”), all of which will become effective for the company on January 1, 2018. The ASUs issued are: (1) in May 2014, ASU 2014-09, “Revenue from Contracts with Customers (Topic 606);” (2) in March 2016, ASU 2016-08, “Revenue from Contracts with Customers (Topic 606): Principal versus Agent Considerations (Reporting Revenue Gross versus Net);” (3) in April 2016, ASU 2016-10, “Revenue from Contracts with Customers (Topic 606): Identifying Performance Obligations and Licensing;” (4) in May 2016, ASU 2016-12, “Revenue from Contracts with Customers (Topic 606): Narrow-scope Improvements and Practical Expedients;” and (5) in December 2016, ASU 2016-20, “Technical Corrections and Improvements to Topic 606, Revenue From Contracts with Customers.” ASU 2014-09 requires an entity to recognize the amount of revenue to which it expects to be entitled for the transfer of promised goods or services to customers and will replace most existing revenue recognition guidance under GAAP. The ASU also requires entities to disclose both quantitative and qualitative information to enable users of financial statements to understand the nature, amount, timing and uncertainty of revenue and cash flows arising from contracts with customers. This ASU permits the use of either the retrospective or cumulative effect transition method. ASU 2016-08 clarifies the implementation guidance on principal versus agent considerations. ASU 2016-10 clarifies guidance related to identifying performance obligations and licensing implementation guidance contained in ASU 2014-09. ASU 2016-12 clarifies guidance in certain narrow areas and adds some practical expedients. ASU 2016-20 also clarifies guidance in certain narrow areas and adds optional exemptions to certain disclosure requirements.
We plan to adopt the new revenue recognition guidance in the first quarter of 2018 using the retrospective transition method. Based on our assessment, the impact of the application of the new revenue recognition guidance will result in an acceleration of some revenues that are based, in part, on future contingent events. For example, some leasing commission revenues in various countries where we operate will be recognized earlier. Under current GAAP, a portion of these lease commission revenues are deferred until a future contingency is resolved (e.g., tenant move-in or payment of first month’s rent). Under the new revenue guidance, the company’s performance obligation will be typically satisfied at lease signing and therefore the portion of the commission that is contingent on a future event will likely be recognized earlier if deemed not subject to significant reversal. We expect the earlier recognition of these revenues to result in an increase in total assets and liabilities to reflect contract assets and accrued commissions payable.
We have evaluated the impact of the updated principal versus agent guidance on our consolidated financial statements. Under existing GAAP, certain of our facilities and project management contracts are accounted for on a net basis because the contracts include provisions such as “pay when paid” that mitigate payment risk with respect to services provided by third parties to our clients. Under the updated guidance, control of the services before transfer to the client is the primary factor in determining principal versus agent assessments. Payment risk will no longer be a determining factor under ASC Topic 606. Based on our evaluation of the updated guidance, we have determined that we control the services provided by third parties on behalf of certain of our facilities and project
73
CBRE GROUP, INC.
NOTES TO CONSOLIDATED FINANCIAL STATEMENTS—(Continued)
management clients. Accordingly, under the new guidance, we will account for the cost of services provided by third parties and the related reimbursement revenue on a gross basis. Under the retrospective method, based upon our evaluations which are not yet complete, we estimate that the 2016 and 2017 consolidated statements of operations will reflect approximately $4 to $5 billion of additional revenue and cost of services as a result of this change, with no impact on profitability.
In January 2016, the FASB issued ASU 2016-01, “Financial Instruments – Overall (Subtopic 825-10): Recognition and Measurement of Financial Assets and Financial Liabilities.” This ASU will significantly change the income statement impact of equity investments and the recognition of changes in fair value of financial liabilities when the fair value option is elected. This ASU is effective for fiscal years, and interim periods within those years, beginning after December 15, 2017. Early adoption is not permitted, except for the provisions related to the recognition of changes in fair value of financial liabilities when the fair value option is elected. We do not believe the adoption of ASU 2016-01 will have a material impact on our consolidated financial statements and related disclosures.
In February 2016, the FASB issued ASU 2016-02, “Leases (Topic 842).” This ASU requires lessees to recognize most leases on the balance sheet as liabilities, with corresponding right-of-use assets. For income statement recognition purposes, leases will be classified as either a finance or operating lease in a manner similar to the requirements under the current lease accounting literature, but without relying upon the bright-line tests. This ASU is effective for annual periods in fiscal years beginning after December 15, 2018 and mandates a modified retrospective transition method for all entities. We plan to adopt ASU 2016-02 in the first quarter of 2019 and are currently continuing to evaluate the magnitude of its impact on our consolidated financial statements by reviewing our existing lease contracts and service contracts that may include embedded leases.
In June 2016, the FASB issued ASU 2016-13, “Financial Instruments – Credit Losses (Topic 326): Measurement of Credit Losses on Financial Instruments.” This ASU is intended to improve financial reporting by requiring timelier recording of credit losses on loans and other financial instruments held by financial institutions and other organizations. This ASU is effective for fiscal years beginning after December 15, 2019, and interim periods within those years, with early adoption permitted. We are evaluating the effect that ASU 2016-13 will have on our consolidated financial statements and related disclosures.
In August 2016, the FASB issued ASU 2016-15, “Statement of Cash Flows (Topic 230): Classification of Certain Cash Receipts and Cash Payments.” This ASU addresses eight specific cash flow issues with the objective of reducing the existing diversity in practice. This ASU is effective for fiscal years beginning after December 15, 2017, and interim periods within those years, with early adoption permitted. At this point in time, we do not believe the adoption of ASU 2016-15 will have a material impact on our consolidated financial statements and related disclosures.
In October 2016, the FASB issued ASU 2016-16, “Income Taxes (Topic 740): Intra-Entity Transfers of Assets Other Than Inventory.” This ASU requires an entity to recognize the income tax consequences of an intra-entity transfer of an asset other than inventory when the transfer occurs. This ASU is effective for fiscal years beginning after December 15, 2017, and interim periods within those years, with early adoption permitted. At this point in time, we do not believe the adoption of ASU 2016-16 will have a material impact on our consolidated financial statements and related disclosures.
In November 2016, the FASB issued ASU 2016-18, “Statement of Cash Flows (Topic 230): Restricted Cash.” This ASU requires that a statement of cash flows explain the change during the period in the total of cash, cash equivalents, and amounts generally described as restricted cash or restricted cash equivalents. As a result, amounts generally described as restricted cash and restricted cash equivalents should be included with cash and cash equivalents when reconciling the beginning-of-period and end-of-period total amounts shown on the statement of cash flows. This ASU is effective for fiscal years beginning after December 15, 2017, and interim periods within those years, with early adoption permitted. At this point in time, we do not believe the adoption of ASU 2016-18 will have a material impact on our consolidated financial statements and related disclosures.
74
CBRE GROUP, INC.
NOTES TO CONSOLIDATED FINANCIAL STATEMENTS—(Continued)
In January 2017, the FASB issued ASU 2017-04, “Intangibles – Goodwill and Other (Topic 350): Simplifying the Test for Goodwill Impairment.” This ASU eliminates Step 2 from the goodwill impairment test. This ASU also eliminates the requirements for any reporting unit with a zero or negative carrying amount to perform a qualitative assessment. This ASU is effective for fiscal years beginning after December 15, 2019, and interim periods within those years, with early adoption permitted. We are evaluating the effect that ASU 2017-04 will have on our goodwill assessment process, but do not believe the adoption of ASU 2017-04 will have a material impact on our consolidated financial statements and related disclosures.
In February 2017, the FASB issued ASU 2017-05, “Other Income – Gains and Losses from the Derecognition of Nonfinancial Assets (Subtopic 610-20): Clarifying the Scope of Asset Derecognition Guidance and Accounting for Partial Sales of Nonfinancial Assets.” This ASU clarifies that a financial asset is within the scope of Subtopic 610-20 if it meets the definition of an in substance nonfinancial asset and also defines the term in substance nonfinancial asset. This ASU is effective for fiscal years beginning after December 15, 2017, and interim periods within those years. At this point in time, we do not believe the adoption of ASU 2017-05 will have a material impact on our consolidated financial statements and related disclosures.
In March 2017, the FASB issued ASU 2017-08, “Receivables – Nonrefundable Fees and Other Costs (Subtopic 310-20), Premium Amortization on Purchased Callable Debt Securities.” This ASU requires the premium to be amortized to the earliest call date. This ASU does not require an accounting change for securities held at a discount; the discount continues to be amortized to maturity. This ASU is effective for fiscal years beginning after December 15, 2018, and interim periods within those years, with early adoption permitted. We are evaluating the effect that ASU 2017-08 will have on our consolidated financial statements and related disclosures.
In August 2017, the FASB issued ASU 2017-12, “Derivatives and Hedging (Topic 815): Targeted Improvements to Accounting for Hedging Activities.” This ASU refines and expands hedge accounting for both financial and commodity risks. This ASU is effective for fiscal years beginning after December 15, 2018, and interim periods within those years, with early adoption permitted. We are evaluating the effect that ASU 2017-12 will have on our consolidated financial statements and related disclosures.
Reclassifications
Certain reclassifications have been made to the 2016 and 2015 financial statements to conform with the 2017 presentation.
|
3. |
Acquisition of Global Workplace Solutions (GWS) |
On September 1, 2015, CBRE, Inc., our wholly-owned subsidiary, pursuant to a Stock and Asset Purchase Agreement with JCI, acquired JCI’s GWS business (we refer to as the GWS Acquisition). The acquired JCI-GWS business was a market-leading provider of integrated facilities management solutions for major occupiers of commercial real estate and had significant operations around the world. The purchase price was $1.475 billion, paid in cash, plus adjustments totaling $46.5 million for working capital and other items. We completed the GWS Acquisition in order to advance our strategy of delivering globally integrated services to major occupiers in our Americas, EMEA and Asia Pacific segments. We merged the acquired JCI-GWS business with our existing occupier outsourcing business line, and the new combined business adopted the “Global Workplace Solutions” name.
We financed the transaction with: (i) an issuance in August 2015 of $600.0 million in aggregate principal amount of 4.875% senior notes due March 1, 2026; (ii) borrowings in September 2015 of $400.0 million in aggregate principal amount of tranche B-1 and tranche B-2 term loan facilities under our amended and restated credit agreement dated January 9, 2015 (2015 Credit Agreement); (iii) borrowings under the revolving credit facility under the 2015 Credit Agreement; and (iv) cash on hand. See Note 11 for more information on the abovementioned debt instruments.
The accompanying consolidated statement of operations for the year ended December 31, 2015 included revenue, operating income and net income of $982.0 million, $27.7 million and $18.8 million, respectively, attributable to the GWS Acquisition. This does not include direct transaction and integration costs of $48.9 million
75
CBRE GROUP, INC.
NOTES TO CONSOLIDATED FINANCIAL STATEMENTS—(Continued)
and amortization expense related to intangible assets acquired of $24.2 million, all of which were incurred during the year ended December 31, 2015 in connection with the GWS Acquisition.
Unaudited pro forma results, assuming the GWS Acquisition had occurred as of January 1, 2015 for purposes of the 2015 pro forma disclosures, are presented below. They include certain adjustments for the year ended December 31, 2015, including $47.5 million of increased amortization expense as a result of intangible assets acquired in the GWS Acquisition, $23.9 million of additional interest expense as a result of debt incurred to finance the GWS Acquisition, the removal of $48.9 million of direct costs incurred by us related to the GWS Acquisition, and the tax impact for the year ended December 31, 2015 of these pro forma adjustments.
These pro forma results have been prepared for comparative purposes only and do not purport to be indicative of what operating results would have been had the GWS Acquisition occurred on January 1, 2015 and may not be indicative of future operating results (dollars in thousands, except share data):
|
|
|
|
2015 |
|
|
Revenue |
|
$ |
12,972,810 |
|
|
Operating income |
|
$ |
902,612 |
|
|
Net income attributable to CBRE Group, Inc. |
|
$ |
580,928 |
|
|
Basic income per share: |
|
|
|
|
|
Net income per share attributable to CBRE Group, Inc. |
|
$ |
1.75 |
|
|
Weighted average shares outstanding for basic income per share |
|
|
332,616,301 |
|
|
Diluted income per share: |
|
|
|
|
|
Net income per share attributable to CBRE Group, Inc. |
|
$ |
1.73 |
|
|
Weighted average shares outstanding for diluted income per share |
|
|
336,414,856 |
|
|
4. |
Warehouse Receivables & Warehouse Lines of Credit |
A rollforward of our warehouse receivables is as follows (dollars in thousands):
|
Beginning balance at January 1, 2017 |
|
$ |
1,276,047 |
|
|
Origination of mortgage loans |
|
|
17,655,104 |
|
|
Gains (premiums on loan sales) |
|
|
52,742 |
|
|
Sale of mortgage loans |
|
|
(18,000,014 |
) |
|
Cash collections of premiums on loan sales |
|
|
(52,742 |
) |
|
Proceeds from sale of mortgage loans |
|
|
(18,052,756 |
) |
|
Net decrease in mortgage servicing rights included in warehouse receivables |
|
|
(3,099 |
) |
|
Ending balance at December 31, 2017 |
|
$ |
928,038 |
|
76
CBRE GROUP, INC.
NOTES TO CONSOLIDATED FINANCIAL STATEMENTS—(Continued)
The following table is a summary of our warehouse lines of credit in place as of December 31, 2017 and 2016 (dollars in thousands):
|
|
|
|
|
|
|
December 31, 2017 |
|
|
December 31, 2016 |
|
||||||||||
|
|
|
|
|
|
|
Maximum |
|
|
|
|
|
|
Maximum |
|
|
|
|
|
||
|
Lender |
|
Current Maturity |
|
Pricing |
|
Facility Size |
|
|
Carrying Value |
|
|
Facility Size |
|
|
Carrying Value |
|
||||
|
JP Morgan Chase Bank, N.A. (JP Morgan) (1) |
|
2/28/2017 |
|
daily one-month LIBOR plus 1.45% |
|
$ |
— |
|
|
$ |
— |
|
|
$ |
300,000 |
|
|
$ |
275,945 |
|
|
JP Morgan |
|
10/23/2018 |
|
daily one-month LIBOR plus 1.45% |
|
|
1,000,000 |
|
|
|
192,180 |
|
|
|
700,000 |
|
|
|
— |
|
|
JP Morgan |
|
10/23/2018 |
|
daily one-month LIBOR plus 2.75% |
|
|
25,000 |
|
|
|
5,800 |
|
|
|
25,000 |
|
|
|
3,768 |
|
|
Bank of America, N.A. (BofA) (1) |
|
1/30/2017 |
|
daily one-month LIBOR plus 1.60% |
|
|
— |
|
|
|
— |
|
|
|
300,000 |
|
|
|
300,000 |
|
|
BofA (2) |
|
6/5/2018 |
|
daily one-month LIBOR plus 1.40% |
|
|
337,500 |
|
|
|
130,443 |
|
|
|
200,000 |
|
|
|
18,555 |
|
|
Fannie Mae Multifamily As Soon As Pooled Plus Agreement and Multifamily As Soon As Pooled Sale Agreement (ASAP) Program (1) |
|
1/17/2017 |
|
daily one-month LIBOR plus 1.35%, with a LIBOR floor of 0.35% |
|
|
— |
|
|
|
— |
|
|
|
200,000 |
|
|
|
200,000 |
|
|
Fannie Mae ASAP Program |
|
Cancelable anytime |
|
daily one-month LIBOR plus 1.35%, with a LIBOR floor of 0.35% |
|
|
450,000 |
|
|
|
205,827 |
|
|
|
450,000 |
|
|
|
111,160 |
|
|
TD Bank, N.A. (TD Bank) (1) |
|
2/28/2017 |
|
daily one-month LIBOR plus 1.35% |
|
|
— |
|
|
|
— |
|
|
|
375,000 |
|
|
|
154,032 |
|
|
TD Bank (3) |
|
6/30/2018 |
|
daily one-month LIBOR plus 1.25% |
|
|
800,000 |
|
|
|
225,416 |
|
|
|
400,000 |
|
|
|
— |
|
|
Capital One, N.A. (Capital One) (1) |
|
1/23/2017 |
|
daily one-month LIBOR plus 1.45% |
|
|
— |
|
|
|
— |
|
|
|
250,000 |
|
|
|
191,193 |
|
|
Capital One (4) |
|
7/27/2018 |
|
daily one-month LIBOR plus 1.40% |
|
|
387,500 |
|
|
|
151,100 |
|
|
|
200,000 |
|
|
|
— |
|
|
|
|
|
|
|
|
$ |
3,000,000 |
|
|
$ |
910,766 |
|
|
$ |
3,400,000 |
|
|
$ |
1,254,653 |
|
|
(1) |
Temporary facility to accommodate year-end volume. |
|
(2) |
Line was temporarily increased from $200.0 million to $337.5 million to accommodate year-end volume. Maximum facility reverted back to $200.0 million on January 27, 2018. |
|
(3) |
Line was temporarily increased from $400.0 million to $800.0 million to accommodate year-end volume. Maximum facility reverted back to $400.0 million on February 1, 2018. |
|
(4) |
Line was temporarily increased from $200.0 million to $387.5 million to accommodate year-end volume. Maximum facility reverted back to $200.0 million on January 9, 2018. |
During the year ended December 31, 2017, we had a maximum of $2.3 billion of warehouse lines of credit principal outstanding.
77
CBRE GROUP, INC.
NOTES TO CONSOLIDATED FINANCIAL STATEMENTS—(Continued)
We hold variable interests in certain VIEs in our Global Investment Management and Development Services segments which are not consolidated as it was determined that we are not the primary beneficiary. Our involvement with these entities is in the form of equity co-investments and fee arrangements.
As of December 31, 2017 and 2016, our maximum exposure to loss related to the VIEs which are not consolidated was as follows (dollars in thousands):
|
|
|
December 31, |
|
|||||
|
|
|
|
2017 |
|
|
|
2016 |
|
|
Investments in unconsolidated subsidiaries |
|
$ |
26,273 |
|
|
$ |
31,041 |
|
|
Other current assets |
|
|
3,401 |
|
|
|
3,314 |
|
|
Co-investment commitments |
|
|
2,364 |
|
|
|
168 |
|
|
Maximum exposure to loss |
|
$ |
32,038 |
|
|
$ |
34,523 |
|
|
6. |
Fair Value Measurements |
The “Fair Value Measurements and Disclosures” topic (Topic 820) of the FASB ASC defines fair value as the exchange price that would be received for an asset or paid to transfer a liability (an exit price) in the principal or most advantageous market for the asset or liability in an orderly transaction between market participants at the measurement date. Topic 820 also establishes a three-level fair value hierarchy that prioritizes the inputs used to measure fair value. This hierarchy requires entities to maximize the use of observable inputs and minimize the use of unobservable inputs. The three levels of inputs used to measure fair value are as follows:
|
|
• |
Level 1 – Quoted prices in active markets for identical assets or liabilities. |
|
|
• |
Level 2 – Observable inputs other than quoted prices included in Level 1, such as quoted prices for similar assets and liabilities in active markets; quoted prices for identical or similar assets and liabilities in markets that are not active; or other inputs that are observable or can be corroborated by observable market data. |
|
|
• |
Level 3 – Unobservable inputs that are supported by little or no market activity and that are significant to the fair value of the assets or liabilities. This includes certain pricing models, discounted cash flow methodologies and similar techniques that use significant unobservable inputs. |
There were no significant transfers in or out of Level 1 and Level 2 during the years ended December 31, 2017 and 2016.
78
CBRE GROUP, INC.
NOTES TO CONSOLIDATED FINANCIAL STATEMENTS—(Continued)
The following tables present the fair value of assets and liabilities measured at fair value on a recurring basis as of December 31, 2017 and 2016 (dollars in thousands):
|
|
|
As of December 31, 2017 |
|
|||||||||||||
|
|
|
Fair Value Measured and Recorded Using |
|
|
|
|
|
|||||||||
|
|
|
Level 1 |
|
|
Level 2 |
|
|
Level 3 |
|
|
Total |
|
||||
|
Assets |
|
|
|
|
|
|
|
|
|
|
|
|
|
|
|
|
|
Available for sale securities: |
|
|
|
|
|
|
|
|
|
|
|
|
|
|
|
|
|
Debt securities: |
|
|
|
|
|
|
|
|
|
|
|
|
|
|
|
|
|
U.S. treasury securities |
|
$ |
3,820 |
|
|
$ |
— |
|
|
$ |
— |
|
|
$ |
3,820 |
|
|
Debt securities issued by U.S. federal agencies |
|
|
— |
|
|
|
4,901 |
|
|
|
— |
|
|
|
4,901 |
|
|
Corporate debt securities |
|
|
— |
|
|
|
20,023 |
|
|
|
— |
|
|
|
20,023 |
|
|
Asset-backed securities |
|
|
— |
|
|
|
3,577 |
|
|
|
— |
|
|
|
3,577 |
|
|
Collateralized mortgage obligations |
|
|
— |
|
|
|
2,366 |
|
|
|
— |
|
|
|
2,366 |
|
|
Total debt securities |
|
|
3,820 |
|
|
|
30,867 |
|
|
|
— |
|
|
|
34,687 |
|
|
Equity securities |
|
|
29,758 |
|
|
|
— |
|
|
|
— |
|
|
|
29,758 |
|
|
Total available for sale securities |
|
|
33,578 |
|
|
|
30,867 |
|
|
|
— |
|
|
|
64,445 |
|
|
Trading securities |
|
|
103,837 |
|
|
|
— |
|
|
|
— |
|
|
|
103,837 |
|
|
Warehouse receivables |
|
|
— |
|
|
|
928,038 |
|
|
|
— |
|
|
|
928,038 |
|
|
Total assets at fair value |
|
$ |
137,415 |
|
|
$ |
958,905 |
|
|
$ |
— |
|
|
$ |
1,096,320 |
|
|
Liabilities |
|
|
|
|
|
|
|
|
|
|
|
|
|
|
|
|
|
Interest rate swaps |
|
$ |
— |
|
|
$ |
4,766 |
|
|
$ |
— |
|
|
$ |
4,766 |
|
|
Securities sold, not yet purchased |
|
|
3,431 |
|
|
|
— |
|
|
|
— |
|
|
|
3,431 |
|
|
Foreign currency exchange forward contracts |
|
|
— |
|
|
|
55 |
|
|
|
— |
|
|
|
55 |
|
|
Total liabilities at fair value |
|
$ |
3,431 |
|
|
$ |
4,821 |
|
|
$ |
— |
|
|
$ |
8,252 |
|
|
|
|
As of December 31, 2016 |
|
|||||||||||||
|
|
|
Fair Value Measured and Recorded Using |
|
|
|
|
|
|||||||||
|
|
|
Level 1 |
|
|
Level 2 |
|
|
Level 3 |
|
|
Total |
|
||||
|
Assets |
|
|
|
|
|
|
|
|
|
|
|
|
|
|
|
|
|
Available for sale securities: |
|
|
|
|
|
|
|
|
|
|
|
|
|
|
|
|
|
Debt securities: |
|
|
|
|
|
|
|
|
|
|
|
|
|
|
|
|
|
U.S. treasury securities |
|
$ |
8,485 |
|
|
$ |
— |
|
|
$ |
— |
|
|
$ |
8,485 |
|
|
Debt securities issued by U.S. federal agencies |
|
|
— |
|
|
|
5,046 |
|
|
|
— |
|
|
|
5,046 |
|
|
Corporate debt securities |
|
|
— |
|
|
|
17,094 |
|
|
|
— |
|
|
|
17,094 |
|
|
Asset-backed securities |
|
|
— |
|
|
|
2,695 |
|
|
|
— |
|
|
|
2,695 |
|
|
Collateralized mortgage obligations |
|
|
— |
|
|
|
1,010 |
|
|
|
— |
|
|
|
1,010 |
|
|
Total debt securities |
|
|
8,485 |
|
|
|
25,845 |
|
|
|
— |
|
|
|
34,330 |
|
|
Equity securities |
|
|
22,744 |
|
|
|
— |
|
|
|
— |
|
|
|
22,744 |
|
|
Total available for sale securities |
|
|
31,229 |
|
|
|
25,845 |
|
|
|
— |
|
|
|
57,074 |
|
|
Trading securities |
|
|
52,629 |
|
|
|
— |
|
|
|
— |
|
|
|
52,629 |
|
|
Warehouse receivables |
|
|
— |
|
|
|
1,276,047 |
|
|
|
— |
|
|
|
1,276,047 |
|
|
Foreign currency exchange forward contracts |
|
|
— |
|
|
|
1,471 |
|
|
|
— |
|
|
|
1,471 |
|
|
Total assets at fair value |
|
$ |
83,858 |
|
|
$ |
1,303,363 |
|
|
$ |
− |
|
|
$ |
1,387,221 |
|
|
Liabilities |
|
|
|
|
|
|
|
|
|
|
|
|
|
|
|
|
|
Interest rate swaps |
|
$ |
— |
|
|
$ |
13,162 |
|
|
$ |
— |
|
|
$ |
13,162 |
|
|
Securities sold, not yet purchased |
|
|
3,591 |
|
|
|
— |
|
|
|
— |
|
|
|
3,591 |
|
|
Total liabilities at fair value |
|
$ |
3,591 |
|
|
$ |
13,162 |
|
|
$ |
— |
|
|
$ |
16,753 |
|
79
CBRE GROUP, INC.
NOTES TO CONSOLIDATED FINANCIAL STATEMENTS—(Continued)
The fair values of the warehouse receivables are calculated based on already locked in security buy prices. At December 31, 2017 and 2016, all of the warehouse receivables included in the accompanying consolidated balance sheets were either under commitment to be purchased by Freddie Mac or had confirmed forward trade commitments for the issuance and purchase of Fannie Mae or Ginnie Mae mortgage backed securities that will be secured by the underlying loans (See Notes 2 and 4). These assets are classified as Level 2 in the fair value hierarchy as all inputs are readily observable.
The valuation of interest rate swaps and foreign currency exchange forward contracts is determined using widely accepted valuation techniques including discounted cash flow analysis on the expected cash flows of each derivative. This analysis reflects the contractual terms of the derivatives, including the period to maturity, and uses observable market-based inputs, including interest rate and foreign currency exchange forward curves. The fair values of interest rate swaps and foreign currency exchange forward contracts are determined using the market standard methodology of netting the discounted future estimated cash payments/receipts. The estimated cash flows are based on an expectation of future interest rates or foreign currency exchange rates using forward curves derived from observable market interest rate and foreign currency exchange forward curves.
Fair value measurements for our available for sale securities are obtained from independent pricing services which utilize observable market data that may include quoted market prices, dealer quotes, market spreads, cash flows, the U.S. treasury yield curve, trading levels, market consensus prepayment speeds, credit information and the instrument's terms and conditions.
The trading securities and securities sold, not yet purchased are primarily in the U.S. and are generally valued at the last reported sales price on the day of valuation or, if no sales occurred on the valuation date, at the mean of the bid and asked prices on such date.
There were no significant non-recurring fair value measurements recorded during the years ended December 31, 2017, 2016 and 2015.
FASB ASC Topic 825, “Financial Instruments” requires disclosure of fair value information about financial instruments, whether or not recognized in the accompanying consolidated balance sheets. Our financial instruments are as follows:
|
|
• |
Cash and Cash Equivalents and Restricted Cash – These balances include cash and cash equivalents as well as restricted cash with maturities of less than three months. The carrying amount approximates fair value due to the short-term maturities of these instruments. |
|
|
• |
Receivables, less Allowance for Doubtful Accounts – Due to their short-term nature, fair value approximates carrying value. |
|
|
• |
Warehouse Receivables – These balances are carried at fair value based on market prices at the balance sheet date. |
|
|
• |
Trading and Available for Sale Securities – These investments are carried at their fair value. |
|
|
• |
Foreign Currency Exchange Forward Contracts – These assets and liabilities are carried at their fair value as calculated by using widely accepted valuation techniques including discounted cash flow analysis on the expected cash flows of each derivative. |
|
|
• |
Securities Sold, not yet Purchased – These liabilities are carried at their fair value. |
|
|
• |
Short-Term Borrowings – The majority of this balance represents outstanding amounts under our warehouse lines of credit of our wholly-owned subsidiary, CBRE Capital Markets. Due to the short-term nature and variable interest rates of these instruments, fair value approximates carrying value (see Notes 4 and 11). |
80
CBRE GROUP, INC.
NOTES TO CONSOLIDATED FINANCIAL STATEMENTS—(Continued)
|
|
• |
Interest Rate Swaps – These liabilities are carried at their fair value as calculated by using widely-accepted valuation techniques including discounted cash flow analysis on the expected cash flows of each derivative (see Note 7). |
|
|
• |
Senior Notes – Based on dealers’ quotes (which falls within Level 2 of the fair value hierarchy), the estimated fair values of our 5.00% senior notes, 4.875% senior notes and 5.25% senior notes were $823.8 million, $645.7 million and $468.0 million, respectively, at December 31, 2017 and $827.6 million, $607.0 million and $439.3 million, respectively, at December 31, 2016. The actual carrying value of our 5.00% senior notes, 4.875% senior notes and 5.25% senior notes, net of unamortized debt issuance costs as well as unamortized discount or premium, if applicable, totaled $791.7 million, $592.0 million and $422.4 million, respectively, at December 31, 2017 and $790.4 million, $591.2 million and $422.2 million, respectively, at December 31, 2016 (see Note 11). |
|
|
• |
Notes Payable on Real Estate: As of December 31, 2017 and 2016, the carrying value of our notes payable on real estate, net of unamortized debt issuance costs, was $17.9 million and $26.0 million, respectively. These notes payable were not recourse to CBRE Group, Inc., except for being recourse to the single-purpose entities that held the real estate assets and were the primary obligors on the notes payable. These borrowings have either fixed interest rates or floating interest rates at spreads added to a market index. Although it is possible that certain portions of our notes payable on real estate may have fair values that differ from their carrying values, based on the terms of such loans as compared to current market conditions, or other factors specific to the borrower entity, we do not believe that the fair value of our notes payable is significantly different than their carrying value. |
We are exposed to certain risks arising from both our business operations and economic conditions. We manage economic risks, including interest rate, liquidity and credit risk primarily by managing the amount, sources and duration of our debt funding and by using derivative financial instruments. Specifically, we enter into derivative financial instruments to manage exposures that arise from business activities that result in the payment of future known but uncertain cash amounts, the value of which are determined by interest rates. Our derivative financial instruments are used to manage differences in the amount, timing and duration of our known or expected cash payments principally related to our borrowings. We do not net derivatives on our balance sheet. Our objectives in using interest rate derivatives are to add stability to interest expense and to manage our exposure to interest rate movements. To accomplish this objective, we primarily use interest rate swaps as part of our interest rate risk management strategy.
In July 2015, we entered into three interest rate swap agreements with an aggregate notional amount of $300.0 million, all with effective dates in August 2015, and designated them as cash flow hedges in accordance with FASB ASC Topic 815, “Derivatives and Hedging.” We structured these swap agreements to attempt to hedge the variability of future interest payments due to changes in interest rates prior to us issuing the 4.875% senior notes (see Note 11). In August 2015, we elected to terminate these agreements and paid a $6.2 million cash settlement, which was recorded to accumulated other comprehensive loss in the accompanying consolidated balance sheets and is being amortized to interest expense throughout the remaining term of the terminated hedge transaction until August 2025. There was no hedge ineffectiveness for the years ended December 31, 2017, 2016 and 2015. We reclassified $0.6 million in each of the years ended December 31, 2017 and 2016 from accumulated other comprehensive loss to interest expense. During the next twelve months, we estimate that $0.6 million will be reclassified from accumulated other comprehensive loss to interest expense.
81
CBRE GROUP, INC.
NOTES TO CONSOLIDATED FINANCIAL STATEMENTS—(Continued)
In March 2011, we entered into five interest rate swap agreements, all with effective dates in October 2011, and immediately designated them as cash flow hedges in accordance with FASB ASC Topic 815. The purpose of these interest rate swap agreements is to attempt to hedge potential changes to our cash flows due to the variable interest nature of our senior term loan facilities. The total notional amount of these interest rate swap agreements is $400.0 million, with $200.0 million having expired in October 2017 and $200.0 million expiring in September 2019. The ineffective portion of the change in fair value of the derivatives is recognized directly in earnings. There was no significant hedge ineffectiveness for the years ended December 31, 2017, 2016 and 2015. The effective portion of changes in the fair value of derivatives designated and qualifying as cash flow hedges is recorded in accumulated other comprehensive loss on the balance sheet and is subsequently reclassified into earnings in the period that the hedged forecasted transaction affects earnings. We reclassified $7.4 million, $10.7 million and $11.9 million for the years ended December 31, 2017, 2016, and 2015, respectively, from accumulated other comprehensive loss to interest expense. During the next twelve months, we estimate that $3.1 million will be reclassified from accumulated other comprehensive loss to interest expense. In addition, we recorded a net gain of $0.9 million, and net losses of $2.4 million and $6.5 million for the years ended December 31, 2017, 2016 and 2015, respectively, to other comprehensive loss in relation to such interest rate swap agreements. As of December 31, 2017 and 2016, the fair values of such interest rate swap agreements were reflected as a $4.8 million liability and a $13.2 million liability, respectively, and were included in other liabilities in the accompanying consolidated balance sheets.
Additionally, our foreign operations expose us to fluctuations in foreign exchange rates. These fluctuations may impact the value of our cash receipts and payments in terms of our functional (reporting) currency, which is U.S. dollars. We enter into derivative financial instruments to attempt to protect the value or fix the amount of certain obligations in terms of our reporting currency, the U.S. dollar. In March 2014, we began a foreign currency exchange forward hedging program by entering into foreign currency exchange forward contracts, including agreements to buy U.S. dollars and sell Australian dollars, British pound sterling, Canadian dollars, euros and Japanese yen. The purpose of these forward contracts was to attempt to mitigate the risk of fluctuations in foreign currency exchange rates that would adversely impact some of our foreign currency denominated EBITDA. Hedge accounting was not elected for any of these contracts. As such, changes in the fair values of these contracts were recorded directly in earnings. As of December 31, 2017 and 2016, we had no foreign currency exchange forward contracts outstanding as the program expired in December 2016. Included in the consolidated statement of operations were net gains of $7.7 million and $24.2 million for the years ended December 31, 2016 and 2015, respectively, resulting from net gains on foreign currency exchange forward contracts.
We also routinely monitor our exposure to currency exchange rate changes in connection with certain transactions and sometimes enter into foreign currency exchange option and forward contracts to limit our exposure to such transactions, as appropriate. In the ordinary course of business, we also sometimes utilize derivative financial instruments in the form of foreign currency exchange contracts to attempt to mitigate foreign currency exchange exposure resulting from intercompany loans. The net impact on our financial position and earnings resulting from these foreign currency exchange forward and options contracts has not been significant.
|
8. |
Property and Equipment |
Property and equipment consists of the following (dollars in thousands):
|
|
|
|
|
December 31, |
|
|||||
|
|
|
Useful Lives |
|
|
2017 |
|
|
|
2016 |
|
|
Computer hardware and software |
|
3-10 years |
|
$ |
670,059 |
|
|
$ |
683,738 |
|
|
Leasehold improvements |
|
1-15 years |
|
|
415,947 |
|
|
|
342,940 |
|
|
Furniture and equipment |
|
1-10 years |
|
|
279,621 |
|
|
|
247,768 |
|
|
Equipment under capital leases |
|
3-5 years |
|
|
10,803 |
|
|
|
10,755 |
|
|
Total cost |
|
|
|
|
1,376,430 |
|
|
|
1,285,201 |
|
|
Accumulated depreciation and amortization |
|
|
|
|
(758,691 |
) |
|
|
(724,445 |
) |
|
Property and equipment, net |
|
|
|
$ |
617,739 |
|
|
$ |
560,756 |
|
82
CBRE GROUP, INC.
NOTES TO CONSOLIDATED FINANCIAL STATEMENTS—(Continued)
Depreciation and amortization expense associated with property and equipment was $166.0 million, $151.2 million and $137.2 million for the years ended December 31, 2017, 2016 and 2015, respectively.
|
9. |
Goodwill and Other Intangible Assets |
The following table summarizes the changes in the carrying amount of goodwill for the years ended December 31, 2017 and 2016 (dollars in thousands):
|
|
|
|
|
|
|
|
|
|
|
|
|
|
|
Global |
|
|
|
|
|
|
|
|
|
|
|
|
|
|
|
|
|
|
|
|
|
Asia |
|
|
Investment |
|
|
Development |
|
|
|
|
|
|||
|
|
|
Americas |
|
|
EMEA |
|
|
Pacific |
|
|
Management |
|
|
Services |
|
|
Total |
|
||||||
|
Balance as of December 31, 2015 |
|
|
|
|
|
|
|
|
|
|
|
|
|
|
|
|
|
|
|
|
|
|
|
|
|
Goodwill |
|
$ |
2,260,076 |
|
|
$ |
1,172,150 |
|
|
$ |
155,875 |
|
|
$ |
479,739 |
|
|
$ |
86,663 |
|
|
$ |
4,154,503 |
|
|
Accumulated impairment losses |
|
|
(798,290 |
) |
|
|
(138,631 |
) |
|
|
— |
|
|
|
(44,922 |
) |
|
|
(86,663 |
) |
|
|
(1,068,506 |
) |
|
|
|
|
1,461,786 |
|
|
|
1,033,519 |
|
|
|
155,875 |
|
|
|
434,817 |
|
|
|
— |
|
|
|
3,085,997 |
|
|
Purchase accounting entries related to acquisitions |
|
|
42,080 |
|
|
|
36,929 |
|
|
|
(3,922 |
) |
|
|
350 |
|
|
|
— |
|
|
|
75,437 |
|
|
Foreign exchange movement |
|
|
773 |
|
|
|
(161,784 |
) |
|
|
(1,247 |
) |
|
|
(17,784 |
) |
|
|
— |
|
|
|
(180,042 |
) |
|
Balance as of December 31, 2016 |
|
|
|
|
|
|
|
|
|
|
|
|
|
|
|
|
|
|
|
|
|
|
|
|
|
Goodwill |
|
|
2,302,929 |
|
|
|
1,047,295 |
|
|
|
150,706 |
|
|
|
462,305 |
|
|
|
86,663 |
|
|
|
4,049,898 |
|
|
Accumulated impairment losses |
|
|
(798,290 |
) |
|
|
(138,631 |
) |
|
|
— |
|
|
|
(44,922 |
) |
|
|
(86,663 |
) |
|
|
(1,068,506 |
) |
|
|
|
|
1,504,639 |
|
|
|
908,664 |
|
|
|
150,706 |
|
|
|
417,383 |
|
|
|
— |
|
|
|
2,981,392 |
|
|
Purchase accounting entries related to acquisitions |
|
|
104,654 |
|
|
|
17,402 |
|
|
|
4,198 |
|
|
|
17,568 |
|
|
|
— |
|
|
|
143,822 |
|
|
Foreign exchange movement |
|
|
993 |
|
|
|
91,761 |
|
|
|
11,204 |
|
|
|
25,568 |
|
|
|
— |
|
|
|
129,526 |
|
|
Balance as of December 31, 2017 |
|
|
|
|
|
|
|
|
|
|
|
|
|
|
|
|
|
|
|
|
|
|
|
|
|
Goodwill |
|
|
2,408,576 |
|
|
|
1,156,458 |
|
|
|
166,108 |
|
|
|
505,441 |
|
|
|
86,663 |
|
|
|
4,323,246 |
|
|
Accumulated impairment losses |
|
|
(798,290 |
) |
|
|
(138,631 |
) |
|
|
— |
|
|
|
(44,922 |
) |
|
|
(86,663 |
) |
|
|
(1,068,506 |
) |
|
|
|
$ |
1,610,286 |
|
|
$ |
1,017,827 |
|
|
$ |
166,108 |
|
|
$ |
460,519 |
|
|
$ |
— |
|
|
$ |
3,254,740 |
|
During 2017, we completed 11 in-fill acquisitions, including two leading Software as a Service (SaaS) platforms – one that produces scalable interactive visualization technologies for commercial real estate and one that provides technology solutions for facilities management operations, a healthcare-focused project manager in Australia, a full-service brokerage and management boutique in South Florida, a technology-enabled national boutique commercial real estate finance and consulting firm in the United States, a retail consultancy in France, a majority interest in a Toronto-based investment management business specializing in private infrastructure and private equity investments, a San Francisco-based technology-focused boutique real estate brokerage firm, a project management and design engineering firm operating across the United States, a Washington, D.C.-based retail brokerage operation and a leading technical engineering services provider in Italy. During 2016, we acquired our independent affiliate in Norway, a London-based retail property advisor specializing in the luxury goods retail sector and a leading provider of retail project management, shopping center development and tenant coordination services in the U.S.
83
CBRE GROUP, INC.
NOTES TO CONSOLIDATED FINANCIAL STATEMENTS—(Continued)
Our annual assessment of goodwill and other intangible assets deemed to have indefinite lives has historically been completed as of the beginning of the fourth quarter of each year. We performed the 2017, 2016 and 2015 assessments as of October 1. When we performed our required annual goodwill impairment review as of October 1, 2017, 2016 and 2015, we determined that no impairment existed as the estimated fair value of our reporting units was in excess of their carrying value.
Other intangible assets totaled $1.4 billion, net of accumulated amortization of $1.0 billion as of December 31, 2017, and $1.4 billion, net of accumulated amortization of $771.7 million, as of December 31, 2017 and 2016, respectively, and are comprised of the following (dollars in thousands):
|
|
|
December 31, |
|
|||||||||||||
|
|
|
2017 |
|
|
2016 |
|
||||||||||
|
|
|
Gross |
|
|
|
|
|
|
Gross |
|
|
|
|
|
||
|
|
|
Carrying |
|
|
Accumulated |
|
|
Carrying |
|
|
Accumulated |
|
||||
|
|
|
Amount |
|
|
Amortization |
|
|
Amount |
|
|
Amortization |
|
||||
|
Unamortizable intangible assets |
|
|
|
|
|
|
|
|
|
|
|
|
|
|
|
|
|
Management contracts |
|
$ |
90,503 |
|
|
|
|
|
|
$ |
101,355 |
|
|
|
|
|
|
Trademarks |
|
|
56,800 |
|
|
|
|
|
|
|
56,800 |
|
|
|
|
|
|
Trade names |
|
|
16,250 |
|
|
|
|
|
|
|
18,100 |
|
|
|
|
|
|
|
|
$ |
163,553 |
|
|
|
|
|
|
$ |
176,255 |
|
|
|
|
|
|
Amortizable intangible assets |
|
|
|
|
|
|
|
|
|
|
|
|
|
|
|
|
|
Customer relationships |
|
$ |
802,597 |
|
|
$ |
(355,642 |
) |
|
$ |
761,290 |
|
|
$ |
(270,447 |
) |
|
Mortgage servicing rights |
|
|
608,757 |
|
|
|
(235,626 |
) |
|
|
501,087 |
|
|
|
(180,563 |
) |
|
Trademarks/Trade name |
|
|
321,406 |
|
|
|
(64,866 |
) |
|
|
306,559 |
|
|
|
(46,837 |
) |
|
Management contracts |
|
|
203,291 |
|
|
|
(122,450 |
) |
|
|
177,014 |
|
|
|
(99,733 |
) |
|
Covenant not to compete |
|
|
73,750 |
|
|
|
(57,358 |
) |
|
|
73,750 |
|
|
|
(32,777 |
) |
|
Other |
|
|
226,496 |
|
|
|
(164,796 |
) |
|
|
186,757 |
|
|
|
(141,316 |
) |
|
|
|
$ |
2,236,297 |
|
|
$ |
(1,000,738 |
) |
|
$ |
2,006,457 |
|
|
$ |
(771,673 |
) |
|
Total intangible assets |
|
$ |
2,399,850 |
|
|
$ |
(1,000,738 |
) |
|
$ |
2,182,712 |
|
|
$ |
(771,673 |
) |
Unamortizable intangible assets include management contracts identified as a result of the REIM Acquisitions relating to relationships with open-end funds, a trademark separately identified as a result of the 2001 Acquisition and a trade name separately identified in connection with the REIM Acquisitions, which represents the Clarion Partners trade name in the U.S. These intangible assets have indefinite useful lives and accordingly are not being amortized.
Customer relationships relate to existing relationships mainly in the brokerage, occupier outsourcing and property management lines of business that were primarily identified in the Trammell Crow Company Acquisition, the Norland Acquisition and the GWS Acquisition. These intangible assets are being amortized over useful lives of up to 20 years.
Mortgage servicing rights represent the carrying value of servicing assets in our mortgage brokerage line of business in the U.S. The mortgage servicing rights are being amortized over the estimated period that net servicing income is expected to be received, which is typically up to ten years.
In connection with the GWS Acquisition, trademarks of approximately $280 million were separately identified and are being amortized over 20 years.
Management contracts consist primarily of asset management contracts relating to relationships with closed-end funds and separate accounts in the U.S., Europe and Asia that were separately identified as a result of the REIM Acquisitions. These management contracts are being amortized over useful lives of up to 13 years.
84
CBRE GROUP, INC.
NOTES TO CONSOLIDATED FINANCIAL STATEMENTS—(Continued)
A covenant not to compete of approximately $74 million was separately identified in connection with the GWS Acquisition and is being amortized over three years.
Other amortizable intangible assets mainly represent transition costs, which get amortized as a reduction of revenue over the life of the associated contract.
Amortization expense related to intangible assets was $238.7 million, $211.7 million and $175.3 million for the years ended December 31, 2017, 2016 and 2015, respectively. The estimated annual amortization expense for each of the years ending December 31, 2018 through December 31, 2022 approximates $216.2 million, $165.0 million, $138.2 million, $117.0 million and $107.1 million, respectively.
|
10. |
Investments in Unconsolidated Subsidiaries |
Investments in unconsolidated subsidiaries are accounted for under the equity method of accounting. Our investment ownership percentages in equity method investments vary, generally ranging up to 5.0% in our Global Investment Management segment, up to 10.0% in our Development Services segment, and up to 50.0% in our other business segments.
85
CBRE GROUP, INC.
NOTES TO CONSOLIDATED FINANCIAL STATEMENTS—(Continued)
Combined condensed financial information for the entities accounted for using the equity method is as follows (dollars in thousands):
Condensed Balance Sheets Information:
|
|
|
December 31, |
|
|||||
|
|
|
|
2017 |
|
|
|
2016 |
|
|
Global Investment Management |
|
|
|
|
|
|
|
|
|
Current assets |
|
$ |
1,304,249 |
|
|
$ |
1,787,277 |
|
|
Non-current assets |
|
|
15,369,496 |
|
|
|
13,711,080 |
|
|
Total assets |
|
$ |
16,673,745 |
|
|
$ |
15,498,357 |
|
|
Current liabilities |
|
$ |
526,777 |
|
|
$ |
1,237,589 |
|
|
Non-current liabilities |
|
|
4,354,825 |
|
|
|
4,402,376 |
|
|
Total liabilities |
|
$ |
4,881,602 |
|
|
$ |
5,639,965 |
|
|
Non-controlling interests |
|
$ |
83,579 |
|
|
$ |
31,265 |
|
|
Development Services |
|
|
|
|
|
|
|
|
|
Current assets |
|
$ |
2,995,449 |
|
|
$ |
2,717,146 |
|
|
Non-current assets |
|
|
102,508 |
|
|
|
122,457 |
|
|
Total assets |
|
$ |
3,097,957 |
|
|
$ |
2,839,603 |
|
|
Current liabilities |
|
$ |
1,451,239 |
|
|
$ |
1,153,833 |
|
|
Non-current liabilities |
|
|
110,649 |
|
|
|
167,757 |
|
|
Total liabilities |
|
$ |
1,561,888 |
|
|
$ |
1,321,590 |
|
|
Other |
|
|
|
|
|
|
|
|
|
Current assets |
|
$ |
86,171 |
|
|
$ |
69,466 |
|
|
Non-current assets |
|
|
76,577 |
|
|
|
38,318 |
|
|
Total assets |
|
$ |
162,748 |
|
|
$ |
107,784 |
|
|
Current liabilities |
|
$ |
54,211 |
|
|
$ |
46,623 |
|
|
Non-current liabilities |
|
|
1,340 |
|
|
|
1,668 |
|
|
Total liabilities |
|
$ |
55,551 |
|
|
$ |
48,291 |
|
|
Total |
|
|
|
|
|
|
|
|
|
Current assets |
|
$ |
4,385,869 |
|
|
$ |
4,573,889 |
|
|
Non-current assets |
|
|
15,548,581 |
|
|
|
13,871,855 |
|
|
Total assets |
|
$ |
19,934,450 |
|
|
$ |
18,445,744 |
|
|
Current liabilities |
|
$ |
2,032,227 |
|
|
$ |
2,438,045 |
|
|
Non-current liabilities |
|
|
4,466,814 |
|
|
|
4,571,801 |
|
|
Total liabilities |
|
$ |
6,499,041 |
|
|
$ |
7,009,846 |
|
|
Non-controlling interests |
|
$ |
83,579 |
|
|
$ |
31,265 |
|
86
CBRE GROUP, INC.
NOTES TO CONSOLIDATED FINANCIAL STATEMENTS—(Continued)
Condensed Statements of Operations Information:
|
|
|
Year Ended December 31, |
|
|||||||||
|
|
|
|
2017 |
|
|
|
2016 |
|
|
|
2015 |
|
|
Global Investment Management |
|
|
|
|
|
|
|
|
|
|
|
|
|
Revenue |
|
$ |
1,108,125 |
|
|
$ |
1,184,573 |
|
|
$ |
585,495 |
|
|
Operating income (loss) |
|
$ |
972,493 |
|
|
$ |
209,230 |
|
|
$ |
(414,538 |
) |
|
Net income (loss) |
|
$ |
833,189 |
|
|
$ |
122,560 |
|
|
$ |
(481,405 |
) |
|
Development Services |
|
|
|
|
|
|
|
|
|
|
|
|
|
Revenue |
|
$ |
104,816 |
|
|
$ |
85,594 |
|
|
$ |
62,191 |
|
|
Operating income |
|
$ |
427,407 |
|
|
$ |
292,141 |
|
|
$ |
251,557 |
|
|
Net income |
|
$ |
395,697 |
|
|
$ |
269,841 |
|
|
$ |
240,034 |
|
|
Other |
|
|
|
|
|
|
|
|
|
|
|
|
|
Revenue |
|
$ |
179,649 |
|
|
$ |
156,035 |
|
|
$ |
169,078 |
|
|
Operating income |
|
$ |
25,924 |
|
|
$ |
26,500 |
|
|
$ |
30,566 |
|
|
Net income |
|
$ |
25,459 |
|
|
$ |
26,350 |
|
|
$ |
31,050 |
|
|
Total |
|
|
|
|
|
|
|
|
|
|
|
|
|
Revenue |
|
$ |
1,392,590 |
|
|
$ |
1,426,202 |
|
|
$ |
816,764 |
|
|
Operating income (loss) |
|
$ |
1,425,824 |
|
|
$ |
527,871 |
|
|
$ |
(132,415 |
) |
|
Net income (loss) |
|
$ |
1,254,345 |
|
|
$ |
418,751 |
|
|
$ |
(210,321 |
) |
Our Global Investment Management segment invests our own capital in certain real estate investments with clients. We have provided investment management, property management, brokerage and other professional services in connection with these real estate investments on an arm’s length basis and earned revenues from these unconsolidated subsidiaries of $100.3 million, $86.8 million and $98.1 million during the years ended December 31, 2017, 2016 and 2015, respectively.
|
11. |
Long-Term Debt and Short-Term Borrowings |
Total long-term debt and short-term borrowings consist of the following (dollars in thousands):
|
|
|
December 31, |
|
|||||
|
|
|
|
2017 |
|
|
|
2016 |
|
|
Long-Term Debt: |
|
|
|
|
|
|
|
|
|
Senior term loans, with interest ranging from 1.77% to 2.51%, due through 2022 |
|
$ |
200,000 |
|
|
$ |
751,875 |
|
|
5.00% senior notes due in 2023 |
|
|
800,000 |
|
|
|
800,000 |
|
|
4.875% senior notes due in 2026, net of unamortized discount |
|
|
596,273 |
|
|
|
595,912 |
|
|
5.25% senior notes due in 2025, net of unamortized premium |
|
|
426,317 |
|
|
|
426,500 |
|
|
Other |
|
|
8 |
|
|
|
14 |
|
|
Total long-term debt |
|
|
2,022,598 |
|
|
|
2,574,301 |
|
|
Less: current maturities of long-term debt |
|
|
(8 |
) |
|
|
(11 |
) |
|
Less: unamortized debt issuance costs |
|
|
(22,987 |
) |
|
|
(26,164 |
) |
|
Total long-term debt, net of current maturities |
|
$ |
1,999,603 |
|
|
$ |
2,548,126 |
|
|
Short-Term Borrowings: |
|
|
|
|
|
|
|
|
|
Warehouse lines of credit, with interest ranging from 1.70% to 4.31%, due in 2018 |
|
$ |
910,766 |
|
|
$ |
1,254,653 |
|
|
Other |
|
|
16 |
|
|
|
16 |
|
|
Total short-term borrowings |
|
$ |
910,782 |
|
|
$ |
1,254,669 |
|
87
CBRE GROUP, INC.
NOTES TO CONSOLIDATED FINANCIAL STATEMENTS—(Continued)
Future annual aggregate maturities of total consolidated gross debt (excluding unamortized discount, premium and deferred financing costs) at December 31, 2017 are as follows (dollars in thousands): 2018—$910,790; 2019—$0; 2020—$0; 2021—$0; 2022—$200,000 and $1,825,000 thereafter.
Long-Term Debt
We maintain credit facilities with third-party lenders, which we use for a variety of purposes. On March 28, 2013, CBRE Services, our wholly-owned subsidiary, entered into a credit agreement (2013 Credit Agreement) with a syndicate of banks led by Credit Suisse AG (CS) as administrative and collateral agent, to completely refinance a previous credit agreement. On January 9, 2015, CBRE Services entered into an amended and restated credit agreement (2015 Credit Agreement) with a syndicate of banks jointly led by Merrill Lynch, Pierce, Fenner & Smith Incorporated, J.P. Morgan Securities LLC and CS. In January 2015, we used the proceeds from the tranche A term loan facility under the 2015 Credit Agreement and from the December 2014 issuance of $125.0 million of 5.25% senior notes due 2025, along with cash on hand, to pay off the prior tranche A and tranche B term loans and the balance on our revolving credit facility under the 2013 Credit Agreement. On September 3, 2015, CBRE Services entered into an incremental assumption agreement with a syndicate of banks jointly led by Wells Fargo Securities, LLC and CS to establish new tranche B-1 and tranche B-2 term loan facilities under the 2015 Credit Agreement in an aggregate principal amount of $400.0 million. On March 21, 2016, CBRE Services executed an amendment to the 2015 Credit Agreement that, among other things, extended the maturity on the revolving credit facility to March 2021 and increased the borrowing capacity under the revolving credit facility by $200.0 million. On October 31, 2017, CBRE Services entered into a new Credit Agreement (the 2017 Credit Agreement), which refinanced and replaced the 2015 Credit Agreement. We used $200.0 million of borrowings from the tranche A term loan facility and $83.0 million of revolving credit facility borrowings under the 2017 Credit Agreement, in addition to cash on hand, to repay all amounts outstanding under the 2015 Credit Agreement.
The 2017 Credit Agreement is a senior unsecured credit facility that is jointly and severally guaranteed by us and certain of our subsidiaries. As of December 31, 2017, the 2017 Credit Agreement provided for the following: (1) a $2.8 billion revolving credit facility, which includes the capacity to obtain letters of credit and swingline loans and matures on October 31, 2022 and (2) a $750.0 million delayed draw tranche A term loan facility, requiring quarterly principal payments, which begin on March 5, 2018 and continue through maturity on October 31, 2022, provided that in the event that our leverage ratio (as defined in the 2017 Credit Agreement) is less than or equal to 2.50 to 1.00 on the last day of the fiscal quarter immediately preceding any such payment date, no such quarterly principal payment shall be required on such date.
Borrowings under the term loan facilities under the 2017 Credit Agreement as of December 31, 2017 bear interest, based at our option, on either (1) the applicable fixed rate plus 0.875% to 1.25% or (2) the daily rate plus 0.0% to 0.25%, in each case as determined by reference to our Credit Rating (as defined in the 2017 Credit Agreement). As of December 31, 2017, we had $193.5 million of term loan borrowings outstanding of tranche A term loan facility (at an interest rate of 2.51%), net of unamortized debt issuance costs, under the 2017 Credit Agreement, which was included in the accompanying consolidated balance sheets.
Our 2015 Credit Agreement was an unsecured credit facility that was jointly and severally guaranteed by us and substantially all of our material domestic subsidiaries. Our 2015 Credit Agreement provided for the following: (1) a $2.8 billion revolving credit facility, which included the capacity to obtain letters of credit and swingline loans and had a maturity date of March 21, 2021; (2) a $500.0 million tranche A term loan facility requiring quarterly principal payments, which began on June 30, 2015 and would have continued through maturity on January 9, 2020; (3) a $270.0 million tranche B-1 term loan facility requiring quarterly principal payments, which began on December 31, 2015 and would have continued through maturity on September 3, 2020; and (4) a $130.0 million tranche B-2 term loan facility requiring quarterly principal payments, which began on December 31, 2015 and would have continued through maturity on September 3, 2022. On November 1, 2016, we prepaid a total of $101.9 million of the 2017 and 2018 required amortization on our senior term loans under the 2015 Credit Agreement, which included $59.4 million for the tranche A term loan facility, $28.7 million for the tranche B-1 term loan facility and $13.8 million for the tranche B-2 term loan facility. As of December 31, 2016, we had $744.3 million of term loan borrowings outstanding, net of unamortized debt issuance costs, under the 2015 Credit Agreement (consisting of $404.6 million of tranche A term loan facility, $229.4 million of tranche B-1 term loan facility and $110.3 million of tranche B-2 term loan facility), which was included in the accompanying consolidated balance sheets.
88
CBRE GROUP, INC.
NOTES TO CONSOLIDATED FINANCIAL STATEMENTS—(Continued)
On August 13, 2015, CBRE Services issued $600.0 million in aggregate principal amount of 4.875% senior notes due March 1, 2026 at a price equal to 99.24% of their face value. The 4.875% senior notes are unsecured obligations of CBRE Services, senior to all of its current and future subordinated indebtedness, but effectively subordinated to all of its current and future secured indebtedness. The 4.875% senior notes are jointly and severally guaranteed on a senior basis by us and each domestic subsidiary of CBRE Services that guarantees our 2017 Credit Agreement. Interest accrues at a rate of 4.875% per year and is payable semi-annually in arrears on March 1 and September 1, with the first interest payment made on March 1, 2016. The 4.875% senior notes are redeemable at our option, in whole or in part, prior to December 1, 2025 at a redemption price equal to the greater of (1) 100% of the principal amount of the 4.875% senior notes to be redeemed and (2) the sum of the present values of the remaining scheduled payments of principal and interest thereon to December 1, 2025 (not including any portions of payments of interest accrued as of the date of redemption) discounted to the date of redemption on a semi-annual basis at the Adjusted Treasury Rate (as defined in the indenture governing these notes). In addition, at any time on or after December 1, 2025, the 4.875% senior notes may be redeemed by us, in whole or in part, at a redemption price equal to 100.0% of the principal amount, plus accrued and unpaid interest, if any, to (but excluding) the date of redemption. If a change of control triggering event (as defined in the indenture governing these notes) occurs, we are obligated to make an offer to purchase the then outstanding 4.875% senior notes at a redemption price of 101.0% of the principal amount, plus accrued and unpaid interest, if any, to the date of purchase. The amount of the 4.875% senior notes, net of unamortized discount and unamortized debt issuance costs, included in the accompanying consolidated balance sheets was $592.0 million and $591.2 million at December 31, 2017 and 2016, respectively.
On September 26, 2014, CBRE Services issued $300.0 million in aggregate principal amount of 5.25% senior notes due March 15, 2025. On December 12, 2014, CBRE Services issued an additional $125.0 million in aggregate principal amount of 5.25% senior notes due March 15, 2025 at a price equal to 101.5% of their face value, plus interest deemed to have accrued from September 26, 2014. The 5.25% senior notes are unsecured obligations of CBRE Services, senior to all of its current and future subordinated indebtedness, but effectively subordinated to all of its current and future secured indebtedness. The 5.25% senior notes are jointly and severally guaranteed on a senior basis by us and each domestic subsidiary of CBRE Services that guarantees our 2017 Credit Agreement. Interest accrues at a rate of 5.25% per year and is payable semi-annually in arrears on March 15 and September 15, with the first interest payment made on March 15, 2015. The 5.25% senior notes are redeemable at our option, in whole or in part, prior to December 15, 2024 at a redemption price equal to the greater of (1) 100% of the principal amount of the 5.25% senior notes to be redeemed and (2) the sum of the present values of the remaining scheduled payments of principal and interest thereon to December 15, 2024 (not including any portions of payments of interest accrued as of the date of redemption) discounted to the date of redemption on a semi-annual basis at the Adjusted Treasury Rate (as defined in the indentures governing these notes). In addition, at any time on or after December 15, 2024, the 5.25% senior notes may be redeemed by us, in whole or in part, at a redemption price equal to 100.0% of the principal amount, plus accrued and unpaid interest, if any, to (but excluding) the date of redemption. If a change of control triggering event (as defined in the indenture governing these notes) occurs, we are obligated to make an offer to purchase the then outstanding 5.25% senior notes at a redemption price of 101.0% of the principal amount, plus accrued and unpaid interest, if any, to the date of purchase. The amount of the 5.25% senior notes, net of unamortized premium and unamortized debt issuance costs, included in the accompanying consolidated balance sheets was $422.4 million and $422.2 million at December 31, 2017 and 2016, respectively.
On March 14, 2013, CBRE Services issued $800.0 million in aggregate principal amount of 5.00% senior notes due March 15, 2023. The 5.00% senior notes are unsecured obligations of CBRE Services, senior to all of its current and future subordinated indebtedness, but effectively subordinated to all of its current and future secured indebtedness. The 5.00% senior notes are jointly and severally guaranteed on a senior basis by us and each domestic subsidiary of CBRE Services that guarantees our 2017 Credit Agreement. Interest accrues at a rate of 5.00% per year and is payable semi-annually in arrears on March 15 and September 15, with the first interest payment made on September 15, 2013. The 5.00% senior notes are redeemable at our option, in whole or in part, on or after March 15, 2018 at a redemption price of 102.5% of the principal amount on that date and at declining prices thereafter. At any time prior to March 15, 2016, we could have redeemed up to 35.0% of the original principal amount of the 5.00% senior notes using the net cash proceeds from certain public offerings, which we did not elect to do. In addition, at any time prior to March 15, 2018, the 5.00% senior notes may be redeemed by us, in whole or in part, at a redemption price equal to 100.0% of the principal amount, plus accrued and unpaid interest, if any, to the date of redemption, and an applicable premium (as defined in the indenture governing these notes), which is based on the
89
CBRE GROUP, INC.
NOTES TO CONSOLIDATED FINANCIAL STATEMENTS—(Continued)
excess of the present value of the March 15, 2018 redemption price plus all remaining interest payments through March 15, 2018, over the principal amount of the 5.00% senior notes on such redemption date. If a change of control triggering event (as defined in the indenture governing these notes) occurs, we are obligated to make an offer to purchase the then outstanding 5.00% senior notes at a redemption price of 101.0% of the principal amount, plus accrued and unpaid interest, if any. The amount of the 5.00% senior notes, net of unamortized debt issuance costs, included in the accompanying consolidated balance sheets was $791.7 million and $790.4 million at December 31, 2017 and 2016, respectively.
The indentures governing our 5.00% senior notes, 4.875% senior notes and 5.25% senior notes contain restrictive covenants that, among other things, limit our ability to create or permit liens on assets securing indebtedness, enter into sale/leaseback transactions and enter into consolidations or mergers. In addition, our 2017 Credit Agreement also requires us to maintain a minimum coverage ratio of consolidated EBITDA (as defined in the 2017 Credit Agreement) to consolidated interest expense of 2.00x and a maximum leverage ratio of total debt less available cash to consolidated EBITDA (as defined in the 2017 Credit Agreement) of 4.25x (and in the case of the first four full fiscal quarters following consummation of a qualified acquisition (as defined in the 2017 Credit Agreement), 4.75x) as of the end of each fiscal quarter. On this basis, our coverage ratio of consolidated EBITDA to consolidated interest expense was 14.74x for the year ended December 31, 2017, and our leverage ratio of total debt less available cash to consolidated EBITDA was 0.79x as of December 31, 2017.
Short-Term Borrowings
We had short-term borrowings of $910.8 million and $1.3 billion as of December 31, 2017 and 2016, respectively, with related weighted average interest rates of 2.7% and 2.1%, respectively, which are included in the accompanying consolidated balance sheets.
Revolving Credit Facility
The revolving credit facility under the 2017 Credit Agreement allows for borrowings outside of the U.S., with a $200.0 million sub-facility available to one of our Canadian subsidiaries, one of our Australian subsidiaries and one of our New Zealand subsidiaries and a $300.0 million sub-facility available to one of our U.K. subsidiaries. Borrowings under the revolving credit facility bear interest at varying rates, based at our option, on either (1) the applicable fixed rate plus 0.775% to 1.075% or (2) the daily rate plus 0.0% to 0.075%, in each case as determined by reference to our Credit Rating (as defined in the 2017 Credit Agreement). The 2017 Credit Agreement requires us to pay a fee based on the total amount of the revolving credit facility commitment (whether used or unused) and a ticking fee to the lenders under the tranche A term loan facility (which commenced on January 30, 2018 and ends on July 31, 2018 (or such earlier date as the tranche A term loan facility is terminated or drawn in its entirety)). As of December 31, 2017, no amounts were outstanding under our revolving credit facility other than letters of credit totaling $2.0 million. These letters of credit, which reduce the amount we may borrow under the revolving credit facility, were primarily issued in the ordinary course of business.
The revolving credit facility under the 2015 Credit Agreement allowed for borrowings outside of the U.S., with a $75.0 million sub-facility available to one of our Canadian subsidiaries, a $100.0 million sub-facility available to one of our Australian subsidiaries and one of our New Zealand subsidiaries and a $300.0 million sub-facility available to one of our U.K. subsidiaries. Additionally, outstanding borrowings under these sub-facilities could have been up to 5.0% higher as allowed under the currency fluctuation provision in the 2015 Credit Agreement. Borrowings under the revolving credit facility bore interest at varying rates, based at our option, on either (1) the applicable fixed rate plus 0.85% to 1.00% or (2) the daily rate, in each case as determined by reference to our Credit Rating (as defined in the 2015 Credit Agreement). The 2015 Credit Agreement required us to pay a fee based on the total amount of the revolving credit facility commitment (whether used or unused). As of December 31, 2016, no amounts were outstanding under our revolving credit facility under the 2015 Credit Agreement other than letters of credit totaling $2.0 million. These letters of credit, which reduced the amount we could borrow under the revolving credit facility, were primarily issued in the ordinary course of business.
90
CBRE GROUP, INC.
NOTES TO CONSOLIDATED FINANCIAL STATEMENTS—(Continued)
CBRE Capital Markets has warehouse lines of credit with third-party lenders for the purpose of funding mortgage loans that will be resold, and a funding arrangement with Fannie Mae for the purpose of selling a percentage of certain closed multifamily loans to Fannie Mae. These warehouse lines are recourse only to CBRE Capital Markets and are secured by our related warehouse receivables. See Note 4 for additional information.
Other
On March 2, 2007, we entered into a $50.0 million credit note with Wells Fargo Bank for the purpose of purchasing eligible investments, which include cash equivalents, agency securities, A1/P1 commercial paper and eligible money market funds. The proceeds of this note are not made generally available to us, but instead are deposited in an investment account maintained by Wells Fargo Bank and used and applied solely to purchase eligible investment securities. This agreement has been amended several times and as of December 31, 2017 provides for a $5.0 million revolving credit note, bears interest at 0.25% per year and has a maturity date of April 30, 2018. As of December 31, 2017 and 2016, there were no amounts outstanding under this note.
We are a party to a number of pending or threatened lawsuits arising out of, or incident to, our ordinary course of business. We believe that any losses in excess of the amounts accrued therefor as liabilities on our financial statements are unlikely to be significant, but litigation is inherently uncertain and there is the potential for a material adverse effect on our financial statements if one or more matters are resolved in a particular period in an amount materially in excess of what we anticipated.
Our leases generally relate to office space that we occupy, have varying terms and expire at various dates through 2030. The following is a schedule by year of future minimum lease payments for noncancellable operating leases as of December 31, 2017 (dollars in thousands):
|
2018 |
|
$ |
230,083 |
|
|
2019 |
|
|
207,129 |
|
|
2020 |
|
|
184,872 |
|
|
2021 |
|
|
167,879 |
|
|
2022 |
|
|
135,451 |
|
|
Thereafter |
|
|
438,121 |
|
|
Total minimum payment required |
|
$ |
1,363,535 |
|
Total minimum payments for noncancellable operating leases were not reduced by the minimum sublease rental income of $12.9 million due in the future under noncancellable subleases.
Substantially all leases require us to pay maintenance costs, insurance and property taxes. The composition of total rental expense under noncancellable operating leases consisted of the following (dollars in thousands):
|
|
|
Year Ended December 31, |
|
|||||||||
|
|
|
|
2017 |
|
|
|
2016 |
|
|
|
2015 |
|
|
Minimum rentals |
|
$ |
276,676 |
|
|
$ |
252,285 |
|
|
$ |
236,965 |
|
|
Less sublease rentals |
|
|
(3,446 |
) |
|
|
(4,322 |
) |
|
|
(4,673 |
) |
|
|
|
$ |
273,230 |
|
|
$ |
247,963 |
|
|
$ |
232,292 |
|
In January 2008, CBRE MCI, a wholly-owned subsidiary of CBRE Capital Markets, entered into an agreement with Fannie Mae under Fannie Mae’s DUS Program to provide financing for multifamily housing with five or more units. Under the DUS Program, CBRE MCI originates, underwrites, closes and services loans without prior approval by Fannie Mae, and in selected cases, is subject to sharing up to one-third of any losses on loans originated under the DUS Program. CBRE MCI has funded loans subject to such loss sharing arrangements with
91
CBRE GROUP, INC.
NOTES TO CONSOLIDATED FINANCIAL STATEMENTS—(Continued)
unpaid principal balances of $19.8 billion at December 31, 2017. CBRE MCI, under its agreement with Fannie Mae, must post cash reserves or other acceptable collateral under formulas established by Fannie Mae to provide for sufficient capital in the event losses occur. As of December 31, 2017 and 2016, CBRE MCI had a $58.0 million and a $45.0 million, respectively, letter of credit under this reserve arrangement, and had recorded a liability of approximately $32.9 million and $28.2 million, respectively, for loan loss under such guarantee obligation. Fannie Mae’s recourse under the DUS Program is limited to the assets of CBRE MCI, which assets totaled approximately $614.5 million (including $370.9 million of warehouse receivables, a substantial majority of which are pledged against warehouse lines of credit and are therefore not available to Fannie Mae) at December 31, 2017.
CBRE Capital Markets participates in Freddie Mac’s Multifamily Small Balance Loan (SBL) Program. Under the SBL program, CBRE Capital Markets has certain repurchase and loss reimbursement obligations. These obligations are for the period from origination of the loan to the securitization date. CBRE Capital Markets must post a cash reserve or other acceptable collateral to provide for sufficient capital in the event the obligations are triggered. As of December 31, 2017, CBRE Capital Markets had posted a $5.0 million letter of credit under this reserve arrangement.
We had outstanding letters of credit totaling $69.4 million as of December 31, 2017, excluding letters of credit for which we have outstanding liabilities already accrued on our consolidated balance sheet related to our subsidiaries’ outstanding reserves for claims under certain insurance programs as well as letters of credit related to operating leases. The CBRE Capital Markets letters of credit totaling $63.0 million as of December 31, 2017 referred to in the preceding paragraphs represented the majority of the $69.4 million outstanding letters of credit as of such date. The remaining letters of credit are primarily executed by us in the ordinary course of business and expire at varying dates through September 2018.
We had guarantees totaling $56.1 million as of December 31, 2017, excluding guarantees related to pension liabilities, consolidated indebtedness and other obligations for which we have outstanding liabilities already accrued on our consolidated balance sheet, and excluding guarantees related to operating leases. The $56.1 million primarily represents guarantees executed by us in the ordinary course of business, including various guarantees of management and vendor contracts in our operations overseas, which expire at the end of each of the respective agreements.
In addition, as of December 31, 2017, we had issued numerous non-recourse carveout, completion and budget guarantees relating to development projects for the benefit of third parties. These guarantees are commonplace in our industry and are made by us in the ordinary course of our Development Services business. Non-recourse carveout guarantees generally require that our project-entity borrower not commit specified improper acts, with us potentially liable for all or a portion of such entity’s indebtedness or other damages suffered by the lender if those acts occur. Completion and budget guarantees generally require us to complete construction of the relevant project within a specified timeframe and/or within a specified budget, with us potentially being liable for costs to complete in excess of such timeframe or budget. However, we generally use “guaranteed maximum price” contracts with reputable, bondable general contractors with respect to projects for which we provide these guarantees. These contracts are intended to pass the risk to such contractors. While there can be no assurance, we do not expect to incur any material losses under these guarantees.
An important part of the strategy for our Global Investment Management business involves investing our capital in certain real estate investments with our clients. These co-investments generally total up to 2.0% of the equity in a particular fund. As of December 31, 2017, we had aggregate commitments of $38.6 million to fund future co-investments.
Additionally, an important part of our Development Services business strategy is to invest in unconsolidated real estate subsidiaries as a principal (in most cases co-investing with our clients). As of December 31, 2017, we had committed to fund $20.8 million of additional capital to these unconsolidated subsidiaries.
92
CBRE GROUP, INC.
NOTES TO CONSOLIDATED FINANCIAL STATEMENTS—(Continued)
Stock Incentive Plans
Second Amended and Restated 2004 Stock Incentive Plan. Our 2004 stock incentive plan was adopted by our board of directors and approved by our stockholders on April 21, 2004, and was amended several times subsequently. The 2004 stock incentive plan authorized the grant of stock-based awards to our employees, directors and independent contractors. However, our 2004 stock incentive plan was terminated in May 2012 in connection with the adoption of our 2012 equity incentive plan, which is described below. At termination, all unissued shares from the 2004 stock incentive plan were allocated to the 2012 equity incentive plan for potential future issuance. Since our 2004 stock incentive plan has been terminated, no new awards may be granted under it. However, as of December 31, 2017, outstanding stock options granted under the 2004 stock incentive plan to acquire 5,658 shares of our Class A common stock remain outstanding according to their terms, and we will continue to issue shares to the extent required under the terms of such outstanding awards.
2012 Equity Incentive Plan. Our 2012 equity incentive plan was adopted by our board of directors and approved by our stockholders on May 8, 2012. The 2012 equity incentive plan authorized the grant of stock-based awards to our employees, directors and independent contractors. However, our 2012 stock incentive plan was terminated in May 2017 in connection with the adoption of our 2017 equity incentive plan, which is described below. At termination, no unissued shares from the 2012 stock incentive plan were allocated to the 2017 equity incentive plan for potential future issuance. Since our 2012 stock incentive plan has been terminated, no new awards may be granted under it. However, as of December 31, 2017, assuming the maximum number of shares under our performance-based awards will later be issued, 5,829,189 outstanding restricted stock unit (RSU) awards granted under the 2012 stock incentive plan to acquire shares of our Class A common stock remain outstanding according to their terms, and we will continue to issue shares to the extent required under the terms of such outstanding awards. Shares underlying awards that expire, terminate or lapse under the 2012 stock incentive plan will not become available for grant under the 2017 equity incentive plan.
2017 Equity Incentive Plan. Our 2017 equity incentive plan was adopted by our board of directors and approved by our stockholders on May 19, 2017. The 2017 equity incentive plan authorizes the grant of stock-based awards to our employees, directors and independent contractors. Unless terminated earlier, the 2017 equity incentive plan will terminate on March 3, 2027. A total of 10,000,000 shares of our Class A common stock were reserved for issuance under the 2017 equity incentive plan. Additionally, shares underlying expired, canceled, forfeited or terminated awards (other than awards granted in substitution of an award previously granted), plus those utilized to pay tax withholding obligations with respect to an award (other than an option or stock appreciation right) will be available for issuance under the 2017 equity incentive plan. No person is eligible to be granted equity awards in the aggregate covering more than 3,300,000 shares during any fiscal year or cash awards in excess of $5.0 million for any fiscal year. The number of shares issued or reserved pursuant to the 2017 equity incentive plan, or pursuant to outstanding awards, is subject to adjustment on account of a stock split of our outstanding shares, stock dividend, dividend payable in a form other than shares in an amount that has a material effect on the price of the shares, consolidation, combination or reclassification of the shares, recapitalization, spin-off, or other similar occurrence. Stock options and stock appreciation rights granted under the 2017 equity incentive plan are subject to a maximum term of ten years from the date of grant. All awards are generally subject to a minimum three year vesting schedule. As of December 31, 2017, assuming the maximum number of shares under our performance-based awards will later be issued, 5,573,842 shares remained available for future grants under this plan.
Stock Options
As of December 31, 2017, no shares were subject to options issued under our 2017 or 2012 equity incentive plans. No options were granted during the years ended December 31, 2017, 2016 and 2015. All options that have been granted under the 2004 stock incentive plan have a term of five or seven years from the date of grant.
93
CBRE GROUP, INC.
NOTES TO CONSOLIDATED FINANCIAL STATEMENTS—(Continued)
The total intrinsic value of stock options exercised during the years ended December 31, 2017, 2016 and 2015 was $0.4 million, $1.6 million and $13.1 million, respectively. We recorded cash received from stock option exercises of $0.4 million, $0.9 million and $7.5 million during the years ended December 31, 2017, 2016 and 2015, respectively, and related tax benefit of $0.1 million, $0.4 million and $3.2 million during the years ended December 31, 2017, 2016 and 2015, respectively. Upon option exercise, we issue new shares of stock. Excess tax benefits exist when the tax deduction resulting from the exercise of options exceeds the compensation cost recorded.
Non-Vested Stock Awards
We have issued non-vested stock awards, including restricted stock units and restricted shares, in our Class A common stock to certain of our employees, independent contractors and members of our board of directors. The following is a summary of the awards granted during the years ended December 31, 2017, 2016 and 2015.
|
|
• |
During the year ended December 31, 2017, we granted RSUs that are performance vesting in nature, with 1,458,033 reflecting the maximum number of RSUs that may be issued if all of the performance targets are satisfied at their highest levels, and 1,466,986 RSUs that are time vesting in nature. |
|
|
• |
During the year ended December 31, 2016, we granted RSUs that are performance vesting in nature, with 60,098 reflecting the maximum number of RSUs that may be issued if all of the performance targets are satisfied at their highest levels, and 1,436,310 RSUs that are time vesting in nature. |
|
|
• |
During the year ended December 31, 2015, we granted RSUs that are performance vesting in nature, with 1,281,267 reflecting the maximum number of RSUs that may be issued if all of the performance targets are satisfied at their highest levels, and 1,535,940 RSUs that are time vesting in nature. |
Our annual performance-vesting awards generally vest in full three years from the grant date, based on our achievement against various adjusted income per share performance targets, or in some cases against adjusted EBITDA performance targets of our consolidated business, business lines or regions. Our time-vesting awards generally vest 25% per year over four years from the grant date.
In addition, on December 1, 2017 (Grant Date), we made a special one-time grant of RSUs under our 2017 equity incentive plan (Special RSU grant) to certain of our employees, with 3,288,618 reflecting the maximum number of RSUs that may be issued if all of the performance targets are satisfied at their highest levels, and 939,605 RSUs that are time vesting in nature. As a condition to this special RSU grant, each participant has agreed to execute a Restrictive Covenants Agreement. Each Special RSU grant consisted of:
|
|
(i) |
Time Vesting RSUs with respect to 33.3% of the total number of target RSUs subject to the grant. |
|
|
(ii) |
Total Shareholder Return (TSR) Performance RSUs with respect to 33.3% of the total number of target RSUs subject to the grant. The actual number of TSR Performance RSUs that will vest is determined by measuring our cumulative TSR against the cumulative TSR of each of the other companies comprising the S&P 500 on the Grant Date (the Comparison Group) over a six-year measurement period commencing on the Grant Date and ending on December 1, 2023. For purposes of measuring TSR, the initial value of our common stock will be the average closing price of such common stock for the 60 trading days immediately preceding the Grant Date and the final value of our common stock will be the average closing price of such common stock for the 60 trading days immediately preceding December 1, 2023. |
|
|
(iii) |
EPS Performance RSUs with respect to 33.3% of the total number of target RSUs subject to the grant. The actual number of EPS Performance RSUs that will vest is determined by measuring our cumulative adjusted income per share growth against the cumulative EPS growth, as reported under GAAP (GAAP EPS), of each of the other members of the Comparison Group over a six-year measurement period commencing on January 1, 2018 and ending on December 31, 2023. |
Each type of RSU subject to the Special RSU grant generally vests in full six years from the grant date.
94
CBRE GROUP, INC.
NOTES TO CONSOLIDATED FINANCIAL STATEMENTS—(Continued)
We estimated the fair value of the TSR Performance RSUs referred to above on the date of the grant using a Monte Carlo simulation with the following assumptions:
|
Volatility of common stock |
|
|
27.85 |
% |
|
Expected dividend yield |
|
|
0.00 |
% |
|
Risk-free interest rate |
|
|
2.33 |
% |
Lastly, on December 15, 2017, we granted 127,160 RSUs that are time vesting in nature to certain senior brokers. Such awards generally vest in full three years from the grant date.
A summary of the status of our non-vested stock awards is presented in the table below:
|
|
|
Shares/Units |
|
|
Weighted Average Market Value Per Share |
|
||
|
Balance at December 31, 2014 |
|
|
7,542,096 |
|
|
$ |
22.53 |
|
|
Granted |
|
|
2,195,638 |
|
|
|
36.80 |
|
|
Vested |
|
|
(2,033,263 |
) |
|
|
21.29 |
|
|
Forfeited |
|
|
(237,406 |
) |
|
|
26.10 |
|
|
Balance at December 31, 2015 |
|
|
7,467,065 |
|
|
|
29.08 |
|
|
Granted |
|
|
1,496,408 |
|
|
|
29.24 |
|
|
Vested |
|
|
(3,840,379 |
) |
|
|
25.09 |
|
|
Forfeited |
|
|
(279,821 |
) |
|
|
28.62 |
|
|
Balance at December 31, 2016 |
|
|
4,843,273 |
|
|
|
31.66 |
|
|
Granted |
|
|
5,152,082 |
|
|
|
40.11 |
|
|
Vested |
|
|
(2,020,812 |
) |
|
|
29.75 |
|
|
Forfeited |
|
|
(297,441 |
) |
|
|
32.85 |
|
|
Balance at December 31, 2017 |
|
|
7,677,102 |
|
|
|
37.76 |
|
Total compensation expense related to non-vested stock awards was $93.1 million, $63.5 million and $74.7 million for the years ended December 31, 2017, 2016 and 2015, respectively. At December 31, 2017, total unrecognized estimated compensation cost related to non-vested stock awards was approximately $243.3 million, which is expected to be recognized over a weighted average period of approximately 3.8 years.
Bonuses. We have bonus programs covering select employees, including senior management. Awards are based on the position and performance of the employee and the achievement of pre-established financial, operating and strategic objectives. The amounts charged to expense for bonuses were $286.1 million, $248.1 million and $231.9 million for the years ended December 31, 2017, 2016 and 2015, respectively.
401(k) Plan. Our CBRE 401(k) Plan (401(k) Plan) is a defined contribution savings plan that allows participant deferrals under Section 401(k) of the Internal Revenue Code (IRC). Most of our non-union U.S. employees, other than qualified real estate agents having the status of independent contractors under section 3508 of the IRC of 1986, as amended, are eligible to participate in the plan. The 401(k) Plan provides for participant contributions as well as a company match. A participant is allowed to contribute to the 401(k) Plan from 1% to 75% of his or her compensation, subject to limits imposed by applicable law. Effective January 1, 2007, all participants hired post January 1, 2007 vest in company match contributions 20% per year for each plan year they work 1,000 hours. All participants hired before January 1, 2007 are immediately vested in company match contributions. For 2017, 2016, and 2015, we contributed a 50% match on the first 6%, 6% and 5%, respectively, of annual compensation (up to $150,000 of compensation) deferred by each participant. In connection with the 401(k) Plan, we charged to expense $38.8 million, $44.3 million and $29.0 million for the years ended December 31, 2017, 2016 and 2015, respectively.
95
CBRE GROUP, INC.
NOTES TO CONSOLIDATED FINANCIAL STATEMENTS—(Continued)
Participants are entitled to invest up to 25% of their 401(k) account balance in shares of our common stock. As of December 31, 2017, approximately 1.2 million shares of our common stock were held as investments by participants in our 401(k) Plan.
Pension Plans. We have two contributory defined benefit pension plans in the United Kingdom (U.K.). The London-based firm of Hillier Parker May & Rowden, which we acquired in 1998, had a contributory defined benefit pension plan. A subsidiary of Insignia, which we acquired in connection with the Insignia Acquisition in 2003, also had a contributory defined benefit pension plan in the U.K. Our subsidiaries based in the U.K. maintain the plans to provide retirement benefits to existing and former employees participating in these plans. With respect to these plans, our historical policy has been to contribute annually to the plans, an amount to fund pension liabilities as actuarially determined and as required by applicable laws and regulations. Our contributions to these plans are invested by the plan trustee and, if these investments do not perform well in the future, we may be required to provide additional contributions to cover any pension underfunding. Effective July 1, 2007, we reached agreements with the active members of these plans to freeze future pension plan benefits. In return, the active members became eligible to enroll in a defined contribution plan. As of December 31, 2017 and 2016, the fair values of pension plan assets were $333.5 million and $286.6 million, respectively, and the fair values of projected benefit obligations in aggregate were $455.6 million and $416.9 million, respectively. As a result, the plans were underfunded by approximately $122.1 million and $130.3 million at December 31, 2017 and 2016, respectively, and were recorded as net liabilities included in other long term liabilities in the accompanying consolidated balance sheets. Items not yet recognized as a component of net periodic pension cost (benefit) were $194.3 million and $209.6 million at December 31, 2017 and 2016, respectively, and were included in accumulated other comprehensive loss in the accompanying consolidated balance sheets. Net periodic pension cost (benefit) was not material for the years ended December 31, 2017, 2016 and 2015.
|
14. |
Income Taxes |
The components of income from continuing operations before provision for income taxes consisted of the following (dollars in thousands):
|
|
|
Year Ended December 31, |
|
|||||||||
|
|
|
|
2017 |
|
|
|
2016 |
|
|
|
2015 |
|
|
Domestic |
|
$ |
577,098 |
|
|
$ |
536,869 |
|
|
$ |
600,939 |
|
|
Foreign |
|
|
586,995 |
|
|
|
343,857 |
|
|
|
278,791 |
|
|
|
|
$ |
1,164,093 |
|
|
$ |
880,726 |
|
|
$ |
879,730 |
|
Our tax provision (benefit) consisted of the following (dollars in thousands):
|
|
|
Year Ended December 31, |
|
|||||||||
|
|
|
|
2017 |
|
|
|
2016 |
|
|
|
2015 |
|
|
Federal: |
|
|
|
|
|
|
|
|
|
|
|
|
|
Current |
|
$ |
275,475 |
|
|
$ |
172,380 |
|
|
$ |
215,703 |
|
|
Deferred |
|
|
39,563 |
|
|
|
27,463 |
|
|
|
1,559 |
|
|
|
|
|
315,038 |
|
|
|
199,843 |
|
|
|
217,262 |
|
|
State: |
|
|
|
|
|
|
|
|
|
|
|
|
|
Current |
|
|
21,212 |
|
|
|
20,946 |
|
|
|
24,476 |
|
|
Deferred |
|
|
5,646 |
|
|
|
375 |
|
|
|
861 |
|
|
|
|
|
26,858 |
|
|
|
21,321 |
|
|
|
25,337 |
|
|
Foreign: |
|
|
|
|
|
|
|
|
|
|
|
|
|
Current |
|
|
123,840 |
|
|
|
94,909 |
|
|
|
91,048 |
|
|
Deferred |
|
|
411 |
|
|
|
(19,411 |
) |
|
|
(12,794 |
) |
|
|
|
|
124,251 |
|
|
|
75,498 |
|
|
|
78,254 |
|
|
|
|
$ |
466,147 |
|
|
$ |
296,662 |
|
|
$ |
320,853 |
|
96
CBRE GROUP, INC.
NOTES TO CONSOLIDATED FINANCIAL STATEMENTS—(Continued)
The following is a reconciliation stated as a percentage of pre-tax income of the U.S. statutory federal income tax rate to our effective tax rate:
|
|
|
Year Ended December 31, |
|
|||||||||
|
|
|
|
2017 |
|
|
|
2016 |
|
|
|
2015 |
|
|
Federal statutory tax rate |
|
|
35 |
% |
|
|
35 |
% |
|
|
35 |
% |
|
Tax Reform |
|
|
12 |
|
|
|
— |
|
|
|
— |
|
|
State taxes, net of federal benefit |
|
|
2 |
|
|
|
2 |
|
|
|
3 |
|
|
Non-deductible expenses |
|
|
2 |
|
|
|
— |
|
|
|
1 |
|
|
Change in valuation allowance |
|
|
(2 |
) |
|
|
2 |
|
|
|
(1 |
) |
|
Reserves for uncertain tax positions |
|
|
(2 |
) |
|
|
— |
|
|
|
1 |
|
|
Credits and exemptions |
|
|
(3 |
) |
|
|
(2 |
) |
|
|
(2 |
) |
|
Foreign rate differential |
|
|
(5 |
) |
|
|
(2 |
) |
|
|
(2 |
) |
|
Other |
|
|
1 |
|
|
|
(1 |
) |
|
|
1 |
|
|
Effective tax rate |
|
|
40 |
% |
|
|
34 |
% |
|
|
36 |
% |
On December 22, 2017, the Tax Act was signed into law making significant changes to the IRC, including, but not limited to: (i) a U.S. corporate tax rate decrease from 35% to 21%, effective for tax years beginning after December 31, 2017; (ii) the transition of U.S. international taxation from a worldwide tax system to a territorial system; and (iii) a one-time transition tax on the mandatory deemed repatriation of cumulative foreign earnings as of December 31, 2017. In December 2017, the Securities and Exchange Commission (SEC) staff issued Staff Accounting Bulletin No. 118 (SAB 118), “Income Tax Accounting Implications of the Tax Cuts and Jobs Act,” which allows us to record provisional amounts during a measurement period not to extend beyond one year of the enactment date. Our provision for income taxes for 2017 included a net charge of $143.4 million attributable to the Tax Act, with a provisional amount of $158.0 million representing our estimate of the U.S. federal and state tax impact of the transition tax (which includes the anticipated income tax benefit of the release of valuation allowances on foreign income tax credits that will be used to reduce the tax liability resulting from the transition tax), partially offset by a net income tax benefit of $14.6 million related to the re-measurement of U.S. federal deferred tax assets and liabilities (after considering certain other measures of the Act that affected our existing deferred tax assets). These amounts are based upon our best estimate of the impact of the Tax Act in accordance with our understanding of the Tax Act and the related guidance available. Additional work is necessary on the provisional amount related to the transition tax, which includes performing a more detailed analysis of historic foreign earnings and tax pools and potential corresponding adjustments.
The changes included in the Tax Act are broad and complex. The final transition impacts of the Tax Act may differ from the above estimate due to, among other things, changes in interpretations of the Tax Act, any legislative action to address questions that arise because of the Tax Act, any changes in accounting standards for income taxes or related interpretations in response to the Tax Act, or any updates or changes to estimates we have utilized to calculate the transition impacts, including impacts from changes to current-year earnings estimates and foreign exchange rates of foreign subsidiaries. Our accounting for the effects of the Tax Act is expected to be completed within the measurement period provided by SAB 118. Any subsequent adjustments to these amounts will be recorded to income tax expense from continuing operations.
The Tax Act also includes provisions for Global Intangible Low-Taxed Income (GILTI) wherein taxes on foreign earnings are imposed for more than a deemed return on tangible assets of foreign corporations. An accounting policy election allows to either: (i) account for GILTI as a component of tax expense in the period in which we are subject to the rules (the “period cost method”) or (ii) account for GILTI in our measurement of deferred taxes (the “deferred method”). Due to the complexity of the new GILTI tax rules, we are continuing to evaluate this provision of the Tax Act and the application of Topic 740. Our accounting policy election will depend, in part on analyzing our global income to determine whether we expect material tax liabilities resulting from the application of this provision and if so, whether and when to record related current and deferred income taxes and whether such amounts can be reasonably estimated. Anticipated further guidance from the Internal Revenue Service (IRS) will clarify the manner in which the GILTI tax is computed. For these reasons, we have not recorded a deferred tax expense or benefit relating to potential GILTI tax for the year ended December 31, 2017 and have not made a policy decision regarding whether to record deferred taxes on GILTI or account for the GILTI entirely as a period cost.
97
CBRE GROUP, INC.
NOTES TO CONSOLIDATED FINANCIAL STATEMENTS—(Continued)
During the years ended December 31, 2017, 2016 and 2015, respectively, we recorded a $0.1 million, $0.4 million and $3.2 million income tax benefit in connection with stock options exercised. Of this income tax benefit, $2.3 million was charged directly to additional paid-in capital within the equity section of the accompanying consolidated balance sheets in 2015. With our adoption of ASU 2016-09 in the third quarter of 2016, which has been applied on a prospective basis to settlements of share-based payment awards occurring on or after January 1, 2016, excess tax benefits for 2016 have been recognized as income tax benefits in the income statement rather than to additional paid-in capital.
Cumulative tax effects of temporary differences are shown below at December 31, 2017 and 2016 (dollars in thousands):
|
|
|
December 31, |
|
|||||
|
|
|
|
2017 |
|
|
|
2016 |
|
|
Asset (Liability) |
|
|
|
|
|
|
|
|
|
Bonus and deferred compensation |
|
$ |
186,093 |
|
|
$ |
265,043 |
|
|
Net operating losses (NOLs) and state tax credits |
|
|
283,353 |
|
|
|
245,681 |
|
|
Bad debt and other reserves |
|
|
56,313 |
|
|
|
75,620 |
|
|
Pension obligation |
|
|
22,148 |
|
|
|
29,382 |
|
|
Unconsolidated affiliates |
|
|
6,267 |
|
|
|
28,107 |
|
|
Investments |
|
|
5,573 |
|
|
|
7,142 |
|
|
Foreign tax credits |
|
|
— |
|
|
|
53,976 |
|
|
Derivative financial instruments |
|
|
— |
|
|
|
7,308 |
|
|
Property and equipment |
|
|
(40,024 |
) |
|
|
(87,679 |
) |
|
Capitalized costs and intangibles |
|
|
(256,087 |
) |
|
|
(307,301 |
) |
|
All other |
|
|
(1,441 |
) |
|
|
2,049 |
|
|
Net deferred tax assets before valuation allowance |
|
|
262,195 |
|
|
|
319,328 |
|
|
Valuation allowance |
|
|
(277,466 |
) |
|
|
(284,723 |
) |
|
Net deferred tax (liabilities) assets |
|
$ |
(15,271 |
) |
|
$ |
34,605 |
|
As of December 31, 2017, we re-measured the U.S. component of the non-current deferred tax assets and liabilities at the applicable tax rate of 21% in accordance with the Tax Act.
As of December 31, 2017, we had U.S. federal NOLs of approximately $27.5 million, translating to a deferred tax asset before valuation allowance of $5.8 million, which will begin to expire in 2023. As of December 31, 2017, there were also deferred tax assets before valuation allowances of approximately $3.3 million related to state NOLs as well as $273.1 million related to foreign NOLs. The state and foreign NOLs both begin to expire in 2018, but the majority carry forward indefinitely. The utilization of NOLs may be subject to certain limitations under U.S. federal, state and foreign laws. We have recorded a full valuation allowance for NOLs that we believe will not be fully utilized.
In addition, as of December 31, 2017, we had deferred tax assets of $55.4 million related to foreign income tax credits that were reclassed to income taxes payable due to being utilized to reduce the liability related to the transition tax associated with the Tax Act.
We determined that as of December 31, 2017, $277.5 million of deferred tax assets do not satisfy the realization criteria set forth in Topic 740. Accordingly, a valuation allowance has been recorded for this amount. If released, the entire amount would result in a benefit to continuing operations. During the year ended December 31, 2017, our valuation allowance decreased by approximately $7.3 million. This resulted from the release of valuation allowances of $42.3 million related to foreign income tax credits primarily in connection with the enactment of the Tax Act, $6.2 million of U.S. net operating loss utilization, $5.2 million related to re-measurement due to the enactment of the Tax Act and $4.7 million of foreign net operating loss utilization. These decreases were partially offset by $28.8 million of foreign currency translation, a $20.3 million increase in valuation allowances related to current year increases in foreign NOLs and $2.0 million for the establishment of valuation allowances related to
98
CBRE GROUP, INC.
NOTES TO CONSOLIDATED FINANCIAL STATEMENTS—(Continued)
U.S. NOLs. We believe it is more likely than not that future operations will generate sufficient taxable income to realize the benefit of the deferred tax assets recorded net of these valuation allowances.
Our foreign subsidiaries have accumulated $2.5 billion of undistributed earnings for which we have not recorded a deferred tax liability. No additional income taxes have been provided for any remaining undistributed foreign earnings not subject to the transition tax, in connection with the enactment of the Tax Act, or any additional outside basis difference inherent in these entities, as these amounts continue to be indefinitely reinvested in foreign operations. Although tax liabilities might result from dividends being paid out of these earnings, or as a result of a sale or liquidation of foreign subsidiaries, these earnings are permanently reinvested outside of the U.S. and we do not have any plans to repatriate them or to sell or liquidate any of our non-U.S. subsidiaries. To the extent that we are able to repatriate the earnings in a tax efficient manner, we would be required to accrue and pay U.S. taxes to repatriate these funds, net of foreign tax credits. Determining our tax liability upon repatriation is not practicable.
The total amount of gross unrecognized tax benefits was approximately $35.8 million and $94.9 million as of December 31, 2017 and 2016, respectively. The total amount of unrecognized tax benefits that would affect our effective tax rate, if recognized, is $18.8 million ($18.0 million, net of federal benefit received from state positions) and $39.1 million ($35.7 million, net of federal benefit received from state positions) as of December 31, 2017 and 2016, respectively.
A reconciliation of the beginning and ending amount of unrecognized tax benefits for the years ended December 31, 2017 and 2016 is as follows (dollars in thousands):
|
|
|
Year Ended December 31, |
|
|||||
|
|
|
2017 |
|
|
|
2016 |
|
|
|
Beginning balance, unrecognized tax benefits |
|
$ |
(94,915 |
) |
|
$ |
(92,538 |
) |
|
Gross increases - tax positions in prior period |
|
|
(1,400 |
) |
|
|
(514 |
) |
|
Gross decreases - tax positions in prior period |
|
|
23,896 |
|
|
|
358 |
|
|
Gross increases - current-period tax positions |
|
|
(4,142 |
) |
|
|
(4,237 |
) |
|
Decreases relating to settlements |
|
|
34,259 |
|
|
|
2,541 |
|
|
Reductions as a result of lapse of statute of limitations |
|
|
6,497 |
|
|
|
235 |
|
|
Foreign exchange movement |
|
|
(21 |
) |
|
|
(760 |
) |
|
Ending balance, unrecognized tax benefits |
|
$ |
(35,826 |
) |
|
$ |
(94,915 |
) |
During the year ended December 31, 2017, we released $58.2 million of gross unrecognized tax benefits primarily due to settlement of federal tax audits for tax years 2005 to 2012. As a result, we recognized $17.0 million of income tax benefits related to decreases in tax positions and $15.3 million of income tax benefits related to interest and penalties. We believe the amount of gross unrecognized tax benefits that will be settled during the next twelve months due to filing amended returns and settling ongoing exams cannot be reasonably estimated but will not be significant.
Our continuing practice is to recognize potential accrued interest and/or penalties related to income tax matters within income tax expense. During the years ended December 31, 2017, 2016 and 2015, we accrued an additional $1.0 million, $2.9 million and $3.2 million, respectively, in interest and penalties associated with uncertain tax positions. As of December 31, 2017, and 2016, we have recognized a liability for interest and penalties of $3.9 million ($3.4 million, net of related federal benefit received from interest expense) and $31.7 million ($24.3 million, net of related federal benefit received from interest expense), respectively.
We conduct business globally and, as a result, one or more of our subsidiaries files income tax returns in the U.S. federal jurisdiction and in multiple state, local and foreign jurisdictions. We are no longer open to assessment by the U.S. Internal Revenue Service for years prior to 2014. With limited exception, our significant state and foreign tax jurisdictions are no longer subject to audit by the various tax authorities for tax years prior to 2009.
99
CBRE GROUP, INC.
NOTES TO CONSOLIDATED FINANCIAL STATEMENTS—(Continued)
Our board of directors is authorized, subject to any limitations imposed by law, without the approval of our stockholders, to issue a total of 25,000,000 shares of preferred stock, in one or more series, with each such series having rights and preferences including voting rights, dividend rights, conversion rights, redemption privileges and liquidation preferences, as our board of directors may determine.
We may repurchase shares awarded to certain grant recipients under our various equity compensation plans to satisfy minimum statutory federal, state and local tax withholding obligations arising from the vesting of their equity awards. During the year ended December 31, 2015, 332,799 shares with an average price paid per share of $32.87 were repurchased relating thereto. No shares were repurchased during the years ended December 31, 2017 and 2016.
On October 27, 2016, we announced that our board of directors had authorized the company to repurchase up to an aggregate of $250 million of our Class A common stock over three years. As of December 31, 2017, the authorization remained unused.
The following is a calculation of income per share (dollars in thousands, except share data):
|
|
|
Year Ended December 31, |
|
|||||||||
|
|
|
|
2017 |
|
|
|
2016 |
|
|
|
2015 |
|
|
Basic Income Per Share |
|
|
|
|
|
|
|
|
|
|
|
|
|
Net income attributable to CBRE Group, Inc. shareholders |
|
$ |
691,479 |
|
|
$ |
571,973 |
|
|
$ |
547,132 |
|
|
Weighted average shares outstanding for basic income per share |
|
|
337,658,017 |
|
|
|
335,414,831 |
|
|
|
332,616,301 |
|
|
Basic income per share attributable to CBRE Group, Inc. shareholders |
|
$ |
2.05 |
|
|
$ |
1.71 |
|
|
$ |
1.64 |
|
|
Diluted Income Per Share |
|
|
|
|
|
|
|
|
|
|
|
|
|
Net income attributable to CBRE Group, Inc. shareholders |
|
$ |
691,479 |
|
|
$ |
571,973 |
|
|
$ |
547,132 |
|
|
Weighted average shares outstanding for basic income per share |
|
|
337,658,017 |
|
|
|
335,414,831 |
|
|
|
332,616,301 |
|
|
Dilutive effect of contingently issuable shares |
|
|
3,121,987 |
|
|
|
2,982,431 |
|
|
|
3,620,194 |
|
|
Dilutive effect of stock options |
|
|
3,552 |
|
|
|
27,301 |
|
|
|
178,361 |
|
|
Weighted average shares outstanding for diluted income per share |
|
|
340,783,556 |
|
|
|
338,424,563 |
|
|
|
336,414,856 |
|
|
Diluted income per share attributable to CBRE Group, Inc. shareholders |
|
$ |
2.03 |
|
|
$ |
1.69 |
|
|
$ |
1.63 |
|
For the years ended December 31, 2017, 2016 and 2015, 621,805, 1,833,941 and 372,020, respectively, of contingently issuable shares were excluded from the computation of diluted income per share because their inclusion would have had an anti-dilutive effect.
|
17. |
Fiduciary Funds |
The accompanying consolidated balance sheets do not include the net assets of escrow, agency and fiduciary funds, which are held by us on behalf of clients and which amounted to $4.0 billion and $3.4 billion at December 31, 2017 and 2016, respectively.
100
CBRE GROUP, INC.
NOTES TO CONSOLIDATED FINANCIAL STATEMENTS—(Continued)
We report our operations through the following segments: (1) Americas, (2) EMEA, (3) Asia Pacific, (4) Global Investment Management; and (5) Development Services.
The Americas segment is our largest segment of operations and provides a comprehensive range of services throughout the U.S. and in the largest regions of Canada and key markets in Latin America. The primary services offered consist of the following: property sales, property leasing, mortgage services, appraisal and valuation, property management and occupier outsourcing services.
Our EMEA and Asia Pacific segments generally provide services similar to the Americas business segment. The EMEA segment has operations primarily in Europe, while the Asia Pacific segment has operations in Asia, Australia and New Zealand.
Our Global Investment Management business provides investment management services to clients seeking to generate returns and diversification through direct and indirect investments in real estate in North America, Europe and Asia Pacific.
Our Development Services business consists of real estate development and investment activities primarily in the U.S.
Summarized financial information by segment is as follows (dollars in thousands):
|
|
|
Year Ended December 31, |
|
|||||||||
|
|
|
2017 |
|
|
2016 (1) |
|
|
2015 (1) |
|
|||
|
Revenue |
|
|
|
|
|
|
|
|
|
|
|
|
|
Americas |
|
$ |
7,860,239 |
|
|
$ |
7,246,459 |
|
|
$ |
6,201,676 |
|
|
EMEA |
|
|
4,164,789 |
|
|
|
3,884,596 |
|
|
|
2,984,312 |
|
|
Asia Pacific |
|
|
1,729,309 |
|
|
|
1,499,320 |
|
|
|
1,143,479 |
|
|
Global Investment Management |
|
|
377,644 |
|
|
|
369,800 |
|
|
|
460,700 |
|
|
Development Services |
|
|
77,627 |
|
|
|
71,414 |
|
|
|
65,643 |
|
|
Total revenue |
|
$ |
14,209,608 |
|
|
$ |
13,071,589 |
|
|
$ |
10,855,810 |
|
|
Depreciation and amortization |
|
|
|
|
|
|
|
|
|
|
|
|
|
Americas |
|
$ |
289,338 |
|
|
$ |
254,118 |
|
|
$ |
198,986 |
|
|
EMEA |
|
|
72,322 |
|
|
|
66,619 |
|
|
|
68,263 |
|
|
Asia Pacific |
|
|
18,258 |
|
|
|
17,810 |
|
|
|
15,609 |
|
|
Global Investment Management |
|
|
24,123 |
|
|
|
25,911 |
|
|
|
29,020 |
|
|
Development Services |
|
|
2,073 |
|
|
|
2,469 |
|
|
|
2,218 |
|
|
Total depreciation and amortization |
|
$ |
406,114 |
|
|
$ |
366,927 |
|
|
$ |
314,096 |
|
|
(1) |
In 2017, we changed the presentation of the operating results of one of our emerging businesses among our regional services reporting segments. Prior year amounts have been reclassified to conform with the current-year presentation. This change had no impact on our consolidated results. |
101
CBRE GROUP, INC.
NOTES TO CONSOLIDATED FINANCIAL STATEMENTS—(Continued)
|
|
|
Year Ended December 31, |
|
|||||||||
|
|
|
|
2017 |
|
|
2016 (1) |
|
|
2015 (1) |
|
||
|
Equity income from unconsolidated subsidiaries |
|
|
|
|
|
|
|
|
|
|
|
|
|
Americas |
|
$ |
18,789 |
|
|
$ |
17,892 |
|
|
$ |
18,413 |
|
|
EMEA |
|
|
1,553 |
|
|
|
1,817 |
|
|
|
1,934 |
|
|
Asia Pacific |
|
|
397 |
|
|
|
223 |
|
|
|
83 |
|
|
Global Investment Management |
|
|
7,923 |
|
|
|
7,243 |
|
|
|
5,972 |
|
|
Development Services |
|
|
181,545 |
|
|
|
170,176 |
|
|
|
136,447 |
|
|
Total equity income from unconsolidated subsidiaries |
|
$ |
210,207 |
|
|
$ |
197,351 |
|
|
$ |
162,849 |
|
|
Adjusted EBITDA |
|
|
|
|
|
|
|
|
|
|
|
|
|
Americas |
|
$ |
1,013,864 |
|
|
$ |
950,355 |
|
|
$ |
858,174 |
|
|
EMEA |
|
|
305,743 |
|
|
|
271,648 |
|
|
|
212,687 |
|
|
Asia Pacific |
|
|
175,900 |
|
|
|
141,912 |
|
|
|
117,557 |
|
|
Global Investment Management |
|
|
94,373 |
|
|
|
83,151 |
|
|
|
134,240 |
|
|
Development Services |
|
|
119,654 |
|
|
|
113,937 |
|
|
|
90,066 |
|
|
Total Adjusted EBITDA |
|
$ |
1,709,534 |
|
|
$ |
1,561,003 |
|
|
$ |
1,412,724 |
|
|
(1) |
In 2017, we changed the presentation of the operating results of one of our emerging businesses among our regional services reporting segments. Prior year amounts have been reclassified to conform with the current-year presentation. This change had no impact on our consolidated results. |
Adjusted EBITDA is the measure reported to the chief operating decision maker for purposes of making decisions about allocating resources to each segment and assessing performance of each segment. EBITDA represents earnings before net interest expense, write-off of financing costs on extinguished debt, income taxes, depreciation and amortization. Amounts shown for adjusted EBITDA further remove (from EBITDA) the impact of certain cash and non-cash charges related to acquisitions, cost-elimination expenses and certain carried interest incentive compensation (reversal) expense to align with the timing of associated revenue.
Adjusted EBITDA is calculated as follows (dollars in thousands):
|
|
|
Year Ended December 31, |
|
|||||||||
|
|
|
2017 |
|
|
2016 |
|
|
2015 |
|
|||
|
Net income attributable to CBRE Group, Inc. |
|
$ |
691,479 |
|
|
$ |
571,973 |
|
|
$ |
547,132 |
|
|
Add: |
|
|
|
|
|
|
|
|
|
|
|
|
|
Depreciation and amortization |
|
|
406,114 |
|
|
|
366,927 |
|
|
|
314,096 |
|
|
Interest expense |
|
|
136,814 |
|
|
|
144,851 |
|
|
|
118,880 |
|
|
Write-off of financing costs on extinguished debt |
|
|
— |
|
|
|
— |
|
|
|
2,685 |
|
|
Provision for income taxes |
|
|
466,147 |
|
|
|
296,662 |
|
|
|
320,853 |
|
|
Less: |
|
|
|
|
|
|
|
|
|
|
|
|
|
Interest income |
|
|
9,853 |
|
|
|
8,051 |
|
|
|
6,311 |
|
|
EBITDA |
|
|
1,690,701 |
|
|
|
1,372,362 |
|
|
|
1,297,335 |
|
|
Adjustments: |
|
|
|
|
|
|
|
|
|
|
|
|
|
Integration and other costs related to acquisitions |
|
|
27,351 |
|
|
|
125,743 |
|
|
|
48,865 |
|
|
Carried interest incentive compensation (reversal) expense to align with the timing of associated revenue |
|
|
(8,518 |
) |
|
|
(15,558 |
) |
|
|
26,085 |
|
|
Cost-elimination expenses (2) |
|
|
— |
|
|
|
78,456 |
|
|
|
40,439 |
|
|
Adjusted EBITDA |
|
$ |
1,709,534 |
|
|
$ |
1,561,003 |
|
|
$ |
1,412,724 |
|
102
CBRE GROUP, INC.
NOTES TO CONSOLIDATED FINANCIAL STATEMENTS—(Continued)
|
structure after several years of significant revenue and related cost growth. Cost-elimination expenses incurred during the years ended December 31, 2016 and 2015 consisted of $73.6 million and $32.6 million, respectively, of severance costs related to headcount reductions in connection with the program and $4.9 million and $7.8 million, respectively, of third-party contract termination costs. The total amount for each period does have a cash impact. |
|
|
|
Year Ended December 31, |
|
|||||||||
|
|
|
|
2017 |
|
|
|
2016 |
|
|
|
2015 |
|
|
|
|
(Dollars in thousands) |
|
|||||||||
|
Capital expenditures |
|
|
|
|
|
|
|
|
|
|
|
|
|
Americas |
|
$ |
127,135 |
|
|
$ |
134,046 |
|
|
$ |
94,376 |
|
|
EMEA |
|
|
28,716 |
|
|
|
35,452 |
|
|
|
33,092 |
|
|
Asia Pacific |
|
|
19,360 |
|
|
|
19,179 |
|
|
|
7,911 |
|
|
Global Investment Management |
|
|
2,776 |
|
|
|
2,273 |
|
|
|
3,558 |
|
|
Development Services |
|
|
55 |
|
|
|
255 |
|
|
|
527 |
|
|
Total capital expenditures |
|
$ |
178,042 |
|
|
$ |
191,205 |
|
|
$ |
139,464 |
|
|
|
|
December 31, |
|
|||||
|
|
|
|
2017 |
|
|
|
2016 |
|
|
|
|
(Dollars in thousands) |
|
|||||
|
Identifiable assets |
|
|
|
|
|
|
|
|
|
Americas |
|
$ |
5,599,820 |
|
|
$ |
5,555,400 |
|
|
EMEA |
|
|
3,005,122 |
|
|
|
2,592,800 |
|
|
Asia Pacific |
|
|
888,992 |
|
|
|
712,271 |
|
|
Global Investment Management |
|
|
1,075,691 |
|
|
|
913,563 |
|
|
Development Services |
|
|
164,455 |
|
|
|
188,762 |
|
|
Corporate |
|
|
749,750 |
|
|
|
816,791 |
|
|
Total identifiable assets |
|
$ |
11,483,830 |
|
|
$ |
10,779,587 |
|
Identifiable assets by segment are those assets used in our operations in each segment. Corporate identifiable assets primarily include cash and cash equivalents available for general corporate use and net deferred tax assets.
|
|
|
December 31, |
|
|||||
|
|
|
|
2017 |
|
|
|
2016 |
|
|
|
|
(Dollars in thousands) |
|
|||||
|
Investments in unconsolidated subsidiaries |
|
|
|
|
|
|
|
|
|
Americas |
|
$ |
39,105 |
|
|
$ |
20,202 |
|
|
EMEA |
|
|
852 |
|
|
|
388 |
|
|
Asia Pacific |
|
|
6,581 |
|
|
|
5,802 |
|
|
Global Investment Management |
|
|
83,430 |
|
|
|
87,501 |
|
|
Development Services |
|
|
108,033 |
|
|
|
118,345 |
|
|
Total investments in unconsolidated subsidiaries |
|
$ |
238,001 |
|
|
$ |
232,238 |
|
103
CBRE GROUP, INC.
NOTES TO CONSOLIDATED FINANCIAL STATEMENTS—(Continued)
Revenue in the table below is allocated based upon the country in which services are performed (dollars in thousands):
|
|
|
Year Ended December 31, |
|
|||||||||
|
|
|
|
2017 |
|
|
|
2016 |
|
|
|
2015 |
|
|
Revenue |
|
|
|
|
|
|
|
|
|
|
|
|
|
United States |
|
$ |
7,424,249 |
|
|
$ |
6,917,221 |
|
|
$ |
5,991,826 |
|
|
United Kingdom |
|
|
2,104,517 |
|
|
|
2,008,776 |
|
|
|
1,861,199 |
|
|
All other countries |
|
|
4,680,842 |
|
|
|
4,145,592 |
|
|
|
3,002,785 |
|
|
Total revenue |
|
$ |
14,209,608 |
|
|
$ |
13,071,589 |
|
|
$ |
10,855,810 |
|
The long-lived assets in the table below are comprised of net property and equipment (dollars in thousands).
|
|
|
December 31, |
|
|||||
|
|
|
|
2017 |
|
|
|
2016 |
|
|
Property and equipment, net |
|
|
|
|
|
|
|
|
|
United States |
|
$ |
432,102 |
|
|
$ |
396,608 |
|
|
United Kingdom |
|
|
61,335 |
|
|
|
61,327 |
|
|
All other countries |
|
|
124,302 |
|
|
|
102,821 |
|
|
Total property and equipment, net |
|
$ |
617,739 |
|
|
$ |
560,756 |
|
|
19. |
Related Party Transactions |
The accompanying consolidated balance sheets include loans to related parties, primarily employees other than our executive officers, of $291.2 million and $233.8 million as of December 31, 2017 and 2016, respectively. The majority of these loans represent sign-on and retention bonuses issued or assumed in connection with acquisitions and prepaid commissions as well as prepaid retention and recruitment awards issued to employees. These loans are at varying principal amounts, bear interest at rates up to 3.75% per annum and mature on various dates through 2027.
|
20. |
Guarantor and Nonguarantor Financial Statements |
The following condensed consolidating financial information includes condensed consolidating balance sheets as of December 31, 2017 and 2016, condensed consolidating statements of operations, condensed consolidating statements of comprehensive income (loss) and condensed consolidating statements of cash flows for the years ended December 31, 2017, 2016 and 2015 of:
|
|
• |
CBRE Group, Inc., as the parent; CBRE Services, as the subsidiary issuer; the guarantor subsidiaries; the nonguarantor subsidiaries; |
|
|
• |
Elimination entries necessary to consolidate CBRE Group, Inc., as the parent, with CBRE Services and its guarantor and nonguarantor subsidiaries; and |
|
|
• |
CBRE Group, Inc., on a consolidated basis. |
Investments in consolidated subsidiaries are presented using the equity method of accounting. The principal elimination entries eliminate investments in consolidated subsidiaries and intercompany balances and transactions.
104
CBRE GROUP, INC.
NOTES TO CONSOLIDATED FINANCIAL STATEMENTS—(Continued)
CONDENSED CONSOLIDATING BALANCE SHEET
AS OF DECEMBER 31, 2017
(Dollars in thousands)
|
|
|
|
|
|
|
CBRE |
|
|
Guarantor |
|
|
Nonguarantor |
|
|
|
|
|
|
Consolidated |
|
||||
|
|
|
Parent |
|
|
Services |
|
|
Subsidiaries |
|
|
Subsidiaries |
|
|
Eliminations |
|
|
Total |
|
||||||
|
ASSETS |
|
|
|
|
|
|
|
|
|
|
|
|
|
|
|
|
|
|
|
|
|
|
|
|
|
Current Assets: |
|
|
|
|
|
|
|
|
|
|
|
|
|
|
|
|
|
|
|
|
|
|
|
|
|
Cash and cash equivalents |
|
$ |
7 |
|
|
$ |
15,604 |
|
|
$ |
112,048 |
|
|
$ |
624,115 |
|
|
$ |
— |
|
|
$ |
751,774 |
|
|
Restricted cash |
|
|
— |
|
|
|
— |
|
|
|
2,095 |
|
|
|
70,950 |
|
|
|
— |
|
|
|
73,045 |
|
|
Receivables, net |
|
|
— |
|
|
|
— |
|
|
|
1,096,327 |
|
|
|
2,110,958 |
|
|
|
— |
|
|
|
3,207,285 |
|
|
Warehouse receivables (1) |
|
|
— |
|
|
|
— |
|
|
|
479,628 |
|
|
|
448,410 |
|
|
|
— |
|
|
|
928,038 |
|
|
Prepaid expenses |
|
|
— |
|
|
|
— |
|
|
|
81,106 |
|
|
|
134,230 |
|
|
|
— |
|
|
|
215,336 |
|
|
Income taxes receivable |
|
|
2,162 |
|
|
|
− |
|
|
|
− |
|
|
|
49,628 |
|
|
|
(2,162 |
) |
|
|
49,628 |
|
|
Other current assets |
|
|
— |
|
|
|
− |
|
|
|
50,556 |
|
|
|
176,865 |
|
|
|
— |
|
|
|
227,421 |
|
|
Total Current Assets |
|
|
2,169 |
|
|
|
15,604 |
|
|
|
1,821,760 |
|
|
|
3,615,156 |
|
|
|
(2,162 |
) |
|
|
5,452,527 |
|
|
Property and equipment, net |
|
|
— |
|
|
|
— |
|
|
|
431,755 |
|
|
|
185,984 |
|
|
|
— |
|
|
|
617,739 |
|
|
Goodwill |
|
|
— |
|
|
|
— |
|
|
|
1,774,529 |
|
|
|
1,480,211 |
|
|
|
— |
|
|
|
3,254,740 |
|
|
Other intangible assets, net |
|
|
— |
|
|
|
— |
|
|
|
751,930 |
|
|
|
647,182 |
|
|
|
— |
|
|
|
1,399,112 |
|
|
Investments in unconsolidated subsidiaries |
|
|
— |
|
|
|
— |
|
|
|
197,395 |
|
|
|
40,606 |
|
|
|
— |
|
|
|
238,001 |
|
|
Investments in consolidated subsidiaries |
|
|
5,456,715 |
|
|
|
4,835,043 |
|
|
|
3,053,260 |
|
|
|
— |
|
|
|
(13,345,018 |
) |
|
|
— |
|
|
Intercompany loan receivable |
|
|
— |
|
|
|
2,621,330 |
|
|
|
700,000 |
|
|
|
— |
|
|
|
(3,321,330 |
) |
|
|
— |
|
|
Deferred tax assets, net |
|
|
— |
|
|
|
— |
|
|
|
5,300 |
|
|
|
98,746 |
|
|
|
(5,300 |
) |
|
|
98,746 |
|
|
Other assets, net |
|
|
— |
|
|
|
22,810 |
|
|
|
290,675 |
|
|
|
109,480 |
|
|
|
— |
|
|
|
422,965 |
|
|
Total Assets |
|
$ |
5,458,884 |
|
|
$ |
7,494,787 |
|
|
$ |
9,026,604 |
|
|
$ |
6,177,365 |
|
|
$ |
(16,673,810 |
) |
|
$ |
11,483,830 |
|
|
LIABILITIES AND EQUITY |
|
|
|
|
|
|
|
|
|
|
|
|
|
|
|
|
|
|
|
|
|
|
|
|
|
Current Liabilities: |
|
|
|
|
|
|
|
|
|
|
|
|
|
|
|
|
|
|
|
|
|
|
|
|
|
Accounts payable and accrued expenses |
|
$ |
— |
|
|
$ |
29,708 |
|
|
$ |
445,687 |
|
|
$ |
1,198,892 |
|
|
$ |
— |
|
|
$ |
1,674,287 |
|
|
Accrued bonus and profit sharing |
|
|
— |
|
|
|
— |
|
|
|
585,165 |
|
|
|
487,811 |
|
|
|
— |
|
|
|
1,072,976 |
|
|
Compensation and employee benefits payable |
|
|
— |
|
|
|
626 |
|
|
|
380,803 |
|
|
|
422,075 |
|
|
|
— |
|
|
|
803,504 |
|
|
Income taxes payable |
|
|
— |
|
|
|
3,314 |
|
|
|
13,704 |
|
|
|
55,778 |
|
|
|
(2,162 |
) |
|
|
70,634 |
|
|
Short-term borrowings: |
|
|
|
|
|
|
|
|
|
|
|
|
|
|
|
|
|
|
— |
|
|
|
|
|
|
Warehouse lines of credit (which fund loans that U.S. Government Sponsored Enterprises have committed to purchase) (1) |
|
|
— |
|
|
|
— |
|
|
|
474,195 |
|
|
|
436,571 |
|
|
|
— |
|
|
|
910,766 |
|
|
Other |
|
|
— |
|
|
|
— |
|
|
|
16 |
|
|
|
— |
|
|
|
— |
|
|
|
16 |
|
|
Total short-term borrowings |
|
|
— |
|
|
|
— |
|
|
|
474,211 |
|
|
|
436,571 |
|
|
|
— |
|
|
|
910,782 |
|
|
Current maturities of long-term debt |
|
|
— |
|
|
|
— |
|
|
|
— |
|
|
|
8 |
|
|
|
— |
|
|
|
8 |
|
|
Other current liabilities |
|
|
— |
|
|
|
55 |
|
|
|
57,746 |
|
|
|
16,653 |
|
|
|
— |
|
|
|
74,454 |
|
|
Total Current Liabilities |
|
|
— |
|
|
|
33,703 |
|
|
|
1,957,316 |
|
|
|
2,617,788 |
|
|
|
(2,162 |
) |
|
|
4,606,645 |
|
|
Long-Term Debt, net: |
|
|
|
|
|
|
|
|
|
|
|
|
|
|
|
|
|
|
|
|
|
|
|
|
|
Long-term debt, net |
|
|
— |
|
|
|
1,999,603 |
|
|
|
— |
|
|
|
− |
|
|
|
— |
|
|
|
1,999,603 |
|
|
Intercompany loan payable |
|
|
1,439,454 |
|
|
|
— |
|
|
|
1,798,550 |
|
|
|
83,326 |
|
|
|
(3,321,330 |
) |
|
|
— |
|
|
Total Long-Term Debt, net |
|
|
1,439,454 |
|
|
|
1,999,603 |
|
|
|
1,798,550 |
|
|
|
83,326 |
|
|
|
(3,321,330 |
) |
|
|
1,999,603 |
|
|
Non-current tax liabilities |
|
|
— |
|
|
|
— |
|
|
|
135,396 |
|
|
|
5,396 |
|
|
|
— |
|
|
|
140,792 |
|
|
Deferred tax liabilities, net |
|
|
— |
|
|
|
— |
|
|
|
— |
|
|
|
119,317 |
|
|
|
(5,300 |
) |
|
|
114,017 |
|
|
Other liabilities |
|
|
— |
|
|
|
4,766 |
|
|
|
300,299 |
|
|
|
238,160 |
|
|
|
— |
|
|
|
543,225 |
|
|
Total Liabilities |
|
|
1,439,454 |
|
|
|
2,038,072 |
|
|
|
4,191,561 |
|
|
|
3,063,987 |
|
|
|
(3,328,792 |
) |
|
|
7,404,282 |
|
|
Commitments and contingencies |
|
|
— |
|
|
|
— |
|
|
|
— |
|
|
|
— |
|
|
|
— |
|
|
|
— |
|
|
Equity: |
|
|
|
|
|
|
|
|
|
|
|
|
|
|
|
|
|
|
|
|
|
|
|
|
|
CBRE Group, Inc. Stockholders’ Equity |
|
|
4,019,430 |
|
|
|
5,456,715 |
|
|
|
4,835,043 |
|
|
|
3,053,260 |
|
|
|
(13,345,018 |
) |
|
|
4,019,430 |
|
|
Non-controlling interests |
|
|
— |
|
|
|
— |
|
|
|
— |
|
|
|
60,118 |
|
|
|
— |
|
|
|
60,118 |
|
|
Total Equity |
|
|
4,019,430 |
|
|
|
5,456,715 |
|
|
|
4,835,043 |
|
|
|
3,113,378 |
|
|
|
(13,345,018 |
) |
|
|
4,079,548 |
|
|
Total Liabilities and Equity |
|
$ |
5,458,884 |
|
|
$ |
7,494,787 |
|
|
$ |
9,026,604 |
|
|
$ |
6,177,365 |
|
|
$ |
(16,673,810 |
) |
|
$ |
11,483,830 |
|
|
(1) |
Although CBRE Capital Markets is included among our domestic subsidiaries that jointly and severally guarantee our 5.00% senior notes, 4.875% senior notes, 5.25% senior notes and our 2017 Credit Agreement, a substantial majority of warehouse receivables funded under TD Bank, Fannie Mae ASAP, JP Morgan, Capital One and BofA lines of credit are pledged to TD Bank, Fannie Mae, JP Morgan, Capital One and BofA, and accordingly, are not included as collateral for these notes or our other outstanding debt. |
105
CBRE GROUP, INC.
NOTES TO CONSOLIDATED FINANCIAL STATEMENTS—(Continued)
CONDENSED CONSOLIDATING BALANCE SHEET
AS OF DECEMBER 31, 2016
(Dollars in thousands)
|
|
|
|
|
|
|
CBRE |
|
|
Guarantor |
|
|
Nonguarantor |
|
|
|
|
|
|
Consolidated |
|
||||
|
|
|
Parent |
|
|
Services |
|
|
Subsidiaries |
|
|
Subsidiaries |
|
|
Eliminations |
|
|
Total |
|
||||||
|
ASSETS |
|
|
|
|
|
|
|
|
|
|
|
|
|
|
|
|
|
|
|
|
|
|
|
|
|
Current Assets: |
|
|
|
|
|
|
|
|
|
|
|
|
|
|
|
|
|
|
|
|
|
|
|
|
|
Cash and cash equivalents |
|
$ |
7 |
|
|
$ |
16,889 |
|
|
$ |
264,121 |
|
|
$ |
481,559 |
|
|
$ |
— |
|
|
$ |
762,576 |
|
|
Restricted cash |
|
|
— |
|
|
|
— |
|
|
|
6,967 |
|
|
|
61,869 |
|
|
|
— |
|
|
|
68,836 |
|
|
Receivables, net |
|
|
— |
|
|
|
— |
|
|
|
943,028 |
|
|
|
1,662,574 |
|
|
|
— |
|
|
|
2,605,602 |
|
|
Warehouse receivables (1) |
|
|
— |
|
|
|
— |
|
|
|
687,454 |
|
|
|
588,593 |
|
|
|
— |
|
|
|
1,276,047 |
|
|
Prepaid expenses |
|
|
— |
|
|
|
— |
|
|
|
78,296 |
|
|
|
105,811 |
|
|
|
— |
|
|
|
184,107 |
|
|
Income taxes receivable |
|
|
1,915 |
|
|
|
17,364 |
|
|
|
8,170 |
|
|
|
37,456 |
|
|
|
(19,279 |
) |
|
|
45,626 |
|
|
Other current assets |
|
|
— |
|
|
|
1,421 |
|
|
|
64,576 |
|
|
|
113,659 |
|
|
|
— |
|
|
|
179,656 |
|
|
Total Current Assets |
|
|
1,922 |
|
|
|
35,674 |
|
|
|
2,052,612 |
|
|
|
3,051,521 |
|
|
|
(19,279 |
) |
|
|
5,122,450 |
|
|
Property and equipment, net |
|
|
— |
|
|
|
— |
|
|
|
395,749 |
|
|
|
165,007 |
|
|
|
— |
|
|
|
560,756 |
|
|
Goodwill |
|
|
— |
|
|
|
— |
|
|
|
1,669,683 |
|
|
|
1,311,709 |
|
|
|
— |
|
|
|
2,981,392 |
|
|
Other intangible assets, net |
|
|
— |
|
|
|
— |
|
|
|
793,525 |
|
|
|
617,514 |
|
|
|
— |
|
|
|
1,411,039 |
|
|
Investments in unconsolidated subsidiaries |
|
|
— |
|
|
|
— |
|
|
|
189,455 |
|
|
|
42,783 |
|
|
|
— |
|
|
|
232,238 |
|
|
Investments in consolidated subsidiaries |
|
|
4,226,629 |
|
|
|
4,076,265 |
|
|
|
2,314,549 |
|
|
|
— |
|
|
|
(10,617,443 |
) |
|
|
— |
|
|
Intercompany loan receivable |
|
|
— |
|
|
|
2,684,421 |
|
|
|
700,000 |
|
|
|
— |
|
|
|
(3,384,421 |
) |
|
|
— |
|
|
Deferred tax assets, net |
|
|
— |
|
|
|
— |
|
|
|
72,325 |
|
|
|
90,334 |
|
|
|
(57,335 |
) |
|
|
105,324 |
|
|
Other assets, net |
|
|
— |
|
|
|
22,229 |
|
|
|
240,707 |
|
|
|
103,452 |
|
|
|
— |
|
|
|
366,388 |
|
|
Total Assets |
|
$ |
4,228,551 |
|
|
$ |
6,818,589 |
|
|
$ |
8,428,605 |
|
|
$ |
5,382,320 |
|
|
$ |
(14,078,478 |
) |
|
$ |
10,779,587 |
|
|
LIABILITIES AND EQUITY |
|
|
|
|
|
|
|
|
|
|
|
|
|
|
|
|
|
|
|
|
|
|
|
|
|
Current Liabilities: |
|
|
|
|
|
|
|
|
|
|
|
|
|
|
|
|
|
|
|
|
|
|
|
|
|
Accounts payable and accrued expenses |
|
$ |
— |
|
|
$ |
30,049 |
|
|
$ |
409,470 |
|
|
$ |
1,006,919 |
|
|
$ |
— |
|
|
$ |
1,446,438 |
|
|
Accrued bonus and profit sharing |
|
|
— |
|
|
|
— |
|
|
|
506,715 |
|
|
|
383,606 |
|
|
|
— |
|
|
|
890,321 |
|
|
Compensation and employee benefits payable |
|
|
— |
|
|
|
626 |
|
|
|
402,719 |
|
|
|
369,577 |
|
|
|
— |
|
|
|
772,922 |
|
|
Income taxes payable |
|
|
— |
|
|
|
— |
|
|
|
40,946 |
|
|
|
36,684 |
|
|
|
(19,279 |
) |
|
|
58,351 |
|
|
Short-term borrowings: |
|
|
|
|
|
|
|
|
|
|
|
|
|
|
|
|
|
|
— |
|
|
|
|
|
|
Warehouse lines of credit (which fund loans that U.S. Government Sponsored Enterprises have committed to purchase) (1) |
|
|
— |
|
|
|
— |
|
|
|
680,473 |
|
|
|
574,180 |
|
|
|
— |
|
|
|
1,254,653 |
|
|
Other |
|
|
— |
|
|
|
— |
|
|
|
16 |
|
|
|
— |
|
|
|
— |
|
|
|
16 |
|
|
Total short-term borrowings |
|
|
— |
|
|
|
— |
|
|
|
680,489 |
|
|
|
574,180 |
|
|
|
— |
|
|
|
1,254,669 |
|
|
|
|
|
|
|
|
|
|
|
|
|
|
|
|
|
|
|
|
|
|
|
|
|
|
|
|
Current maturities of long-term debt |
|
|
— |
|
|
|
— |
|
|
|
— |
|
|
|
11 |
|
|
|
— |
|
|
|
11 |
|
|
Other current liabilities |
|
|
— |
|
|
|
— |
|
|
|
81,590 |
|
|
|
21,127 |
|
|
|
— |
|
|
|
102,717 |
|
|
Total Current Liabilities |
|
|
— |
|
|
|
30,675 |
|
|
|
2,121,929 |
|
|
|
2,392,104 |
|
|
|
(19,279 |
) |
|
|
4,525,429 |
|
|
Long-Term Debt, net: |
|
|
|
|
|
|
|
|
|
|
|
|
|
|
|
|
|
|
|
|
|
|
|
|
|
Long-term debt, net |
|
|
— |
|
|
|
2,548,123 |
|
|
|
— |
|
|
|
3 |
|
|
|
— |
|
|
|
2,548,126 |
|
|
Intercompany loan payable |
|
|
1,214,064 |
|
|
|
— |
|
|
|
1,916,675 |
|
|
|
253,682 |
|
|
|
(3,384,421 |
) |
|
|
— |
|
|
Total Long-Term Debt, net |
|
|
1,214,064 |
|
|
|
2,548,123 |
|
|
|
1,916,675 |
|
|
|
253,685 |
|
|
|
(3,384,421 |
) |
|
|
2,548,126 |
|
|
Non-current tax liabilities |
|
|
— |
|
|
|
— |
|
|
|
53,422 |
|
|
|
620 |
|
|
|
— |
|
|
|
54,042 |
|
|
Deferred tax liabilities, net |
|
|
— |
|
|
|
— |
|
|
|
— |
|
|
|
128,054 |
|
|
|
(57,335 |
) |
|
|
70,719 |
|
|
Other liabilities |
|
|
— |
|
|
|
13,162 |
|
|
|
260,314 |
|
|
|
250,550 |
|
|
|
— |
|
|
|
524,026 |
|
|
Total Liabilities |
|
|
1,214,064 |
|
|
|
2,591,960 |
|
|
|
4,352,340 |
|
|
|
3,025,013 |
|
|
|
(3,461,035 |
) |
|
|
7,722,342 |
|
|
Commitments and contingencies |
|
|
— |
|
|
|
— |
|
|
|
— |
|
|
|
— |
|
|
|
— |
|
|
|
— |
|
|
Equity: |
|
|
|
|
|
|
|
|
|
|
|
|
|
|
|
|
|
|
|
|
|
|
|
|
|
CBRE Group, Inc. Stockholders’ Equity |
|
|
3,014,487 |
|
|
|
4,226,629 |
|
|
|
4,076,265 |
|
|
|
2,314,549 |
|
|
|
(10,617,443 |
) |
|
|
3,014,487 |
|
|
Non-controlling interests |
|
|
— |
|
|
|
— |
|
|
|
— |
|
|
|
42,758 |
|
|
|
— |
|
|
|
42,758 |
|
|
Total Equity |
|
|
3,014,487 |
|
|
|
4,226,629 |
|
|
|
4,076,265 |
|
|
|
2,357,307 |
|
|
|
(10,617,443 |
) |
|
|
3,057,245 |
|
|
Total Liabilities and Equity |
|
$ |
4,228,551 |
|
|
$ |
6,818,589 |
|
|
$ |
8,428,605 |
|
|
$ |
5,382,320 |
|
|
$ |
(14,078,478 |
) |
|
$ |
10,779,587 |
|
|
(1) |
Although CBRE Capital Markets is included among our domestic subsidiaries that jointly and severally guarantee our 5.00% senior notes, 4.875% senior notes, 5.25% senior notes and our 2015 Credit Agreement, a substantial majority of warehouse receivables funded under BofA, Fannie Mae ASAP, JP Morgan, Capital One and TD Bank lines of credit are pledged to BofA, Fannie Mae, JP Morgan, Capital One and TD Bank, and accordingly, are not included as collateral for these notes or our other outstanding debt. |
106
CBRE GROUP, INC.
NOTES TO CONSOLIDATED FINANCIAL STATEMENTS—(Continued)
CONDENSED CONSOLIDATING STATEMENT OF OPERATIONS
FOR THE YEAR ENDED DECEMBER 31, 2017
(Dollars in thousands)
|
|
|
|
|
|
|
CBRE |
|
|
Guarantor |
|
|
Nonguarantor |
|
|
|
|
|
|
Consolidated |
|
||||
|
|
|
Parent |
|
|
Services |
|
|
Subsidiaries |
|
|
Subsidiaries |
|
|
Eliminations |
|
|
Total |
|
||||||
|
Revenue |
|
$ |
— |
|
|
$ |
— |
|
|
$ |
7,171,828 |
|
|
$ |
7,037,780 |
|
|
$ |
— |
|
|
$ |
14,209,608 |
|
|
Costs and expenses: |
|
|
|
|
|
|
|
|
|
|
|
|
|
|
|
|
|
|
|
|
|
|
|
|
|
Cost of services |
|
|
— |
|
|
|
— |
|
|
|
4,985,201 |
|
|
|
4,908,025 |
|
|
|
— |
|
|
|
9,893,226 |
|
|
Operating, administrative and other |
|
|
5,661 |
|
|
|
1,972 |
|
|
|
1,485,464 |
|
|
|
1,365,557 |
|
|
|
— |
|
|
|
2,858,654 |
|
|
Depreciation and amortization |
|
|
— |
|
|
|
— |
|
|
|
239,863 |
|
|
|
166,251 |
|
|
|
— |
|
|
|
406,114 |
|
|
Total costs and expenses |
|
|
5,661 |
|
|
|
1,972 |
|
|
|
6,710,528 |
|
|
|
6,439,833 |
|
|
|
— |
|
|
|
13,157,994 |
|
|
Gain on disposition of real estate |
|
|
— |
|
|
|
— |
|
|
|
6,037 |
|
|
|
13,791 |
|
|
|
— |
|
|
|
19,828 |
|
|
Operating (loss) income |
|
|
(5,661 |
) |
|
|
(1,972 |
) |
|
|
467,337 |
|
|
|
611,738 |
|
|
|
— |
|
|
|
1,071,442 |
|
|
Equity income from unconsolidated subsidiaries |
|
|
— |
|
|
|
— |
|
|
|
206,655 |
|
|
|
3,552 |
|
|
|
— |
|
|
|
210,207 |
|
|
Other income |
|
|
— |
|
|
|
1 |
|
|
|
22 |
|
|
|
9,382 |
|
|
|
— |
|
|
|
9,405 |
|
|
Interest income |
|
|
— |
|
|
|
143,425 |
|
|
|
5,453 |
|
|
|
4,400 |
|
|
|
(143,425 |
) |
|
|
9,853 |
|
|
Interest expense |
|
|
— |
|
|
|
132,777 |
|
|
|
115,947 |
|
|
|
31,515 |
|
|
|
(143,425 |
) |
|
|
136,814 |
|
|
Royalty and management service expense (income) |
|
|
— |
|
|
|
— |
|
|
|
15,950 |
|
|
|
(15,950 |
) |
|
|
— |
|
|
|
— |
|
|
Income from consolidated subsidiaries |
|
|
694,978 |
|
|
|
689,615 |
|
|
|
454,850 |
|
|
|
— |
|
|
|
(1,839,443 |
) |
|
|
— |
|
|
Income before (benefit of) provision for income taxes |
|
|
689,317 |
|
|
|
698,292 |
|
|
|
1,002,420 |
|
|
|
613,507 |
|
|
|
(1,839,443 |
) |
|
|
1,164,093 |
|
|
(Benefit of) provision for income taxes |
|
|
(2,162 |
) |
|
|
3,314 |
|
|
|
312,805 |
|
|
|
152,190 |
|
|
|
— |
|
|
|
466,147 |
|
|
Net income |
|
|
691,479 |
|
|
|
694,978 |
|
|
|
689,615 |
|
|
|
461,317 |
|
|
|
(1,839,443 |
) |
|
|
697,946 |
|
|
Less: Net income attributable to non- controlling interests |
|
|
— |
|
|
|
— |
|
|
|
— |
|
|
|
6,467 |
|
|
|
— |
|
|
|
6,467 |
|
|
Net income attributable to CBRE Group, Inc. |
|
$ |
691,479 |
|
|
$ |
694,978 |
|
|
$ |
689,615 |
|
|
$ |
454,850 |
|
|
$ |
(1,839,443 |
) |
|
$ |
691,479 |
|
107
CBRE GROUP, INC.
NOTES TO CONSOLIDATED FINANCIAL STATEMENTS—(Continued)
CONDENSED CONSOLIDATING STATEMENT OF OPERATIONS
FOR THE YEAR ENDED DECEMBER 31, 2016
(Dollars in thousands)
|
|
|
|
|
|
|
CBRE |
|
|
Guarantor |
|
|
Nonguarantor |
|
|
|
|
|
|
Consolidated |
|
||||
|
|
|
Parent |
|
|
Services |
|
|
Subsidiaries |
|
|
Subsidiaries |
|
|
Eliminations |
|
|
Total |
|
||||||
|
Revenue |
|
$ |
— |
|
|
$ |
— |
|
|
$ |
6,671,793 |
|
|
$ |
6,399,796 |
|
|
$ |
— |
|
|
$ |
13,071,589 |
|
|
Costs and expenses: |
|
|
|
|
|
|
|
|
|
|
|
|
|
|
|
|
|
|
|
|
|
|
|
|
|
Cost of services |
|
|
— |
|
|
|
— |
|
|
|
4,635,426 |
|
|
|
4,488,301 |
|
|
|
— |
|
|
|
9,123,727 |
|
|
Operating, administrative and other |
|
|
5,003 |
|
|
|
(8,231 |
) |
|
|
1,454,777 |
|
|
|
1,329,761 |
|
|
|
— |
|
|
|
2,781,310 |
|
|
Depreciation and amortization |
|
|
— |
|
|
|
— |
|
|
|
225,552 |
|
|
|
141,375 |
|
|
|
— |
|
|
|
366,927 |
|
|
Total costs and expenses |
|
|
5,003 |
|
|
|
(8,231 |
) |
|
|
6,315,755 |
|
|
|
5,959,437 |
|
|
|
— |
|
|
|
12,271,964 |
|
|
Gain on disposition of real estate |
|
|
— |
|
|
|
— |
|
|
|
3,669 |
|
|
|
12,193 |
|
|
|
— |
|
|
|
15,862 |
|
|
Operating (loss) income |
|
|
(5,003 |
) |
|
|
8,231 |
|
|
|
359,707 |
|
|
|
452,552 |
|
|
|
— |
|
|
|
815,487 |
|
|
Equity income from unconsolidated subsidiaries |
|
|
— |
|
|
|
— |
|
|
|
192,811 |
|
|
|
4,540 |
|
|
|
— |
|
|
|
197,351 |
|
|
Other income (loss) |
|
|
— |
|
|
|
1 |
|
|
|
(89 |
) |
|
|
4,776 |
|
|
|
— |
|
|
|
4,688 |
|
|
Interest income |
|
|
— |
|
|
|
131,132 |
|
|
|
50,272 |
|
|
|
5,146 |
|
|
|
(178,499 |
) |
|
|
8,051 |
|
|
Interest expense |
|
|
— |
|
|
|
184,738 |
|
|
|
97,815 |
|
|
|
40,797 |
|
|
|
(178,499 |
) |
|
|
144,851 |
|
|
Royalty and management service (income) expense |
|
|
— |
|
|
|
— |
|
|
|
(39,182 |
) |
|
|
39,182 |
|
|
|
— |
|
|
|
— |
|
|
Income from consolidated subsidiaries |
|
|
575,061 |
|
|
|
603,071 |
|
|
|
241,790 |
|
|
|
— |
|
|
|
(1,419,922 |
) |
|
|
— |
|
|
Income before (benefit of) provision for income taxes |
|
|
570,058 |
|
|
|
557,697 |
|
|
|
785,858 |
|
|
|
387,035 |
|
|
|
(1,419,922 |
) |
|
|
880,726 |
|
|
(Benefit of) provision for income taxes |
|
|
(1,915 |
) |
|
|
(17,364 |
) |
|
|
182,787 |
|
|
|
133,154 |
|
|
|
— |
|
|
|
296,662 |
|
|
Net income |
|
|
571,973 |
|
|
|
575,061 |
|
|
|
603,071 |
|
|
|
253,881 |
|
|
|
(1,419,922 |
) |
|
|
584,064 |
|
|
Less: Net income attributable to non- controlling interests |
|
|
— |
|
|
|
— |
|
|
|
— |
|
|
|
12,091 |
|
|
|
— |
|
|
|
12,091 |
|
|
Net income attributable to CBRE Group, Inc. |
|
$ |
571,973 |
|
|
$ |
575,061 |
|
|
$ |
603,071 |
|
|
$ |
241,790 |
|
|
$ |
(1,419,922 |
) |
|
$ |
571,973 |
|
108
CBRE GROUP, INC.
NOTES TO CONSOLIDATED FINANCIAL STATEMENTS—(Continued)
CONDENSED CONSOLIDATING STATEMENT OF OPERATIONS
FOR THE YEAR ENDED DECEMBER 31, 2015
(Dollars in thousands)
|
|
|
|
|
|
|
CBRE |
|
|
Guarantor |
|
|
Nonguarantor |
|
|
|
|
|
|
Consolidated |
|
||||
|
|
|
Parent |
|
|
Services |
|
|
Subsidiaries |
|
|
Subsidiaries |
|
|
Eliminations |
|
|
Total |
|
||||||
|
Revenue |
|
$ |
— |
|
|
$ |
— |
|
|
$ |
5,817,752 |
|
|
$ |
5,038,058 |
|
|
$ |
— |
|
|
$ |
10,855,810 |
|
|
Costs and expenses: |
|
|
|
|
|
|
|
|
|
|
|
|
|
|
|
|
|
|
|
|
|
|
|
|
|
Cost of services |
|
|
— |
|
|
|
— |
|
|
|
3,782,705 |
|
|
|
3,300,227 |
|
|
|
— |
|
|
|
7,082,932 |
|
|
Operating, administrative and other |
|
|
67,549 |
|
|
|
(23,833 |
) |
|
|
1,349,874 |
|
|
|
1,240,019 |
|
|
|
— |
|
|
|
2,633,609 |
|
|
Depreciation and amortization |
|
|
— |
|
|
|
— |
|
|
|
173,741 |
|
|
|
140,355 |
|
|
|
— |
|
|
|
314,096 |
|
|
Total costs and expenses |
|
|
67,549 |
|
|
|
(23,833 |
) |
|
|
5,306,320 |
|
|
|
4,680,601 |
|
|
|
— |
|
|
|
10,030,637 |
|
|
Gain on disposition of real estate |
|
|
— |
|
|
|
— |
|
|
|
3,859 |
|
|
|
6,912 |
|
|
|
— |
|
|
|
10,771 |
|
|
Operating (loss) income |
|
|
(67,549 |
) |
|
|
23,833 |
|
|
|
515,291 |
|
|
|
364,369 |
|
|
|
— |
|
|
|
835,944 |
|
|
Equity income from unconsolidated subsidiaries |
|
|
— |
|
|
|
— |
|
|
|
161,404 |
|
|
|
1,445 |
|
|
|
— |
|
|
|
162,849 |
|
|
Other income (loss) |
|
|
— |
|
|
|
1 |
|
|
|
1,483 |
|
|
|
(5,293 |
) |
|
|
— |
|
|
|
(3,809 |
) |
|
Interest income |
|
|
— |
|
|
|
196,439 |
|
|
|
122,260 |
|
|
|
4,087 |
|
|
|
(316,475 |
) |
|
|
6,311 |
|
|
Interest expense |
|
|
— |
|
|
|
234,180 |
|
|
|
137,281 |
|
|
|
63,894 |
|
|
|
(316,475 |
) |
|
|
118,880 |
|
|
Write-off of financing costs on extinguished debt |
|
|
— |
|
|
|
2,685 |
|
|
|
— |
|
|
|
— |
|
|
|
— |
|
|
|
2,685 |
|
|
Royalty and management service (income) expense |
|
|
— |
|
|
|
— |
|
|
|
(27,445 |
) |
|
|
27,445 |
|
|
|
— |
|
|
|
— |
|
|
Income from consolidated subsidiaries |
|
|
588,769 |
|
|
|
598,996 |
|
|
|
151,723 |
|
|
|
— |
|
|
|
(1,339,488 |
) |
|
|
— |
|
|
Income before (benefit of) provision for income taxes |
|
|
521,220 |
|
|
|
582,404 |
|
|
|
842,325 |
|
|
|
273,269 |
|
|
|
(1,339,488 |
) |
|
|
879,730 |
|
|
(Benefit of) provision for income taxes |
|
|
(25,912 |
) |
|
|
(6,365 |
) |
|
|
243,329 |
|
|
|
109,801 |
|
|
|
— |
|
|
|
320,853 |
|
|
Net income |
|
|
547,132 |
|
|
|
588,769 |
|
|
|
598,996 |
|
|
|
163,468 |
|
|
|
(1,339,488 |
) |
|
|
558,877 |
|
|
Less: Net income attributable to non- controlling interests |
|
|
— |
|
|
|
— |
|
|
|
— |
|
|
|
11,745 |
|
|
|
— |
|
|
|
11,745 |
|
|
Net income attributable to CBRE Group, Inc. |
|
$ |
547,132 |
|
|
$ |
588,769 |
|
|
$ |
598,996 |
|
|
$ |
151,723 |
|
|
$ |
(1,339,488 |
) |
|
$ |
547,132 |
|
109
CBRE GROUP, INC.
NOTES TO CONSOLIDATED FINANCIAL STATEMENTS—(Continued)
CONDENSED CONSOLIDATING STATEMENT OF COMPREHENSIVE INCOME
FOR THE YEAR ENDED DECEMBER 31, 2017
(Dollars in thousands)
|
|
|
|
|
|
|
CBRE |
|
|
Guarantor |
|
|
Nonguarantor |
|
|
|
|
|
|
Consolidated |
|
||||
|
|
|
Parent |
|
|
Services |
|
|
Subsidiaries |
|
|
Subsidiaries |
|
|
Eliminations |
|
|
Total |
|
||||||
|
Net income |
|
$ |
691,479 |
|
|
$ |
694,978 |
|
|
$ |
689,615 |
|
|
$ |
461,317 |
|
|
$ |
(1,839,443 |
) |
|
$ |
697,946 |
|
|
Other comprehensive (loss) income: |
|
|
|
|
|
|
|
|
|
|
|
|
|
|
|
|
|
|
|
|
|
|
|
|
|
Foreign currency translation gain |
|
|
— |
|
|
|
— |
|
|
|
— |
|
|
|
217,221 |
|
|
|
— |
|
|
|
217,221 |
|
|
Amounts reclassified from accumulated other comprehensive loss to interest expense, net |
|
|
— |
|
|
|
4,964 |
|
|
|
— |
|
|
|
— |
|
|
|
— |
|
|
|
4,964 |
|
|
Unrealized gains on interest rate swaps, net |
|
|
— |
|
|
|
585 |
|
|
|
— |
|
|
|
— |
|
|
|
— |
|
|
|
585 |
|
|
Unrealized holding gains on available for sale securities, net |
|
|
— |
|
|
|
— |
|
|
|
2,557 |
|
|
|
180 |
|
|
|
— |
|
|
|
2,737 |
|
|
Pension liability adjustments, net |
|
|
— |
|
|
|
— |
|
|
|
— |
|
|
|
12,701 |
|
|
|
— |
|
|
|
12,701 |
|
|
Other, net |
|
|
(2 |
) |
|
|
— |
|
|
|
(21 |
) |
|
|
387 |
|
|
|
— |
|
|
|
364 |
|
|
Total other comprehensive (loss) income |
|
|
(2 |
) |
|
|
5,549 |
|
|
|
2,536 |
|
|
|
230,489 |
|
|
|
— |
|
|
|
238,572 |
|
|
Comprehensive income |
|
|
691,477 |
|
|
|
700,527 |
|
|
|
692,151 |
|
|
|
691,806 |
|
|
|
(1,839,443 |
) |
|
|
936,518 |
|
|
Less: Comprehensive income attributable to non-controlling interests |
|
|
— |
|
|
|
— |
|
|
|
— |
|
|
|
6,879 |
|
|
|
— |
|
|
|
6,879 |
|
|
Comprehensive income attributable to CBRE Group, Inc. |
|
$ |
691,477 |
|
|
$ |
700,527 |
|
|
$ |
692,151 |
|
|
$ |
684,927 |
|
|
$ |
(1,839,443 |
) |
|
$ |
929,639 |
|
110
CBRE GROUP, INC.
NOTES TO CONSOLIDATED FINANCIAL STATEMENTS—(Continued)
CONDENSED CONSOLIDATING STATEMENT OF COMPREHENSIVE INCOME (LOSS)
FOR THE YEAR ENDED DECEMBER 31, 2016
(Dollars in thousands)
|
|
|
|
|
|
|
CBRE |
|
|
Guarantor |
|
|
Nonguarantor |
|
|
|
|
|
|
Consolidated |
|
||||
|
|
|
Parent |
|
|
Services |
|
|
Subsidiaries |
|
|
Subsidiaries |
|
|
Eliminations |
|
|
Total |
|
||||||
|
Net income |
|
$ |
571,973 |
|
|
$ |
575,061 |
|
|
$ |
603,071 |
|
|
$ |
253,881 |
|
|
$ |
(1,419,922 |
) |
|
$ |
584,064 |
|
|
Other comprehensive income (loss): |
|
|
|
|
|
|
|
|
|
|
|
|
|
|
|
|
|
|
|
|
|
|
|
|
|
Foreign currency translation loss |
|
|
— |
|
|
|
— |
|
|
|
— |
|
|
|
(235,278 |
) |
|
|
— |
|
|
|
(235,278 |
) |
|
Amounts reclassified from accumulated other comprehensive loss to interest expense, net |
|
|
— |
|
|
|
6,839 |
|
|
|
— |
|
|
|
— |
|
|
|
— |
|
|
|
6,839 |
|
|
Unrealized losses on interest rate swaps, net |
|
|
— |
|
|
|
(1,431 |
) |
|
|
— |
|
|
|
— |
|
|
|
— |
|
|
|
(1,431 |
) |
|
Unrealized holding gains on available for sale securities, net |
|
|
— |
|
|
|
— |
|
|
|
180 |
|
|
|
204 |
|
|
|
— |
|
|
|
384 |
|
|
Pension liability adjustments, net |
|
|
— |
|
|
|
— |
|
|
|
— |
|
|
|
(63,749 |
) |
|
|
— |
|
|
|
(63,749 |
) |
|
Other, net |
|
|
— |
|
|
|
— |
|
|
|
(759 |
) |
|
|
(11,332 |
) |
|
|
— |
|
|
|
(12,091 |
) |
|
Total other comprehensive income (loss) |
|
|
— |
|
|
|
5,408 |
|
|
|
(579 |
) |
|
|
(310,155 |
) |
|
|
— |
|
|
|
(305,326 |
) |
|
Comprehensive income (loss) |
|
|
571,973 |
|
|
|
580,469 |
|
|
|
602,492 |
|
|
|
(56,274 |
) |
|
|
(1,419,922 |
) |
|
|
278,738 |
|
|
Less: Comprehensive income attributable to non-controlling interests |
|
|
— |
|
|
|
— |
|
|
|
— |
|
|
|
12,108 |
|
|
|
— |
|
|
|
12,108 |
|
|
Comprehensive income (loss) attributable to CBRE Group, Inc. |
|
$ |
571,973 |
|
|
$ |
580,469 |
|
|
$ |
602,492 |
|
|
$ |
(68,382 |
) |
|
$ |
(1,419,922 |
) |
|
$ |
266,630 |
|
111
CBRE GROUP, INC.
NOTES TO CONSOLIDATED FINANCIAL STATEMENTS—(Continued)
CONDENSED CONSOLIDATING STATEMENT OF COMPREHENSIVE INCOME (LOSS)
FOR THE YEAR ENDED DECEMBER 31, 2015
(Dollars in thousands)
|
|
|
|
|
|
|
CBRE |
|
|
Guarantor |
|
|
Nonguarantor |
|
|
|
|
|
|
Consolidated |
|
||||
|
|
|
Parent |
|
|
Services |
|
|
Subsidiaries |
|
|
Subsidiaries |
|
|
Eliminations |
|
|
Total |
|
||||||
|
Net income |
|
$ |
547,132 |
|
|
$ |
588,769 |
|
|
$ |
598,996 |
|
|
$ |
163,468 |
|
|
$ |
(1,339,488 |
) |
|
$ |
558,877 |
|
|
Other comprehensive loss: |
|
|
|
|
|
|
|
|
|
|
|
|
|
|
|
|
|
|
|
|
|
|
|
|
|
Foreign currency translation loss |
|
|
— |
|
|
|
— |
|
|
|
— |
|
|
|
(164,350 |
) |
|
|
— |
|
|
|
(164,350 |
) |
|
Fees associated with termination of interest rate swaps, net |
|
|
— |
|
|
|
(3,908 |
) |
|
|
— |
|
|
|
— |
|
|
|
— |
|
|
|
(3,908 |
) |
|
Amounts reclassified from accumulated other comprehensive loss to interest expense, net |
|
|
— |
|
|
|
7,680 |
|
|
|
— |
|
|
|
— |
|
|
|
— |
|
|
|
7,680 |
|
|
Unrealized losses on interest rate swaps, net |
|
|
— |
|
|
|
(4,107 |
) |
|
|
— |
|
|
|
— |
|
|
|
— |
|
|
|
(4,107 |
) |
|
Unrealized holding losses on available for sale securities, net |
|
|
— |
|
|
|
— |
|
|
|
(674 |
) |
|
|
(31 |
) |
|
|
— |
|
|
|
(705 |
) |
|
Pension liability adjustments, net |
|
|
— |
|
|
|
— |
|
|
|
— |
|
|
|
3,741 |
|
|
|
— |
|
|
|
3,741 |
|
|
Other, net |
|
|
— |
|
|
|
— |
|
|
|
3 |
|
|
|
— |
|
|
|
— |
|
|
|
3 |
|
|
Total other comprehensive loss |
|
|
— |
|
|
|
(335 |
) |
|
|
(671 |
) |
|
|
(160,640 |
) |
|
|
— |
|
|
|
(161,646 |
) |
|
Comprehensive income |
|
|
547,132 |
|
|
|
588,434 |
|
|
|
598,325 |
|
|
|
2,828 |
|
|
|
(1,339,488 |
) |
|
|
397,231 |
|
|
Less: Comprehensive income attributable to non-controlling interests |
|
|
— |
|
|
|
— |
|
|
|
— |
|
|
|
11,754 |
|
|
|
— |
|
|
|
11,754 |
|
|
Comprehensive income (loss) attributable to CBRE Group, Inc. |
|
$ |
547,132 |
|
|
$ |
588,434 |
|
|
$ |
598,325 |
|
|
$ |
(8,926 |
) |
|
$ |
(1,339,488 |
) |
|
$ |
385,477 |
|
112
CBRE GROUP, INC.
NOTES TO CONSOLIDATED FINANCIAL STATEMENTS—(Continued)
CONDENSED CONSOLIDATING STATEMENT OF CASH FLOWS
FOR THE YEAR ENDED DECEMBER 31, 2017
(Dollars in thousands)
|
|
|
|
|
|
|
CBRE |
|
|
Guarantor |
|
|
Nonguarantor |
|
|
Consolidated |
|
||||
|
|
|
Parent |
|
|
Services |
|
|
Subsidiaries |
|
|
Subsidiaries |
|
|
Total |
|
|||||
|
CASH FLOWS PROVIDED BY OPERATING ACTIVITIES: |
|
$ |
89,341 |
|
|
$ |
37,990 |
|
|
$ |
241,015 |
|
|
$ |
342,159 |
|
|
$ |
710,505 |
|
|
CASH FLOWS FROM INVESTING ACTIVITIES: |
|
|
|
|
|
|
|
|
|
|
|
|
|
|
|
|
|
|
|
|
|
Capital expenditures |
|
|
— |
|
|
|
— |
|
|
|
(121,347 |
) |
|
|
(56,695 |
) |
|
|
(178,042 |
) |
|
Acquisition of businesses (other than GWS) , including net assets acquired, intangibles and goodwill, net of cash acquired |
|
|
— |
|
|
|
— |
|
|
|
(107,102 |
) |
|
|
(35,331 |
) |
|
|
(142,433 |
) |
|
Contributions to unconsolidated subsidiaries |
|
|
— |
|
|
|
— |
|
|
|
(63,119 |
) |
|
|
(5,581 |
) |
|
|
(68,700 |
) |
|
Distributions from unconsolidated subsidiaries |
|
|
— |
|
|
|
— |
|
|
|
236,806 |
|
|
|
10,768 |
|
|
|
247,574 |
|
|
Decrease (Increase) in restricted cash |
|
|
— |
|
|
|
— |
|
|
|
4,872 |
|
|
|
(3,591 |
) |
|
|
1,281 |
|
|
Purchase of available for sale securities |
|
|
— |
|
|
|
— |
|
|
|
(34,864 |
) |
|
|
— |
|
|
|
(34,864 |
) |
|
Proceeds from the sale of available for sale securities |
|
|
— |
|
|
|
— |
|
|
|
31,377 |
|
|
|
— |
|
|
|
31,377 |
|
|
Other investing activities, net |
|
|
— |
|
|
|
— |
|
|
|
1,968 |
|
|
|
424 |
|
|
|
2,392 |
|
|
Net cash used in investing activities |
|
|
— |
|
|
|
— |
|
|
|
(51,409 |
) |
|
|
(90,006 |
) |
|
|
(141,415 |
) |
|
CASH FLOWS FROM FINANCING ACTIVITIES: |
|
|
|
|
|
|
|
|
|
|
|
|
|
|
|
|
|
|
|
|
|
Proceeds from senior term loans |
|
|
— |
|
|
|
200,000 |
|
|
|
— |
|
|
|
— |
|
|
|
200,000 |
|
|
Repayment of senior term loans |
|
|
— |
|
|
|
(751,876 |
) |
|
|
— |
|
|
|
— |
|
|
|
(751,876 |
) |
|
Proceeds from revolving credit facility |
|
|
— |
|
|
|
1,521,000 |
|
|
|
— |
|
|
|
— |
|
|
|
1,521,000 |
|
|
Repayment of revolving credit facility |
|
|
— |
|
|
|
(1,521,000 |
) |
|
|
— |
|
|
|
— |
|
|
|
(1,521,000 |
) |
|
Proceeds from notes payable on real estate held for investment |
|
|
— |
|
|
|
— |
|
|
|
— |
|
|
|
137 |
|
|
|
137 |
|
|
Repayment of notes payable on real estate held for investment |
|
|
— |
|
|
|
— |
|
|
|
— |
|
|
|
(1,779 |
) |
|
|
(1,779 |
) |
|
Proceeds from notes payable on real estate held for sale and under development |
|
|
— |
|
|
|
— |
|
|
|
— |
|
|
|
4,196 |
|
|
|
4,196 |
|
|
Repayment of notes payable on real estate held for sale and under development |
|
|
— |
|
|
|
— |
|
|
|
— |
|
|
|
(10,777 |
) |
|
|
(10,777 |
) |
|
Units repurchased for payment of taxes on equity awards |
|
|
(29,549 |
) |
|
|
— |
|
|
|
— |
|
|
|
— |
|
|
|
(29,549 |
) |
|
Non-controlling interest contributions |
|
|
— |
|
|
|
— |
|
|
|
— |
|
|
|
5,301 |
|
|
|
5,301 |
|
|
Non-controlling interest distributions |
|
|
— |
|
|
|
— |
|
|
|
— |
|
|
|
(8,715 |
) |
|
|
(8,715 |
) |
|
Payment of financing costs |
|
|
— |
|
|
|
(7,978 |
) |
|
|
— |
|
|
|
(21 |
) |
|
|
(7,999 |
) |
|
(Increase) decrease in intercompany receivables, net |
|
|
(60,271 |
) |
|
|
520,579 |
|
|
|
(338,534 |
) |
|
|
(121,774 |
) |
|
|
— |
|
|
Other financing activities, net |
|
|
479 |
|
|
|
— |
|
|
|
(3,145 |
) |
|
|
(9 |
) |
|
|
(2,675 |
) |
|
Net cash used in financing activities |
|
|
(89,341 |
) |
|
|
(39,275 |
) |
|
|
(341,679 |
) |
|
|
(133,441 |
) |
|
|
(603,736 |
) |
|
Effect of currency exchange rate changes on cash and cash equivalents |
|
|
— |
|
|
|
— |
|
|
|
— |
|
|
|
23,844 |
|
|
|
23,844 |
|
|
NET (DECREASE) INCREASE IN CASH AND CASH EQUIVALENTS |
|
|
— |
|
|
|
(1,285 |
) |
|
|
(152,073 |
) |
|
|
142,556 |
|
|
|
(10,802 |
) |
|
CASH AND CASH EQUIVALENTS, AT BEGINNING OF PERIOD |
|
|
7 |
|
|
|
16,889 |
|
|
|
264,121 |
|
|
|
481,559 |
|
|
|
762,576 |
|
|
CASH AND CASH EQUIVALENTS, AT END OF PERIOD |
|
$ |
7 |
|
|
$ |
15,604 |
|
|
$ |
112,048 |
|
|
$ |
624,115 |
|
|
$ |
751,774 |
|
|
SUPPLEMENTAL DISCLOSURES OF CASH FLOW INFORMATION: |
|
|
|
|
|
|
|
|
|
|
|
|
|
|
|
|
|
|
|
|
|
Cash paid during the period for: |
|
|
|
|
|
|
|
|
|
|
|
|
|
|
|
|
|
|
|
|
|
Interest |
|
$ |
— |
|
|
$ |
117,072 |
|
|
$ |
— |
|
|
$ |
92 |
|
|
$ |
117,164 |
|
|
Income taxes, net |
|
$ |
— |
|
|
$ |
— |
|
|
$ |
198,520 |
|
|
$ |
158,477 |
|
|
$ |
356,997 |
|
113
CBRE GROUP, INC.
NOTES TO CONSOLIDATED FINANCIAL STATEMENTS—(Continued)
CONDENSED CONSOLIDATING STATEMENT OF CASH FLOWS
FOR THE YEAR ENDED DECEMBER 31, 2016
(Dollars in thousands)
|
|
|
|
|
|
|
CBRE |
|
|
Guarantor |
|
|
Nonguarantor |
|
|
Consolidated |
|
||||
|
|
|
Parent |
|
|
Services |
|
|
Subsidiaries |
|
|
Subsidiaries |
|
|
Total |
|
|||||
|
CASH FLOWS PROVIDED BY (USED IN) OPERATING ACTIVITIES: |
|
$ |
84,393 |
|
|
$ |
(23,643 |
) |
|
$ |
212,841 |
|
|
$ |
176,724 |
|
|
$ |
450,315 |
|
|
CASH FLOWS FROM INVESTING ACTIVITIES: |
|
|
|
|
|
|
|
|
|
|
|
|
|
|
|
|
|
|
|
|
|
Capital expenditures |
|
|
— |
|
|
|
— |
|
|
|
(115,049 |
) |
|
|
(76,156 |
) |
|
|
(191,205 |
) |
|
Acquisition of GWS, including net assets acquired, intangibles and goodwill |
|
|
— |
|
|
|
— |
|
|
|
3,256 |
|
|
|
(13,733 |
) |
|
|
(10,477 |
) |
|
Acquisition of businesses (other than GWS), including net assets acquired, intangibles and goodwill, net of cash acquired |
|
|
— |
|
|
|
— |
|
|
|
(6,572 |
) |
|
|
(25,062 |
) |
|
|
(31,634 |
) |
|
Contributions to unconsolidated subsidiaries |
|
|
— |
|
|
|
— |
|
|
|
(47,192 |
) |
|
|
(19,624 |
) |
|
|
(66,816 |
) |
|
Distributions from unconsolidated subsidiaries |
|
|
— |
|
|
|
— |
|
|
|
206,011 |
|
|
|
7,435 |
|
|
|
213,446 |
|
|
Net proceeds from disposition of real estate held for investment |
|
|
— |
|
|
|
— |
|
|
|
— |
|
|
|
44,326 |
|
|
|
44,326 |
|
|
Increase in restricted cash |
|
|
— |
|
|
|
— |
|
|
|
(546 |
) |
|
|
(2,006 |
) |
|
|
(2,552 |
) |
|
Purchase of available for sale securities |
|
|
— |
|
|
|
— |
|
|
|
(37,661 |
) |
|
|
— |
|
|
|
(37,661 |
) |
|
Proceeds from the sale of available for sale securities |
|
|
— |
|
|
|
— |
|
|
|
35,051 |
|
|
|
— |
|
|
|
35,051 |
|
|
Other investing activities, net |
|
|
— |
|
|
|
— |
|
|
|
19,178 |
|
|
|
20,905 |
|
|
|
40,083 |
|
|
Net cash provided by (used in) investing activities |
|
|
— |
|
|
|
— |
|
|
|
56,476 |
|
|
|
(63,915 |
) |
|
|
(7,439 |
) |
|
CASH FLOWS FROM FINANCING ACTIVITIES: |
|
|
|
|
|
|
|
|
|
|
|
|
|
|
|
|
|
|
|
|
|
Repayment of senior term loans |
|
|
— |
|
|
|
(136,250 |
) |
|
|
— |
|
|
|
— |
|
|
|
(136,250 |
) |
|
Proceeds from revolving credit facility |
|
|
— |
|
|
|
2,909,000 |
|
|
|
— |
|
|
|
— |
|
|
|
2,909,000 |
|
|
Repayment of revolving credit facility |
|
|
— |
|
|
|
(2,909,000 |
) |
|
|
— |
|
|
|
— |
|
|
|
(2,909,000 |
) |
|
Proceeds from notes payable on real estate held for investment |
|
|
— |
|
|
|
— |
|
|
|
— |
|
|
|
7,274 |
|
|
|
7,274 |
|
|
Repayment of notes payable on real estate held for investment |
|
|
— |
|
|
|
— |
|
|
|
— |
|
|
|
(33,944 |
) |
|
|
(33,944 |
) |
|
Proceeds from notes payable on real estate held for sale and under development |
|
|
— |
|
|
|
— |
|
|
|
— |
|
|
|
17,727 |
|
|
|
17,727 |
|
|
Repayment of notes payable on real estate held for sale and under development |
|
|
— |
|
|
|
— |
|
|
|
— |
|
|
|
(4,102 |
) |
|
|
(4,102 |
) |
|
Units repurchased for payment of taxes on equity awards |
|
|
(27,426 |
) |
|
|
— |
|
|
|
— |
|
|
|
— |
|
|
|
(27,426 |
) |
|
Non-controlling interest contributions |
|
|
— |
|
|
|
— |
|
|
|
— |
|
|
|
2,272 |
|
|
|
2,272 |
|
|
Non-controlling interest distributions |
|
|
— |
|
|
|
— |
|
|
|
— |
|
|
|
(19,133 |
) |
|
|
(19,133 |
) |
|
Payment of financing costs |
|
|
— |
|
|
|
(5,459 |
) |
|
|
— |
|
|
|
(159 |
) |
|
|
(5,618 |
) |
|
(Increase) decrease in intercompany receivables, net |
|
|
(57,880 |
) |
|
|
173,762 |
|
|
|
(151,433 |
) |
|
|
35,551 |
|
|
|
— |
|
|
Other financing activities, net |
|
|
915 |
|
|
|
— |
|
|
|
(1,173 |
) |
|
|
(185 |
) |
|
|
(443 |
) |
|
Net cash (used in) provided by financing activities |
|
|
(84,391 |
) |
|
|
32,053 |
|
|
|
(152,606 |
) |
|
|
5,301 |
|
|
|
(199,643 |
) |
|
Effect of currency exchange rate changes on cash and cash equivalents |
|
|
— |
|
|
|
— |
|
|
|
— |
|
|
|
(21,060 |
) |
|
|
(21,060 |
) |
|
NET INCREASE IN CASH AND CASH EQUIVALENTS |
|
|
2 |
|
|
|
8,410 |
|
|
|
116,711 |
|
|
|
97,050 |
|
|
|
222,173 |
|
|
CASH AND CASH EQUIVALENTS, AT BEGINNING OF PERIOD |
|
|
5 |
|
|
|
8,479 |
|
|
|
147,410 |
|
|
|
384,509 |
|
|
|
540,403 |
|
|
CASH AND CASH EQUIVALENTS, AT END OF PERIOD |
|
$ |
7 |
|
|
$ |
16,889 |
|
|
$ |
264,121 |
|
|
$ |
481,559 |
|
|
$ |
762,576 |
|
|
SUPPLEMENTAL DISCLOSURES OF CASH FLOW INFORMATION: |
|
|
|
|
|
|
|
|
|
|
|
|
|
|
|
|
|
|
|
|
|
Cash paid during the period for: |
|
|
|
|
|
|
|
|
|
|
|
|
|
|
|
|
|
|
|
|
|
Interest |
|
$ |
— |
|
|
$ |
122,605 |
|
|
$ |
— |
|
|
$ |
3,195 |
|
|
$ |
125,800 |
|
|
Income taxes, net |
|
$ |
— |
|
|
$ |
— |
|
|
$ |
174,164 |
|
|
$ |
120,684 |
|
|
$ |
294,848 |
|
114
CBRE GROUP, INC.
NOTES TO CONSOLIDATED FINANCIAL STATEMENTS—(Continued)
CONDENSED CONSOLIDATING STATEMENT OF CASH FLOWS
FOR THE YEAR ENDED DECEMBER 31, 2015
(Dollars in thousands)
|
|
|
|
|
|
|
CBRE |
|
|
Guarantor |
|
|
Nonguarantor |
|
|
Consolidated |
|
||||
|
|
|
Parent |
|
|
Services |
|
|
Subsidiaries |
|
|
Subsidiaries |
|
|
Total |
|
|||||
|
CASH FLOWS PROVIDED BY (USED IN) OPERATING ACTIVITIES: |
|
$ |
33,959 |
|
|
$ |
(7,477 |
) |
|
$ |
452,304 |
|
|
$ |
173,111 |
|
|
$ |
651,897 |
|
|
CASH FLOWS FROM INVESTING ACTIVITIES: |
|
|
|
|
|
|
|
|
|
|
|
|
|
|
|
|
|
|
|
|
|
Capital expenditures |
|
|
— |
|
|
|
— |
|
|
|
(84,933 |
) |
|
|
(54,531 |
) |
|
|
(139,464 |
) |
|
Acquisition of GWS, including net assets acquired, intangibles and goodwill, net of cash acquired |
|
|
— |
|
|
|
— |
|
|
|
(729,729 |
) |
|
|
(691,934 |
) |
|
|
(1,421,663 |
) |
|
Acquisition of businesses (other than GWS), including net assets acquired, intangibles and goodwill, net of cash acquired |
|
|
— |
|
|
|
— |
|
|
|
(153,690 |
) |
|
|
(7,416 |
) |
|
|
(161,106 |
) |
|
Contributions to unconsolidated subsidiaries |
|
|
— |
|
|
|
— |
|
|
|
(66,966 |
) |
|
|
(4,242 |
) |
|
|
(71,208 |
) |
|
Distributions from unconsolidated subsidiaries |
|
|
— |
|
|
|
— |
|
|
|
179,699 |
|
|
|
7,878 |
|
|
|
187,577 |
|
|
Net proceeds from disposition of real estate held for investment |
|
|
— |
|
|
|
— |
|
|
|
— |
|
|
|
3,584 |
|
|
|
3,584 |
|
|
Increase in restricted cash |
|
|
— |
|
|
|
— |
|
|
|
(5,791 |
) |
|
|
(43,221 |
) |
|
|
(49,012 |
) |
|
Purchase of available for sale securities |
|
|
— |
|
|
|
— |
|
|
|
(40,287 |
) |
|
|
— |
|
|
|
(40,287 |
) |
|
Proceeds from the sale of available for sale securities |
|
|
— |
|
|
|
— |
|
|
|
42,572 |
|
|
|
— |
|
|
|
42,572 |
|
|
Other investing activities, net |
|
|
— |
|
|
|
— |
|
|
|
16,172 |
|
|
|
13,876 |
|
|
|
30,048 |
|
|
Net cash used in investing activities |
|
|
— |
|
|
|
— |
|
|
|
(842,953 |
) |
|
|
(776,006 |
) |
|
|
(1,618,959 |
) |
|
CASH FLOWS FROM FINANCING ACTIVITIES: |
|
|
|
|
|
|
|
|
|
|
|
|
|
|
|
|
|
|
|
|
|
Proceeds from senior term loans |
|
|
— |
|
|
|
900,000 |
|
|
|
— |
|
|
|
— |
|
|
|
900,000 |
|
|
Repayment of senior term loans |
|
|
— |
|
|
|
(657,488 |
) |
|
|
— |
|
|
|
— |
|
|
|
(657,488 |
) |
|
Proceeds from revolving credit facility |
|
|
— |
|
|
|
2,643,500 |
|
|
|
— |
|
|
|
— |
|
|
|
2,643,500 |
|
|
Repayment of revolving credit facility |
|
|
— |
|
|
|
(2,643,500 |
) |
|
|
— |
|
|
|
(4,512 |
) |
|
|
(2,648,012 |
) |
|
Proceeds from issuance of 4.875% senior notes, net |
|
|
— |
|
|
|
595,440 |
|
|
|
— |
|
|
|
— |
|
|
|
595,440 |
|
|
Repayment of notes payable on real estate held for investment |
|
|
— |
|
|
|
— |
|
|
|
— |
|
|
|
(1,576 |
) |
|
|
(1,576 |
) |
|
Proceeds from notes payable on real estate held for sale and under development |
|
|
— |
|
|
|
— |
|
|
|
— |
|
|
|
20,879 |
|
|
|
20,879 |
|
|
Repayment of notes payable on real estate held for sale and under development |
|
|
— |
|
|
|
— |
|
|
|
— |
|
|
|
(1,186 |
) |
|
|
(1,186 |
) |
|
Shares and units repurchased for payment of taxes on equity awards |
|
|
(24,523 |
) |
|
|
— |
|
|
|
— |
|
|
|
— |
|
|
|
(24,523 |
) |
|
Non-controlling interest contributions |
|
|
— |
|
|
|
— |
|
|
|
— |
|
|
|
5,909 |
|
|
|
5,909 |
|
|
Non-controlling interest distributions |
|
|
— |
|
|
|
— |
|
|
|
— |
|
|
|
(16,582 |
) |
|
|
(16,582 |
) |
|
Payment of financing costs |
|
|
— |
|
|
|
(30,579 |
) |
|
|
— |
|
|
|
(85 |
) |
|
|
(30,664 |
) |
|
(Increase) decrease in intercompany receivables, net |
|
|
(19,238 |
) |
|
|
(809,679 |
) |
|
|
167,505 |
|
|
|
661,412 |
|
|
|
— |
|
|
Other financing activities, net |
|
|
9,802 |
|
|
|
— |
|
|
|
(3,549 |
) |
|
|
(2,402 |
) |
|
|
3,851 |
|
|
Net cash (used in) provided by financing activities |
|
|
(33,959 |
) |
|
|
(2,306 |
) |
|
|
163,956 |
|
|
|
661,857 |
|
|
|
789,548 |
|
|
Effect of currency exchange rate changes on cash and cash equivalents |
|
|
— |
|
|
|
— |
|
|
|
— |
|
|
|
(22,967 |
) |
|
|
(22,967 |
) |
|
NET (DECREASE) INCREASE IN CASH AND CASH EQUIVALENTS |
|
|
— |
|
|
|
(9,783 |
) |
|
|
(226,693 |
) |
|
|
35,995 |
|
|
|
(200,481 |
) |
|
CASH AND CASH EQUIVALENTS, AT BEGINNING OF PERIOD |
|
|
5 |
|
|
|
18,262 |
|
|
|
374,103 |
|
|
|
348,514 |
|
|
|
740,884 |
|
|
CASH AND CASH EQUIVALENTS, AT END OF PERIOD |
|
$ |
5 |
|
|
$ |
8,479 |
|
|
$ |
147,410 |
|
|
$ |
384,509 |
|
|
$ |
540,403 |
|
|
SUPPLEMENTAL DISCLOSURES OF CASH FLOW INFORMATION: |
|
|
|
|
|
|
|
|
|
|
|
|
|
|
|
|
|
|
|
|
|
Cash paid during the period for: |
|
|
|
|
|
|
|
|
|
|
|
|
|
|
|
|
|
|
|
|
|
Interest |
|
$ |
— |
|
|
$ |
86,562 |
|
|
$ |
126 |
|
|
$ |
1,390 |
|
|
$ |
88,078 |
|
|
Income taxes, net |
|
$ |
— |
|
|
$ |
— |
|
|
$ |
179,418 |
|
|
$ |
106,312 |
|
|
$ |
285,730 |
|
115
CBRE GROUP, INC.
NOTES TO CONSOLIDATED FINANCIAL STATEMENTS—(Continued)
In February 2018, we gave the notice required under the indenture governing our 5.00% senior notes of our intent to redeem such notes in full on March 15, 2018. In connection with this early redemption, we will incur charges of $28.0 million, including a premium of $20.0 million and the write-off of $8.0 million of unamortized deferred financing costs. We intend to fund this redemption with $550.0 million of borrowings from our tranche A term loan facility and borrowings from our revolving credit facility under the 2017 Credit Agreement as well as with cash on hand.
116
QUARTERLY RESULTS OF OPERATIONS
(Unaudited)
|
|
|
Three Months |
|
|
Three Months |
|
|
Three Months |
|
|
Three Months |
|
||||
|
|
|
Ended |
|
|
Ended |
|
|
Ended |
|
|
Ended |
|
||||
|
|
|
December 31, |
|
|
September 30, |
|
|
June 30, |
|
|
March 31, |
|
||||
|
|
|
|
2017 |
|
|
|
2017 |
|
|
|
2017 |
|
|
|
2017 |
|
|
|
|
(Dollars in thousands, except share data) |
|
|||||||||||||
|
Revenue |
|
$ |
4,336,212 |
|
|
$ |
3,549,977 |
|
|
$ |
3,342,215 |
|
|
$ |
2,981,204 |
|
|
Operating income |
|
$ |
418,718 |
|
|
$ |
235,291 |
|
|
$ |
222,191 |
|
|
$ |
195,242 |
|
|
Net income attributable to CBRE Group, Inc. |
|
$ |
168,400 |
|
|
$ |
196,317 |
|
|
$ |
197,165 |
|
|
$ |
129,597 |
|
|
Basic income per share |
|
$ |
0.50 |
|
|
$ |
0.58 |
|
|
$ |
0.59 |
|
|
$ |
0.38 |
|
|
Weighted average shares outstanding for basic income per share |
|
|
338,777,028 |
|
|
|
337,948,324 |
|
|
|
336,975,149 |
|
|
|
336,907,836 |
|
|
Diluted income per share |
|
$ |
0.49 |
|
|
$ |
0.58 |
|
|
$ |
0.58 |
|
|
$ |
0.38 |
|
|
Weighted average shares outstanding for diluted income per share |
|
|
341,728,078 |
|
|
|
341,186,431 |
|
|
|
340,882,603 |
|
|
|
339,690,579 |
|
|
|
|
|
|
|
|
|
|
|
|
|
|
|
|
|
|
|
|
|
|
Three Months |
|
|
Three Months |
|
|
Three Months |
|
|
Three Months |
|
||||
|
|
|
Ended |
|
|
Ended |
|
|
Ended |
|
|
Ended |
|
||||
|
|
|
December 31, |
|
|
September 30, |
|
|
June 30, |
|
|
March 31, |
|
||||
|
|
|
|
2016 |
|
|
|
2016 |
|
|
|
2016 |
|
|
|
2016 |
|
|
|
|
(Dollars in thousands, except share data) |
|
|||||||||||||
|
Revenue |
|
$ |
3,823,831 |
|
|
$ |
3,193,487 |
|
|
$ |
3,207,537 |
|
|
$ |
2,846,734 |
|
|
Operating income |
|
$ |
352,821 |
|
|
$ |
172,492 |
|
|
$ |
182,594 |
|
|
$ |
107,580 |
|
|
Net income attributable to CBRE Group, Inc. |
|
$ |
263,975 |
|
|
$ |
104,163 |
|
|
$ |
121,668 |
|
|
$ |
82,167 |
|
|
Basic income per share |
|
$ |
0.78 |
|
|
$ |
0.31 |
|
|
$ |
0.36 |
|
|
$ |
0.25 |
|
|
Weighted average shares outstanding for basic income per share |
|
|
336,843,925 |
|
|
|
335,770,122 |
|
|
|
335,076,746 |
|
|
|
333,992,935 |
|
|
Diluted income per share |
|
$ |
0.78 |
|
|
$ |
0.31 |
|
|
$ |
0.36 |
|
|
$ |
0.24 |
|
|
Weighted average shares outstanding for diluted income per share |
|
|
338,839,469 |
|
|
|
338,488,975 |
|
|
|
338,080,641 |
|
|
|
337,506,232 |
|
117
None.
Management’s Report on Internal Control Over Financial Reporting
Our management is responsible for establishing and maintaining adequate internal control over financial reporting, as such term is defined in Securities Exchange Act Rules 13a-15(f), including maintenance of (i) records that in reasonable detail accurately and fairly reflect the transactions and dispositions of our assets, and (ii) policies and procedures that provide reasonable assurance that (a) transactions are recorded as necessary to permit preparation of financial statements in accordance with accounting principles generally accepted in the United States of America, (b) our receipts and expenditures are being made only in accordance with authorizations of management and our board of directors and (c) we will prevent or timely detect unauthorized acquisition, use, or disposition of our assets that could have a material effect on the financial statements.
Internal control over financial reporting cannot provide absolute assurance of achieving financial reporting objectives because of the inherent limitations of any system of internal control. Internal control over financial reporting is a process that involves human diligence and compliance and is subject to lapses of judgment and breakdowns resulting from human failures. Internal control over financial reporting also can be circumvented by collusion or improper overriding of controls. As a result of such limitations, there is risk that material misstatements may not be prevented or detected on a timely basis by internal control over financial reporting. However, these inherent limitations are known features of the financial reporting process. Therefore, it is possible to design into the process safeguards to reduce, though not eliminate, this risk.
Under the supervision and with the participation of our management, including our Chief Executive Officer and Chief Financial Officer, we conducted an evaluation of the effectiveness of our internal control over financial reporting based on the criteria established in Internal Control-Integrated Framework (2013) issued by the Committee of Sponsoring Organizations (COSO) of the Treadway Commission. Based on our evaluation under the COSO framework, our management concluded that our internal control over financial reporting was effective as of December 31, 2017. The effectiveness of internal control over financial reporting as of December 31, 2017 has been audited by KPMG LLP, an independent registered public accounting firm, as stated in their report which is included herein.
Disclosure Controls and Procedures
Rule 13a-15 of the Securities and Exchange Act of 1934, as amended, requires that we conduct an evaluation of the effectiveness of our disclosure controls and procedures as of the end of the period covered by this annual report, and we have a disclosure policy in furtherance of the same. This evaluation is designed to ensure that all corporate disclosure is complete and accurate in all material respects. The evaluation is further designed to ensure that all information required to be disclosed in our SEC reports is accumulated and communicated to management to allow timely decisions regarding required disclosures and recorded, processed, summarized and reported within the time periods and in the manner specified in the SEC’s rules and forms. Any controls and procedures, no matter how well designed and operated, can provide only reasonable assurance of achieving the desired control objectives. Our Chief Executive Officer and Chief Financial Officer supervise and participate in this evaluation, and they are assisted by our Chief Accounting Officer and other members of our Disclosure Committee. In addition to our Chief Accounting Officer, our Disclosure Committee consists of our General Counsel, our chief communication officer, our corporate controller, our head of Global Assurance and Advisory, our senior officers of significant business lines and other select employees.
We conducted the required evaluation, and our Chief Executive Officer and Chief Financial Officer have concluded that our disclosure controls and procedures (as defined by Securities Exchange Act Rule 13a-15(e)) were effective as of December 31, 2017 to accomplish their objectives at the reasonable assurance level.
118
Changes in Internal Control Over Financial Reporting
No changes in our internal control over financial reporting occurred during the fiscal quarter ended December 31, 2017 that have materially affected, or are reasonably likely to materially affect, our internal control over financial reporting.
None.
The information under the headings “Elect Directors,” “Corporate Governance,” “Executive Management” and “Stock Ownership” in the definitive proxy statement for our 2018 Annual Meeting of Stockholders is incorporated herein by reference.
We are filing the certifications by the Chief Executive Officer and Chief Financial Officer required under Section 302 of the Sarbanes-Oxley Act as exhibits to this Annual Report on Form 10-K.
The information contained under the headings “Corporate Governance,” “Compensation Discussion and Analysis” and “Executive Compensation” in the definitive proxy statement for our 2018 Annual Meeting of Stockholders is incorporated herein by reference.
|
Item 12. |
Security Ownership of Certain Beneficial Owners and Management and Related Stockholder Matters |
Equity Compensation Plan Information
The following table summarizes information about our equity compensation plans as of December 31, 2017. All outstanding awards relate to our Class A common stock.
|
|
|
Number of Securities to be Issued upon Exercise of Outstanding Options, Warrants and Rights |
|
|
Weighted-average Exercise Price of Outstanding Options, Warrants and Rights |
|
|
Number of Securities Remaining Available for Future Issuance under Equity Compensation Plans (Excluding Securities Reflected in Column ( a )) |
|
|||
|
|
|
( a ) |
|
|
( b ) |
|
|
( c ) |
|
|||
|
Equity compensation plans approved by security holders (1) |
|
|
10,188,426 |
|
|
$ |
0.01 |
|
|
|
5,573,842 |
|
|
Equity compensation plans not approved by security holders |
|
|
— |
|
|
|
— |
|
|
|
— |
|
|
Total |
|
|
10,188,426 |
|
|
$ |
0.01 |
|
|
|
5,573,842 |
|
|
(1) |
Consists of stock options and restricted stock units (“RSUs”) issued under our 2017 Equity Incentive Plan (the “2017 Plan”), 2012 Equity Incentive Plan (the “2012 Plan”) and our Second Amended and Restated 2004 Stock Incentive Plan (the “2004 Plan”). Our 2004 Plan terminated in May 2012 in connection with the adoption of the 2012 Plan, and our 2012 Plan terminated in May 2017 in connection with the adoption of the 2017 Plan. We cannot issue any further awards under the 2004 Plan and the 2012 Plan. |
119
|
|
• |
The figures in the foregoing table include: |
|
|
o |
5,834,580 RSUs that are performance vesting in nature, with the figures in the table reflecting the maximum number of RSUs that may be issued if all performance-based targets are satisfied; |
|
|
o |
4,348,188 RSUs that are time vesting in nature; and |
|
|
o |
5,658 shares issuable upon the exercise of outstanding options. |
|
|
• |
Excluding all outstanding RSUs (which can be exercised for no consideration), the weighted-average exercise price of outstanding options, warrants and rights indicated in the table above would increase to $26.50 per share. |
We incorporate herein by reference the information contained under the heading “Stock Ownership” in the definitive proxy statement for our 2018 Annual Meeting of Stockholders.
The information contained under the headings “Elect Directors,” “Corporate Governance” and “Related-Party Transactions” in the definitive proxy statement for our 2018 Annual Meeting of Stockholders is incorporated herein by reference.
The information contained under the heading “Audit and Other Fees” in the definitive proxy statement for our 2018 Annual Meeting of Stockholders is incorporated herein by reference.
|
|
1. |
Financial Statements |
See Index to Consolidated Financial Statements set forth on page 54.
|
|
2. |
Financial Statement Schedules |
See Schedule II on page 121.
|
|
3. |
Exhibits |
See Exhibit Index beginning on page 122 hereof.
Not applicable.
120
SCHEDULE II – VALUATION AND QUALIFYING ACCOUNTS
(Dollars in thousands)
|
|
|
Allowance for |
|
|
|
|
|
Doubtful Accounts |
|
|
|
Balance, December 31, 2014 |
|
$ |
41,831 |
|
|
Charges to expense |
|
|
10,211 |
|
|
Write-offs, payments and other |
|
|
(5,436 |
) |
|
Balance, December 31, 2015 |
|
|
46,606 |
|
|
Charges to expense |
|
|
4,711 |
|
|
Write-offs, payments and other |
|
|
(11,848 |
) |
|
Balance, December 31, 2016 |
|
|
39,469 |
|
|
Charges to expense |
|
|
8,044 |
|
|
Write-offs, payments and other |
|
|
(724 |
) |
|
Balance, December 31, 2017 |
|
$ |
46,789 |
|
121
|
|
|
|
|
Incorporated by Reference |
||||||||
|
Exhibit |
|
Exhibit Description |
|
Form |
|
SEC File |
|
Exhibit |
|
Filing Date |
|
Filed |
|
|
|
|
|
|
|
|
|
|
|
|
|
|
|
2.1(a) |
|
|
8-K |
|
001-32205 |
|
2.02 |
|
02/18/2011 |
|
|
|
|
|
|
|
|
|
|
|
|
|
|
|
|
|
|
2.1(b) |
|
|
10-Q |
|
001-32205 |
|
2.3 |
|
08/09/2011 |
|
|
|
|
|
|
|
|
|
|
|
|
|
|
|
|
|
|
2.1(c) |
|
|
8-K |
|
001-32205 |
|
2.03 |
|
10/07/2011 |
|
|
|
|
|
|
|
|
|
|
|
|
|
|
|
|
|
|
2.1(d) |
|
|
8-K |
|
001-32205 |
|
2.04 |
|
11/04/2011 |
|
|
|
|
|
|
|
|
|
|
|
|
|
|
|
|
|
|
2.1(e) |
|
|
10-K |
|
001-32205 |
|
2.1(e) |
|
03/01/2017 |
|
|
|
|
|
|
|
|
|
|
|
|
|
|
|
|
|
|
2.2 |
|
|
8-K |
|
001-32205 |
|
1.01 |
|
11/13/2013 |
|
|
|
|
|
|
|
|
|
|
|
|
|
|
|
|
|
|
2.3 |
|
|
8-K |
|
001-32205 |
|
2.1 |
|
04/03/2015 |
|
|
|
|
|
|
|
|
|
|
|
|
|
|
|
|
|
|
3.1 |
|
Amended and Restated Certificate of Incorporation of CBRE Group, Inc. |
|
8-K |
|
001-32205 |
|
3.1 |
|
05/19/2016 |
|
|
|
|
|
|
|
|
|
|
|
|
|
|
|
|
|
3.2 |
|
|
10-Q |
|
001-32205 |
|
3.2 |
|
05/10/2017 |
|
|
|
|
|
|
|
|
|
|
|
|
|
|
|
|
|
|
4.1 |
|
Form of Class A common stock certificate of CBRE Group, Inc. |
|
10-Q |
|
001-32205 |
|
4.1 |
|
08/09/2017 |
|
|
|
|
|
|
|
|
|
|
|
|
|
|
|
|
122
|
|
|
|
|
Incorporated by Reference |
||||||||
|
Exhibit |
|
Exhibit Description |
|
Form |
|
SEC File |
|
Exhibit |
|
Filing Date |
|
Filed |
|
|
|
|
|
|
|
|
|
|
|
|
|
|
|
|
|
SC-13D |
|
005-61805 |
|
3 |
|
07/30/2001 |
|
|
||
|
|
|
|
|
|
|
|
|
|
|
|
|
|
|
4.2(b) |
|
|
S-1/A |
|
333-112867 |
|
4.2(b) |
|
04/30/2004 |
|
|
|
|
|
|
|
|
|
|
|
|
|
|
|
|
|
|
4.2(c) |
|
|
S-1/A |
|
333-120445 |
|
4.2(c) |
|
11/24/2004 |
|
|
|
|
|
|
|
|
|
|
|
|
|
|
|
|
|
|
4.2(d) |
|
|
8-K |
|
001-32205 |
|
4.1 |
|
08/02/2005 |
|
|
|
|
|
|
|
|
|
|
|
|
|
|
|
|
|
|
4.2(e) |
|
|
8-K |
|
001-32205 |
|
4.1 |
|
03/24/2017 |
|
|
|
|
|
|
|
|
|
|
|
|
|
|
|
|
|
|
4.3(a) |
|
|
10-Q |
|
001-32205 |
|
4.4(a) |
|
05/10/2013 |
|
|
|
|
|
|
|
|
|
|
|
|
|
|
|
|
|
|
4.3(b) |
|
|
10-Q |
|
001-32205 |
|
4.4(b) |
|
05/10/2013 |
|
|
|
|
|
|
|
|
|
|
|
|
|
|
|
|
|
123
|
|
|
|
|
Incorporated by Reference |
||||||||
|
Exhibit |
|
Exhibit Description |
|
Form |
|
SEC File |
|
Exhibit |
|
Filing Date |
|
Filed |
|
|
|
|
|
|
|
|
|
|
|
|
|
|
|
|
|
S-3ASR |
|
333-201126 |
|
4.3(c) |
|
12/19/2014 |
|
|
||
|
|
|
|
|
|
|
|
|
|
|
|
|
|
|
4.3(d) |
|
|
8-K |
|
001-32205 |
|
4.3 |
|
04/16/2013 |
|
|
|
|
|
|
|
|
|
|
|
|
|
|
|
|
|
|
4.3(e) |
|
|
8-K |
|
001-32205 |
|
4.1 |
|
09/26/2014 |
|
|
|
|
|
|
|
|
|
|
|
|
|
|
|
|
|
|
4.3(f) |
|
|
8-K |
|
001-32205 |
|
4.1 |
|
12/12/2014 |
|
|
|
|
|
|
|
|
|
|
|
|
|
|
|
|
|
|
4.3(g) |
|
|
S-3ASR |
|
333-201126 |
|
4.3(h) |
|
12/19/2014 |
|
|
|
|
|
|
|
|
|
|
|
|
|
|
|
|
|
|
4.3(h) |
|
|
8-K |
|
001-32205 |
|
4.2 |
|
08/13/2015 |
|
|
|
|
|
|
|
|
|
|
|
|
|
|
|
|
|
|
4.3(i) |
|
|
8-K |
|
001-32205 |
|
4.1 |
|
09/25/2015 |
|
|
|
|
|
|
|
|
|
|
|
|
|
|
|
|
|
124
|
|
|
|
|
Incorporated by Reference |
||||||||
|
Exhibit |
|
Exhibit Description |
|
Form |
|
SEC File |
|
Exhibit |
|
Filing Date |
|
Filed |
|
|
|
|
|
|
|
|
|
|
|
|
|
|
|
|
|
8-K |
|
001-32205 |
|
10.1 |
|
01/13/2015 |
|
|
||
|
|
|
|
|
|
|
|
|
|
|
|
|
|
|
10.2 |
|
|
8-K |
|
001-32205 |
|
10.1 |
|
05/29/2015 |
|
|
|
|
|
|
|
|
|
|
|
|
|
|
|
|
|
|
10.3 |
|
|
8-K |
|
001-32205 |
|
10.1 |
|
09/09/2015 |
|
|
|
|
|
|
|
|
|
|
|
|
|
|
|
|
|
|
10.4 |
|
|
8-K |
|
001-32205 |
|
10.1 |
|
03/25/2016 |
|
|
|
|
|
|
|
|
|
|
|
|
|
|
|
|
|
|
10.5 |
|
|
8-K |
|
001-32205 |
|
10.2 |
|
01/13/2015 |
|
|
|
|
|
|
|
|
|
|
|
|
|
|
|
|
|
|
10.6 |
|
|
8-K |
|
001-32205 |
|
10.1 |
|
09/25/2015 |
|
|
|
|
|
|
|
|
|
|
|
|
|
|
|
|
|
125
|
|
|
|
|
Incorporated by Reference |
||||||||
|
Exhibit |
|
Exhibit Description |
|
Form |
|
SEC File |
|
Exhibit |
|
Filing Date |
|
Filed |
|
|
|
|
|
|
|
|
|
|
|
|
|
|
|
|
|
8-K |
|
001-32205 |
|
10.1 |
|
11/01/2017 |
|
|
||
|
|
|
|
|
|
|
|
|
|
|
|
|
|
|
10.8 |
|
|
8-K |
|
001-32205 |
|
10.2 |
|
11/01/2017 |
|
|
|
|
|
|
|
|
|
|
|
|
|
|
|
|
|
|
10.9 |
|
|
10-K |
|
001-32205 |
|
10.3 |
|
03/03/2014 |
|
|
|
|
|
|
|
|
|
|
|
|
|
|
|
|
|
|
10.10 |
|
|
8-K |
|
001-32205 |
|
10.1 |
|
05/21/2015 |
|
|
|
|
|
|
|
|
|
|
|
|
|
|
|
|
|
|
10.11 |
|
Form of Indemnification Agreement for Directors and Officers + |
|
8-K |
|
001-32205 |
|
10.1 |
|
12/08/2009 |
|
|
|
|
|
|
|
|
|
|
|
|
|
|
|
|
|
10.12 |
|
Form of Indemnification Agreement for Directors and Officers + |
|
10-Q |
|
001-32205 |
|
10.3 |
|
05/10/2016 |
|
|
|
|
|
|
|
|
|
|
|
|
|
|
|
|
|
10.13 |
|
Second Amended and Restated 2004 Stock Incentive Plan of CB Richard Ellis Group, Inc. + |
|
8-K |
|
001-32205 |
|
10.1 |
|
06/06/2008 |
|
|
|
|
|
|
|
|
|
|
|
|
|
|
|
|
|
10.14 |
|
|
10-Q |
|
001-32205 |
|
10.3 |
|
05/11/2009 |
|
|
|
|
|
|
|
|
|
|
|
|
|
|
|
|
|
|
10.15 |
|
|
S-8 |
|
333-181235 |
|
99.1 |
|
05/08/2012 |
|
|
|
|
|
|
|
|
|
|
|
|
|
|
|
|
|
|
10.16 |
|
Form of Nonstatutory Stock Option Agreement for the CBRE Group, Inc. 2012 Equity Incentive Plan + |
|
S-8 |
|
333-181235 |
|
99.2 |
|
05/08/2012 |
|
|
|
|
|
|
|
|
|
|
|
|
|
|
|
|
|
10.17 |
|
Form of Restricted Stock Unit Agreement for the CBRE Group, Inc. 2012 Equity Incentive Plan + |
|
S-8 |
|
333-181235 |
|
99.3 |
|
05/08/2012 |
|
|
|
|
|
|
|
|
|
|
|
|
|
|
|
|
|
10.18 |
|
Form of Restricted Stock Agreement for the CBRE Group, Inc. 2012 Equity Incentive Plan + |
|
S-8 |
|
333-181235 |
|
99.4 |
|
05/08/2012 |
|
|
|
|
|
|
|
|
|
|
|
|
|
|
|
|
|
10.19 |
|
|
8-K |
|
001-32205 |
|
10.1 |
|
08/20/2013 |
|
|
|
|
|
|
|
|
|
|
|
|
|
|
|
|
|
|
10.20 |
|
|
8-K |
|
001-32205 |
|
10.2 |
|
08/20/2013 |
|
|
|
|
|
|
|
|
|
|
|
|
|
|
|
|
|
|
10.21 |
|
|
8-K |
|
001-32205 |
|
10.3 |
|
08/20/2013 |
|
|
|
|
|
|
|
|
|
|
|
|
|
|
|
|
|
126
|
|
|
|
|
Incorporated by Reference |
||||||||
|
Exhibit |
|
Exhibit Description |
|
Form |
|
SEC File |
|
Exhibit |
|
Filing Date |
|
Filed |
|
|
|
|
|
|
|
|
|
|
|
|
|
|
|
|
|
10-Q |
|
001-32205 |
|
10.1 |
|
08/11/2014 |
|
|
||
|
|
|
|
|
|
|
|
|
|
|
|
|
|
|
10.23 |
|
|
S-8 |
|
333-218113 |
|
99.1 |
|
05/19/2017 |
|
|
|
|
|
|
|
|
|
|
|
|
|
|
|
|
|
|
10.24 |
|
|
|
|
|
|
|
|
|
|
X |
|
|
|
|
|
|
|
|
|
|
|
|
|
|
|
|
10.25 |
|
|
|
|
|
|
|
|
|
|
X |
|
|
|
|
|
|
|
|
|
|
|
|
|
|
|
|
10.26 |
|
|
S-8 |
|
333-218113 |
|
99.4 |
|
05/19/2017 |
|
|
|
|
|
|
|
|
|
|
|
|
|
|
|
|
|
|
10.27 |
|
|
|
|
|
|
|
|
|
|
X |
|
|
|
|
|
|
|
|
|
|
|
|
|
|
|
|
10.28 |
|
|
|
|
|
|
|
|
|
|
X |
|
|
|
|
|
|
|
|
|
|
|
|
|
|
|
|
10.29 |
|
|
|
|
|
|
|
|
|
|
X |
|
|
|
|
|
|
|
|
|
|
|
|
|
|
|
|
10.30 |
|
|
8-K |
|
001-32205 |
|
10.1 |
|
03/12/2012 |
|
|
|
|
|
|
|
|
|
|
|
|
|
|
|
|
|
|
10.31 |
|
|
10-K |
|
001-32205 |
|
10.22 |
|
03/01/2017 |
|
|
|
|
|
|
|
|
|
|
|
|
|
|
|
|
|
|
10.32 |
|
|
8-K |
|
001-32205 |
|
10.1 |
|
03/27/2015 |
|
|
|
|
|
|
|
|
|
|
|
|
|
|
|
|
|
|
10.33 |
|
|
|
|
|
|
|
|
|
|
X |
|
|
|
|
|
|
|
|
|
|
|
|
|
|
|
|
10.34 |
|
|
10-Q |
|
001-32205 |
|
10.2 |
|
05/10/2016 |
|
|
|
|
|
|
|
|
|
|
|
|
|
|
|
|
|
|
11 |
|
|
|
|
|
|
|
|
|
|
X |
|
|
|
|
|
|
|
|
|
|
|
|
|
|
|
127
|
|
|
|
|
Incorporated by Reference |
||||||||
|
Exhibit |
|
Exhibit Description |
|
Form |
|
SEC File |
|
Exhibit |
|
Filing Date |
|
Filed |
|
|
|
|
|
|
|
|
|
|
|
|
|
|
|
|
|
|
|
|
|
|
|
|
|
X |
||
|
|
|
|
|
|
|
|
|
|
|
|
|
|
|
21 |
|
|
|
|
|
|
|
|
|
|
X |
|
|
|
|
|
|
|
|
|
|
|
|
|
|
|
|
23.1 |
|
|
|
|
|
|
|
|
|
|
X |
|
|
|
|
|
|
|
|
|
|
|
|
|
|
|
|
31.1 |
|
|
|
|
|
|
|
|
|
|
X |
|
|
|
|
|
|
|
|
|
|
|
|
|
|
|
|
31.2 |
|
|
|
|
|
|
|
|
|
|
X |
|
|
|
|
|
|
|
|
|
|
|
|
|
|
|
|
32 |
|
|
|
|
|
|
|
|
|
|
X |
|
|
|
|
|
|
|
|
|
|
|
|
|
|
|
|
101.INS |
|
XBRL Instance Document |
|
|
|
|
|
|
|
|
|
X |
|
|
|
|
|
|
|
|
|
|
|
|
|
|
|
101.SCH |
|
XBRL Taxonomy Extension Schema Document |
|
|
|
|
|
|
|
|
|
X |
|
|
|
|
|
|
|
|
|
|
|
|
|
|
|
101.CAL |
|
XBRL Taxonomy Extension Calculation Linkbase Document |
|
|
|
|
|
|
|
|
|
X |
|
|
|
|
|
|
|
|
|
|
|
|
|
|
|
101.DEF |
|
XBRL Taxonomy Extension Definition Linkbase Document |
|
|
|
|
|
|
|
|
|
X |
|
|
|
|
|
|
|
|
|
|
|
|
|
|
|
101.LAB |
|
XBRL Taxonomy Extension Label Linkbase Document |
|
|
|
|
|
|
|
|
|
X |
|
|
|
|
|
|
|
|
|
|
|
|
|
|
|
101.PRE |
|
XBRL Taxonomy Extension Presentation Linkbase Document |
|
|
|
|
|
|
|
|
|
X |
In the foregoing Exhibit Index, (1) references to CB Richard Ellis Group, Inc. are now to CBRE Group, Inc., (2) references to CB Richard Ellis Services, Inc. are now to CBRE Services, Inc., and (3) references to CB Richard Ellis, Inc. are now to CBRE, Inc.
|
+ |
Denotes a management contract or compensatory arrangement |
128
Pursuant to the requirements of Section 13 or 15(d) of the Securities Exchange Act of 1934, as amended, the registrant has duly caused this report to be signed on its behalf by the undersigned thereunto duly authorized.
|
CBRE GROUP, INC. |
||
|
|
|
|
|
By: |
|
/s/ROBERT E. SULENTIC |
|
|
|
Robert E. Sulentic President and Chief Executive Officer |
|
|
||
|
Date: March 1, 2018 |
||
Pursuant to the requirements of the Securities Exchange Act of 1934, as amended, this report has been signed below by the following persons on behalf of the registrant and in the capacities and on the dates indicated.
|
Signature |
|
Title |
|
Date |
|
|
|
|
|
|
|
/s/ BRANDON B. BOZE |
|
Director |
|
March 1, 2018 |
|
Brandon B. Boze |
|
|
|
|
|
|
|
|
|
|
|
/s/ BETH F. COBERT |
|
Director |
|
March 1, 2018 |
|
Beth F. Cobert |
|
|
|
|
|
|
|
|
|
|
|
/s/ CURTIS F. FEENY |
|
Director |
|
March 1, 2018 |
|
Curtis F. Feeny |
|
|
|
|
|
|
|
|
|
|
|
/s/ BRADFORD M. FREEMAN |
|
Director |
|
March 1, 2018 |
|
Bradford M. Freeman |
|
|
|
|
|
|
|
|
|
|
|
/s/ ARLIN E. GAFFNER |
|
Senior Vice President and Chief Accounting |
|
March 1, 2018 |
|
Arlin E. Gaffner |
|
Officer (Principal Accounting Officer) |
|
|
|
|
|
|
|
|
|
/s/ JAMES R. GROCH |
|
Chief Financial Officer (Principal Financial |
|
March 1, 2018 |
|
James R. Groch |
|
Officer) |
|
|
|
|
|
|
|
|
|
/s/ CHRISTOPHER T. JENNY |
|
Director |
|
March 1, 2018 |
|
Christopher T. Jenny |
|
|
|
|
|
|
|
|
|
|
|
/s/ GERARDO I. LOPEZ |
|
Director |
|
March 1, 2018 |
|
Gerardo I. Lopez |
|
|
|
|
|
|
|
|
|
|
|
/s/ FREDERIC V. MALEK |
|
Director |
|
March 1, 2018 |
|
Frederic V. Malek |
|
|
|
|
|
|
|
|
|
|
|
/s/ PAULA R. REYNOLDS |
|
Director |
|
March 1, 2018 |
|
Paula R. Reynolds |
|
|
|
|
|
|
|
|
|
|
|
/s/ ROBERT E. SULENTIC |
|
Director and President and Chief Executive |
|
March 1, 2018 |
|
Robert E. Sulentic |
|
Officer (Principal Executive Officer) |
|
|
|
|
|
|
|
|
|
/s/ LAURA D. TYSON |
|
Director |
|
March 1, 2018 |
|
Laura D. Tyson |
|
|
|
|
|
|
|
|
|
|
|
/s/ RAY WIRTA |
|
Chairman of the Board |
|
March 1, 2018 |
|
Ray Wirta |
|
|
|
|
|
|
|
|
|
|
|
/s/ SANJIV YAJNIK |
|
Director |
|
March 1, 2018 |
|
Sanjiv Yajnik |
|
|
|
|
129
