 Global Investment Management Overview Vance Maddocks Chief Executive Officer – CBRE Investors Exhibit 99.8 |
| Global Investment Management Overview Vance Maddocks Chief Executive Officer – CBRE Investors Exhibit 99.8 |
 CB
Richard Ellis | Page 2 Overview Global real estate investment manager $42.2 billion in assets under management* 160 institutional investor partners and clients Diversified geographically with approximately 50% of assets outside of the U.S. * As of March 31, 2008 |
 CB
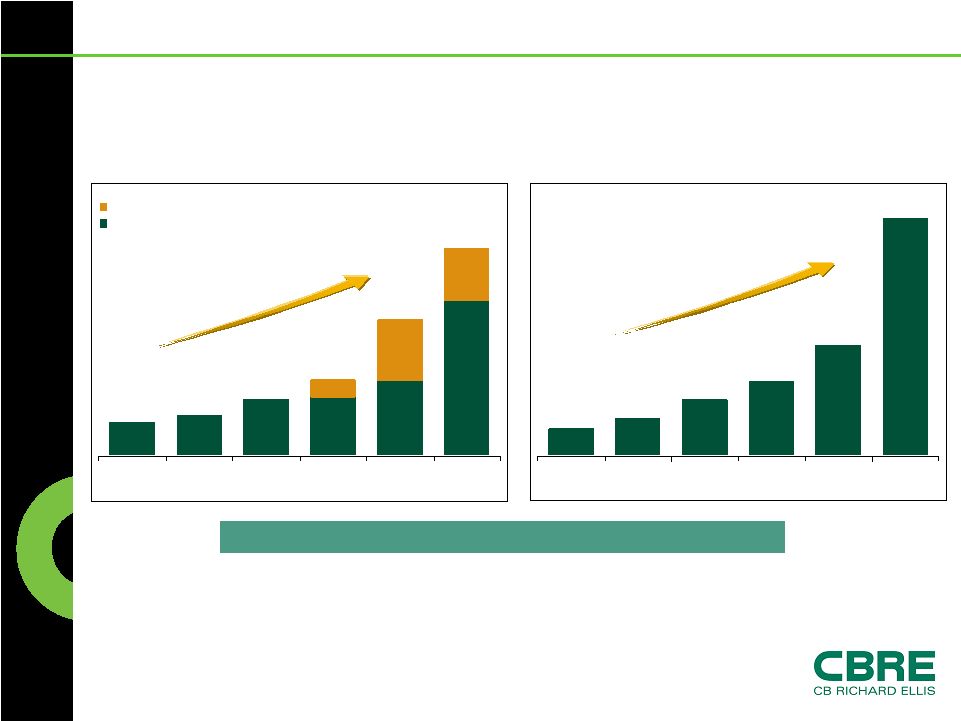
Richard Ellis | Page 3 Investment Management Growth 13.0 18.0 26.8 35.5 52.7 113.1 2002 2003 2004 2005 2006 2007 57.1 68.4 94.0 99.3 126.3 259.2 28.0 101.7 88.7 347.9 127.3 228.0 2002 2003 2004 2005 2006 2007 Carried Interest Investment Management Annual Revenue ($ in millions) CAGR 44% CAGR 54% Annual EBITDA ($ in millions) CBRE’s co-investments totaled $112 million at the end of Q1 2008 |
 CB
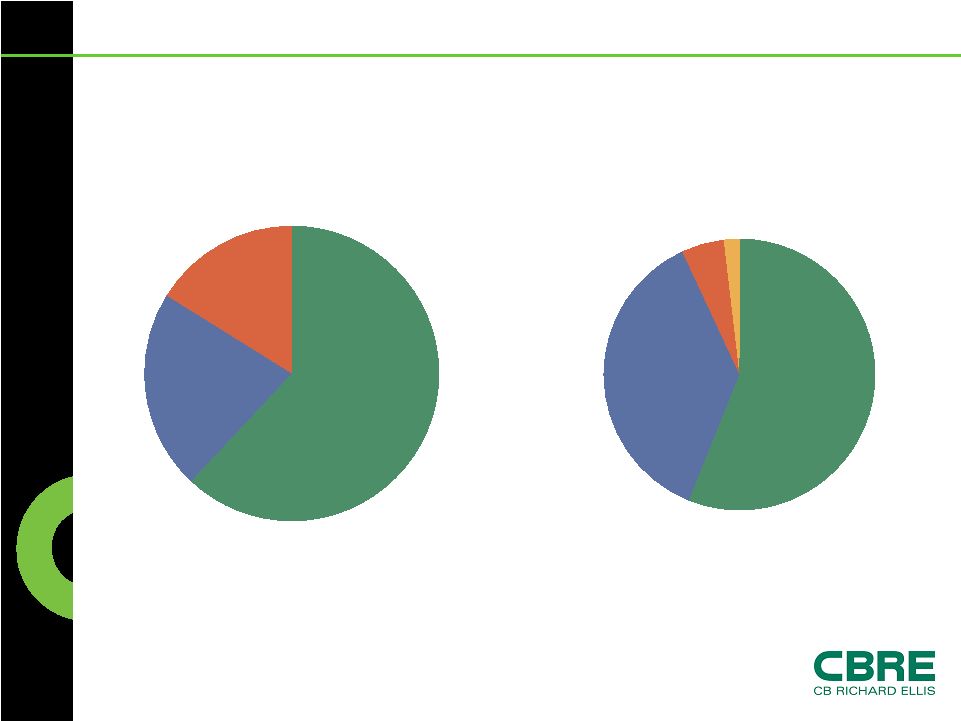
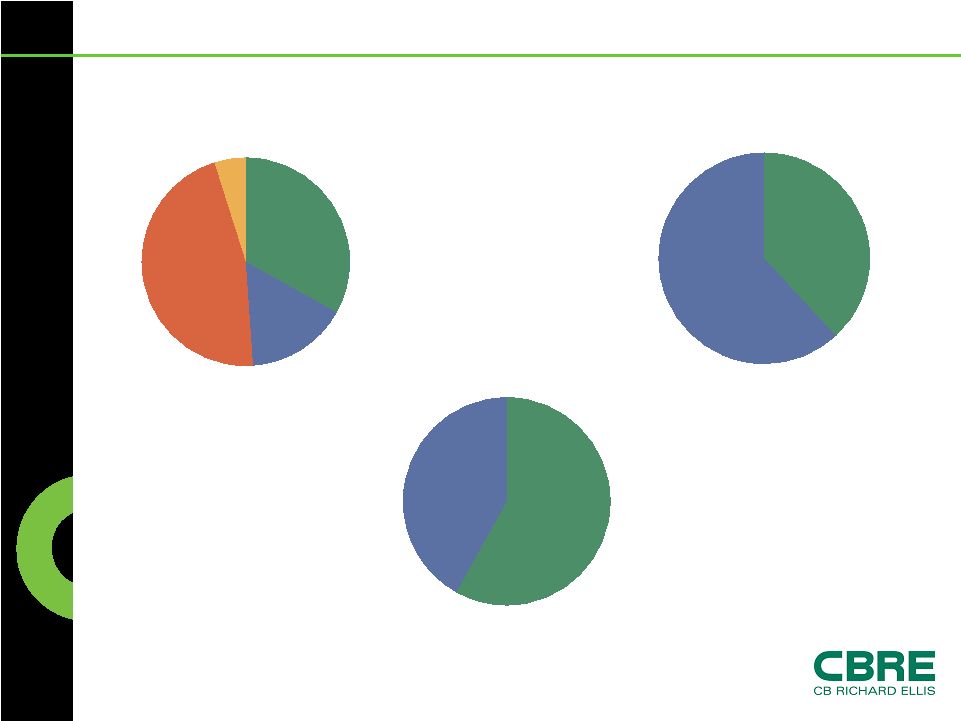
Richard Ellis | Page 4 Investment Management Revenue By
Region Europe 22% Asia 16% North America 62% Europe 37% Asia 5% North America 56% Global Securities 2% 2003 $68.4M 2007 $259.2M |
 CB
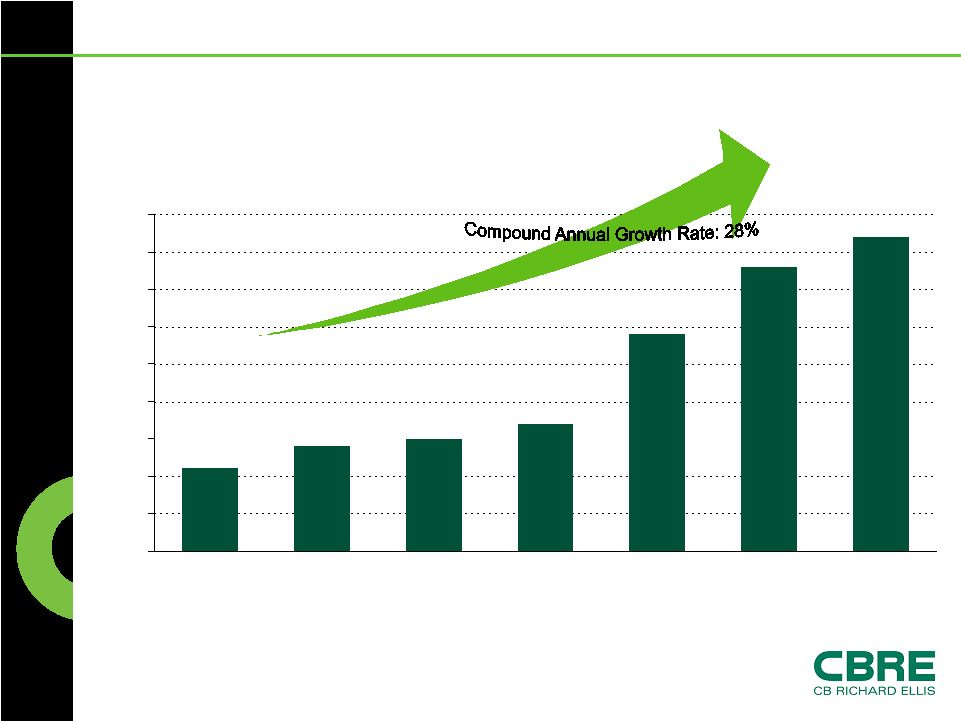
Richard Ellis | Page 5 11 14 15 17 29 38 42 0 5 10 15 20 25 30 35 40 45 2002 2003 2004 2005 2006 2007 Q12008 Assets Under Management Growth ($ in billions) |
 CB
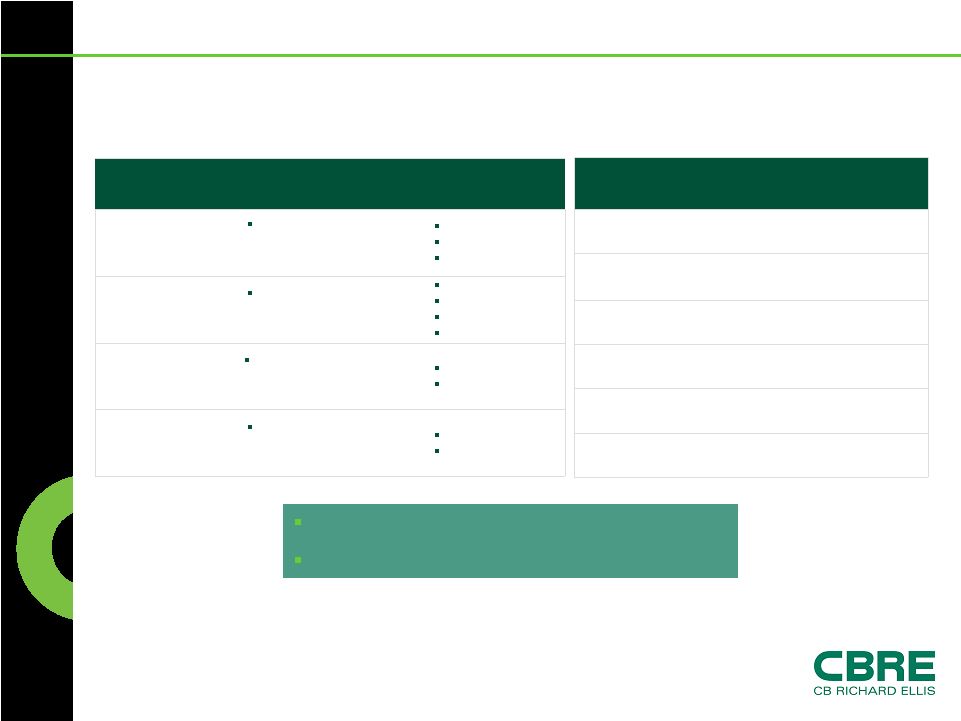
Richard Ellis | Page 6 Global Investment Programs Management fees Incentive fees $2.0 billion of assets under management (67% growth over Q1 2007) Listed Securities Management fees Incentive fees $3.0 billion of assets under management (114% growth over Q1 2007) Unlisted Securities Management fees Transaction fees LP profits Carried Interest $16.8 billion of assets under management (98% growth over Q1 2007) Sponsored Funds Management fees Transaction fees Incentive fees $20.4 billion of assets under management (5% growth over Q1 2007) Separate Accounts Typical Fee Structure Q1 2008 Statistics Description 42.2 5.0 37.2 2.4 13.7 21.1 100 Total 12 Total Indirect 88 Total Direct 6 Asia Pacific 32 Europe 50 North America % Assets Under Management ($ in billions) Geography/Strategy Assets Under Management = $42.2 billion* 38% Growth over Q1 2007 * As of March 31, 2008 |
 CB
Richard Ellis | Page 7 2007 Capital Raised – $9.6 Billion By Geography Europe 46% Global Securities 16% North America 33% Asia 5% By Vehicle Separate Accounts 62% Funds 38% By Investment Strategy Indirect 42% Direct 58% |
 CB
Richard Ellis | Page 8 2008 Capital Availability Total Capital (US$ in billions) 27 6 1 8 12 Asia Total Global Indirect Europe North America |
 CB
Richard Ellis | Page 9 Global Growth Strategies Continue expanding global strategic relationships Expand indirect investment programs including real estate securities and fund of funds Expand Strategic Partners value added and opportunistic fund series |
 CB
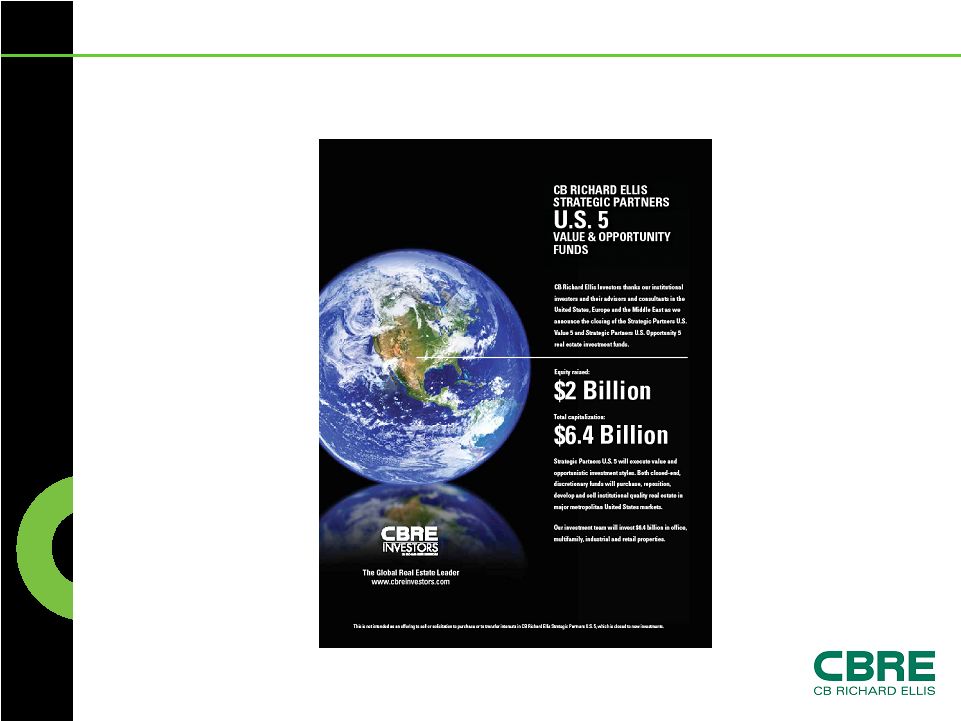
Richard Ellis | Page 10 Strategic Partners U.S. 5
|
 CB
Richard Ellis | Page 11 CBRE Platform Real-time, local market knowledge Access to transactions • Strategic Partners Europe – 80% off-market • Strategic Partners U.S. – 67% off-market Property-level execution platform |
 CB
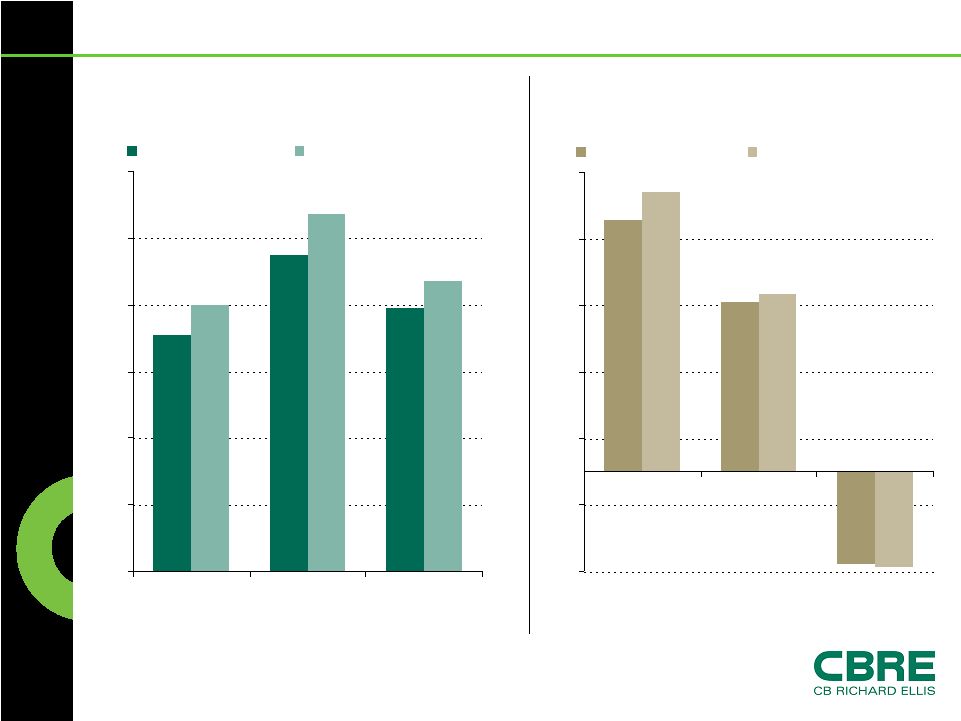
Richard Ellis | Page 12 Performance U.S. Discretionary Accounts (1) 8 10 12 14 16 18 20 Five Years Three Years One Year NCREIF Benchmark CBREI Total Gross Return (1) As of December 31, 2007 U.K. Discretionary Accounts (1) -6 -2 2 6 10 14 18 Five Years Three Years One Year IPD Index Benchmark CBREI Total Gross Return % % |