 Capital Markets Overview Brian Stoffers President, Capital Markets Exhibit 99.6 |
| Capital Markets Overview Brian Stoffers President, Capital Markets Exhibit 99.6 |
 CB
Richard Ellis | Page 2 CBRE’s U.S. Capital Markets Activity
Levels 23.9 71.6 88.7 Total Capital Markets Activity 20.8 20.7 25.0 Loan Origination Volume 25.2 50.9 63.7 Investment Sales Volume -25.9 2.7 2.0 Hotels -17.5 21.1 17.4 Multi-Housing 45.6 6.8 9.9 Industrial 67.5 4.0 6.7 Retail 69.9 16.3 27.7 Office % chg 2006 2007 Investment Sales Volume ($ in billions) Source: Investment Sales data from Real Capital Analytics
|
 CB
Richard Ellis | Page 3 CBRE’s U.S. Capital Markets Activity
Levels 23.9 71.6 88.7 Total Capital Markets Activity 25.2 50.9 63.7 Investment Sales Volume 20.8 20.7 25.0 Loan Origination Volume 153.3 1.5 3.8 Special Purpose 107.8 .77 1.6 Hotels 31.8 6.3 8.3 Multi-Housing -26.3 1.9 1.4 Industrial 44.4 2.7 3.9 Retail -21.1 7.6 6.0 Office % chg 2006 2007 Loan Origination Volume ($ in billions) Source: Investment Sales data from Real Capital Analytics
|
 CB
Richard Ellis | Page 4 Q1 2008 U.S. Capital Markets Activity
Capital Markets Activity -60 $22.0B $8.9B Total Capital Markets Activity -60 $6.2B $2.5B Loan Origination Volume -67 $19.5B $6.4B Investment Sales Volume % Change Q1 2007 Q1 2008 Loan Servicing 9 $104.5B $114.1B Total Loan Servicing* * Reflects loans serviced by GEMSA, a joint venture between CBRE Capital Markets and GE Capital Real Estate Source: Investment Sales numbers from Real Capital Analytics
|
 CB
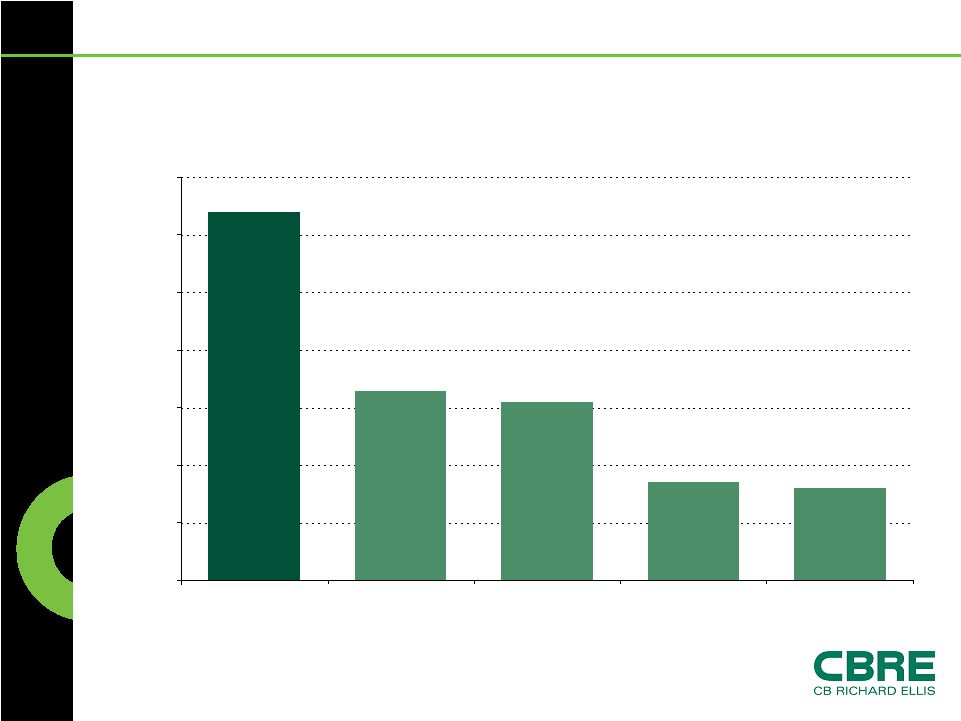
Richard Ellis | Page 5 Q1 2008 Investment Sales Broker
Rankings 6.4 3.3 3.1 1.6 1.7 0.0 1.0 2.0 3.0 4.0 5.0 6.0 7.0 CB Richard Ellis Eastdil Secured Cushman & Wakefield Merrill Lynch Holliday Fenoglio Fowler All Property Types Source: Real Capital Analytics ($ in billions) |
 CB
Richard Ellis | Page 6 Overall Capital Markets – Worry, Don’t Panic The word “real estate” does not indicate that residential and commercial real estate have much else in common Decline in residential is leading the economy, rather than being caused by a recession Commercial real estate has not exhibited the same pattern of building that has been seen in residential Commercial markets are almost universally in a balanced position, but cost of debt and equity capital has changed Deals are getting done |
 CB
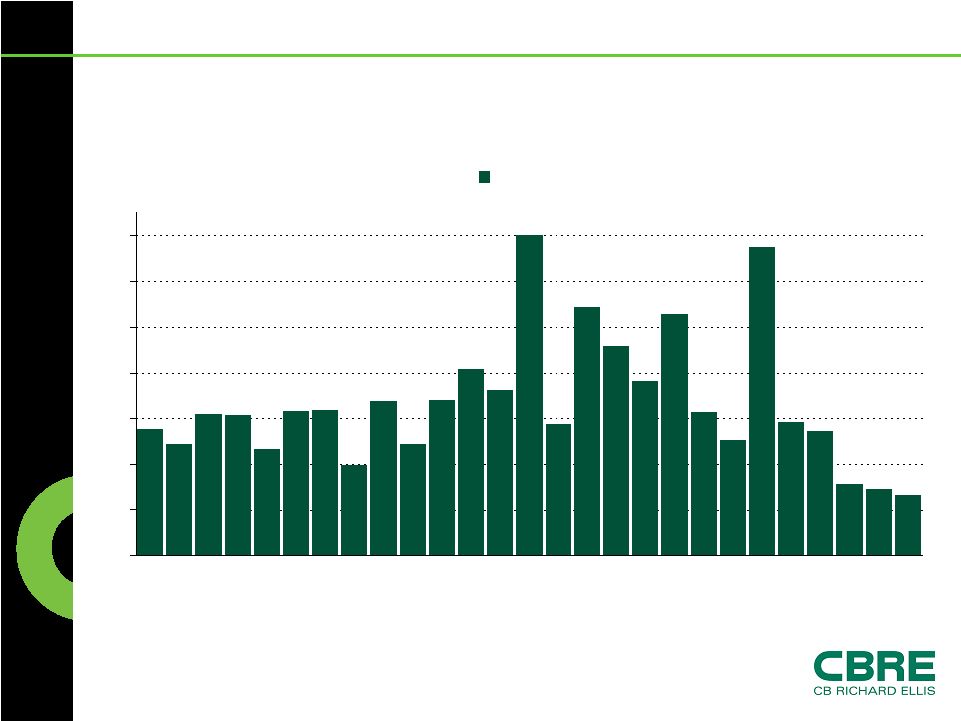
Richard Ellis | Page 7 Property Sales 0 10 20 30 40 50 60 70 J '06 F M A M J J A S O N D J '07 F M A M J J A S O N D J '08 F M Property $ in billions Source: Real Capital Analytics |
 CB
Richard Ellis | Page 8 CMBS Spreads Source: MBA 2008 |
 CB
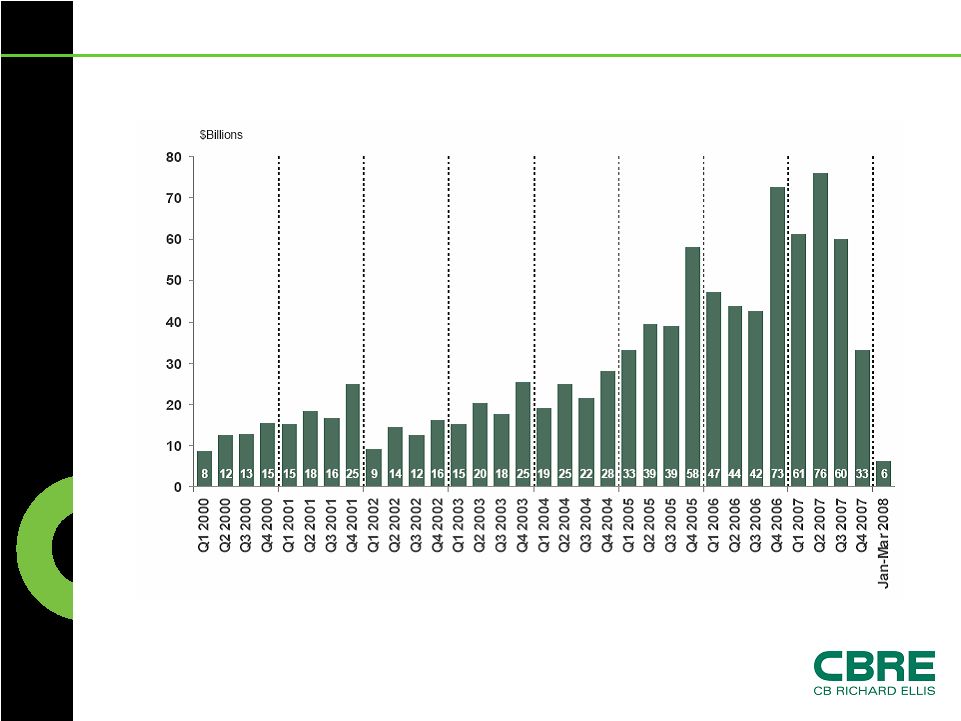
Richard Ellis | Page 9 CMBS Issuance Source: MBA 2008 |
 CB
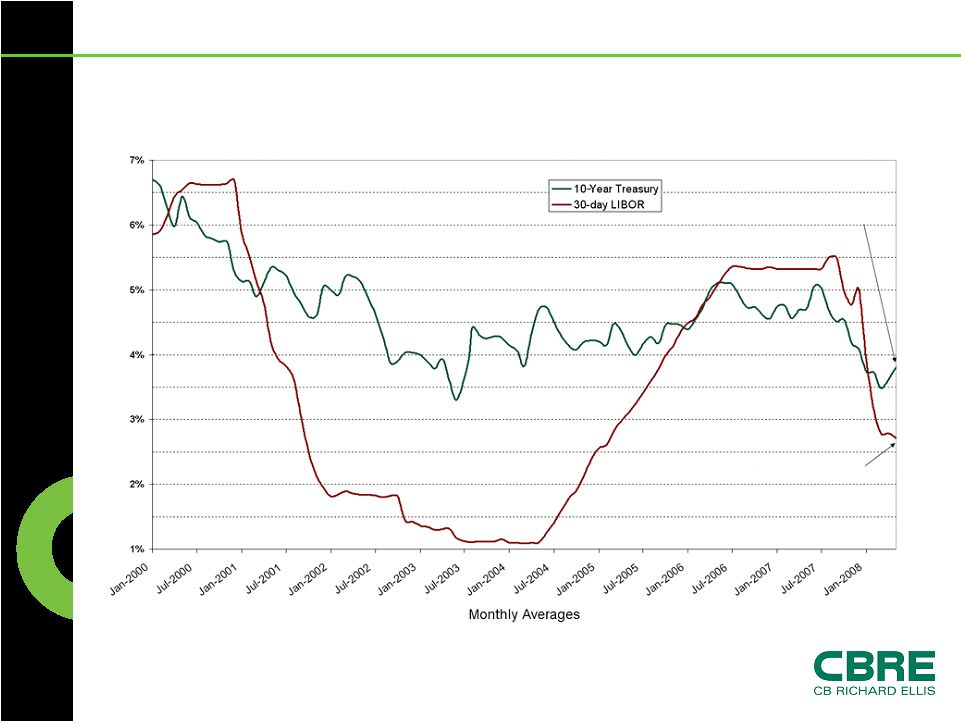
Richard Ellis | Page 10 Saved By Rates! 10-Year Treasury vs. 30-Day LIBOR Source: Citigroup May 15, 2008 close @ 3.84% 10-Year Treasury May 15, 2008 close @ 2.50% 30-day LIBOR |
 CB
Richard Ellis | Page 11 2008 Initiatives Continued integration between sales and mortgage brokerage businesses Global connectivity/cross-border business Investment Banking – Broker/Dealer Perfecting/relying on the matrix/creating efficiencies Fannie Mae DUS business ONE FIRM TEAM |
 CB
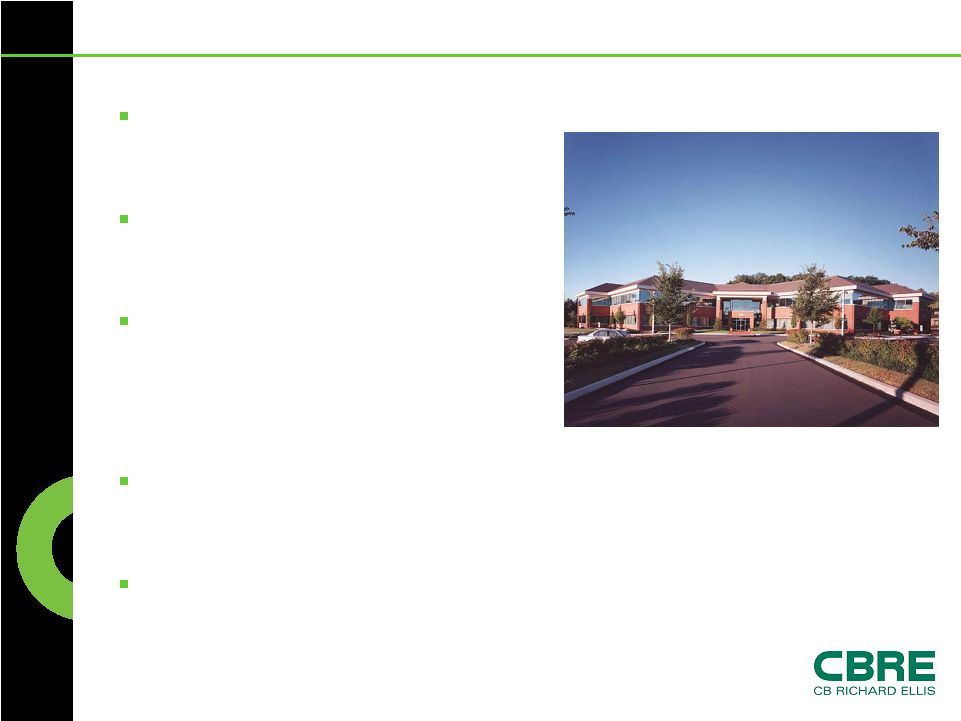
Richard Ellis | Page 12 Case Study: Brandywine Portfolio
CBRE Capital Markets arranged the $184 million sale and financing Portfolio consisted of 29 Class A and B office buildings First mortgage financing arranged via joint venture between DRA Advisors LLC and Brandywine Realty Trust CBRE’s Investment Sales group in Pennsylvania represented the seller, Brandywine Realty Trust CBRE Debt & Equity Finance in New Jersey secured attractive pricing and proceeds $184 Million Sale & Financing |
 CB
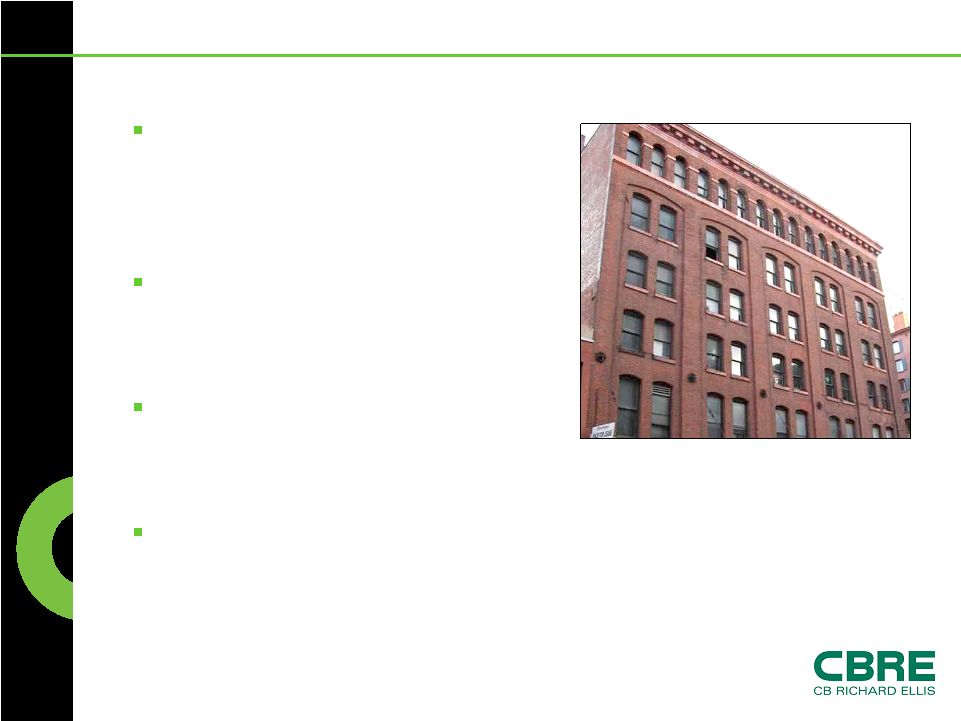
Richard Ellis | Page 13 Case Study: 67-69 Laight Street
CBRE Capital Markets arranged the $30 million financing to purchase a development parcel in Tribeca, NYC Arranz Acinas Group, a leading Spanish real estate investor, made its first U.S. acquisition Overseas banks, Banco Sabadell and Banco Popular, provided debt financing EMEA Capital Markets team leveraged the CBRE platform by collaborating with Capital Markets New York $30 Million Cross-Border Financing |