 Asia
Pacific Overview Robert E. Sulentic Group President EMEA, Asia Pacific & Development Services Exhibit 99.5 |
| Asia
Pacific Overview Robert E. Sulentic Group President EMEA, Asia Pacific & Development Services Exhibit 99.5 |
 Our
Business in Asia Pacific |
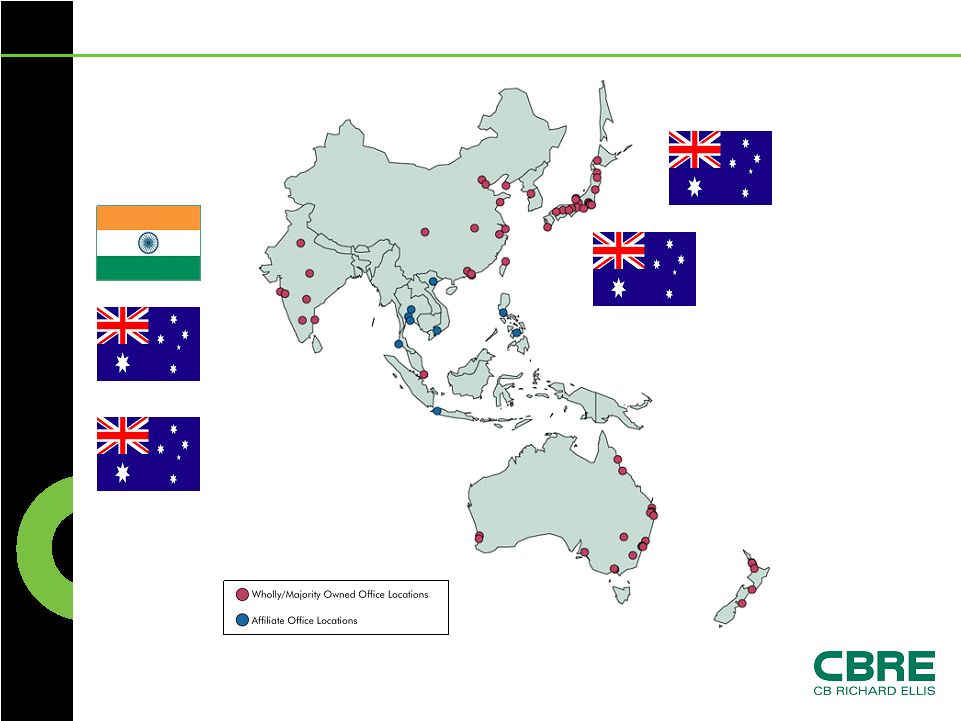
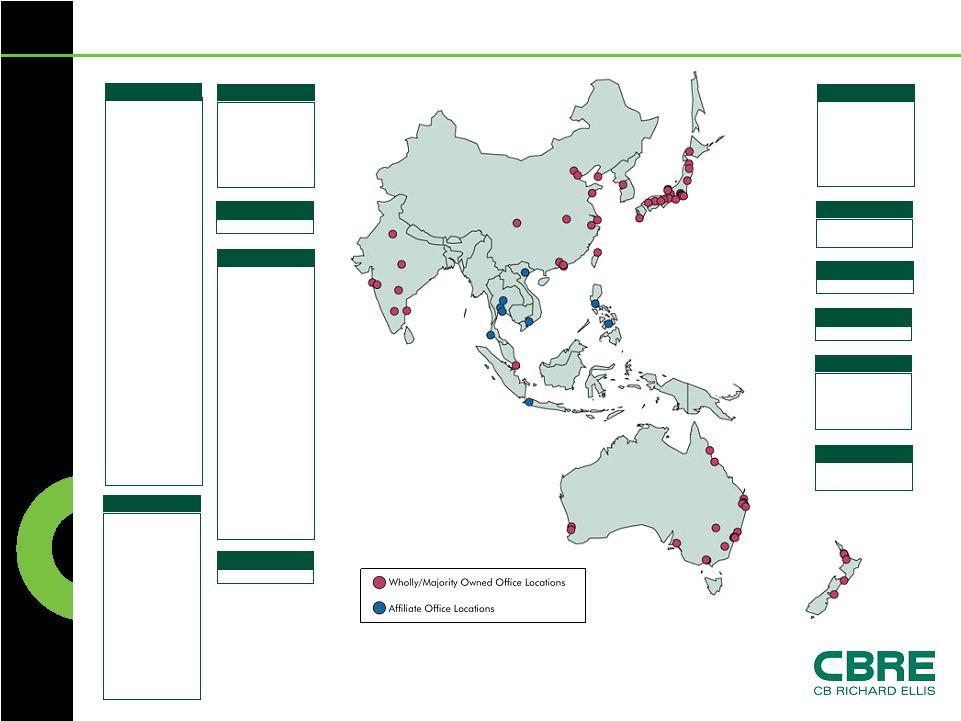 CB
Richard Ellis | Page 3 Where are we: Asia Pacific Greater China Beijing Chengdu Dalian Guangzhou Hangzhou Hong Kong Qingdao Shanghai Shanghai– Pudong Shenzhen Taipei Tianjin Wuhan Singapore Singapore Korea Seoul Japan Chiba Fukuoka Hiroshima Kagoshima Kanazawa Kobe Kyoto Nagoya Nihonbashi Okayama Osaka Saitama Sapporo Sendai Shinjuku Tachikawa Takamatsu Tokyo Yokohama India Bangalore Chennai Hyderabad Mumbai New Delhi Pune Philippines Cebu Manila Thailand Bangkok Pattaya Phuket Samui Vietnam Hanoi Ho Chi Min City Australia Adelaide Brisbane Cairns Canberra Chermside Gold Coast Ipswich Liverpool Mandurah Melbourne Milton Mulgrave Newcastle North Sydney Northern Beaches Parramatta Perth Perth City East South Sydney South Yarra Sunshine Coast Sydney Toorak Road Townsville Tweed Heads Underwood New Zealand Auckland Christchurch Hamilton North Auckland South Auckland Wellington Taiwan Taipei Indonesia Jakarta |
 CB
Richard Ellis | Page 4 Sectors Airports & Aviation Automotive Banking & Finance Government Health Care Hotels Industrial & Logistics Media Petroleum Residential & Mixed Use Retail & Leisure Telecoms Asia Pacific Sectors and Service Lines Service Lines Asset Management Brokerage Building Consultancy Capital Markets Consultancy Facilities Management Global Corporate Services Project Management Property Management Research Residential Projects Tenant Representation Valuation & Advisory |
 CB
Richard Ellis | Page 5 2007 Asia Pacific Corporate Stats Revenue $0.6 billion Total Transaction Value $20.3 billion Property Sales (Number of Transactions) 2,975 Property Sales (Transaction Value) $17.7 billion Property Leasing (Number of Transactions) 9,025 Property Leasing (Transaction Value) $2.6 billion Property & Corporate Facilities Under 511 million sq. ft.* Management Investment Assets Under Management $2.3 billion Valuation & Advisory Assignments 17,675 * Includes affiliate offices |
 CB
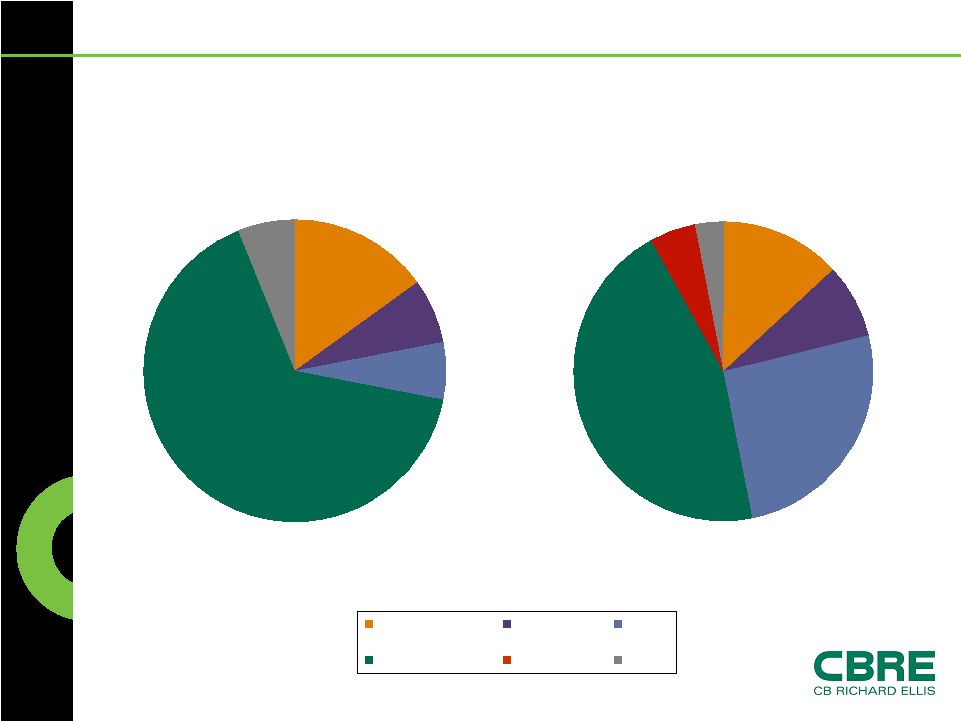
Richard Ellis | Page 6 Asia Pacific Geographic Spread 15% 7% 6% 66% 6% Revenues 2004 2007 13% 8% 26% 45% 5% 3% India Singapore Greater China Japan Pacific Other |
 CB
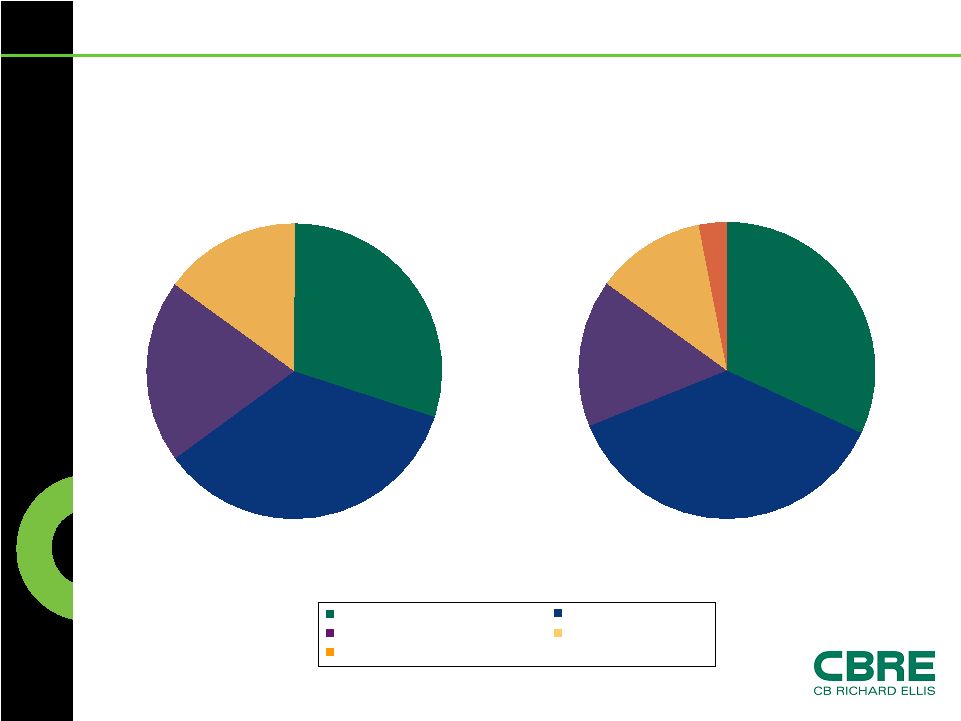
Richard Ellis | Page 7 Asia Pacific Revenue by Service Line
35% 20% 15% 30% 2004 2007 33.8% Sales Leasing Property & Facilities Management Valuation & Appraisal Other 32% 37% 16% 12% 3% |
 Business Performance |
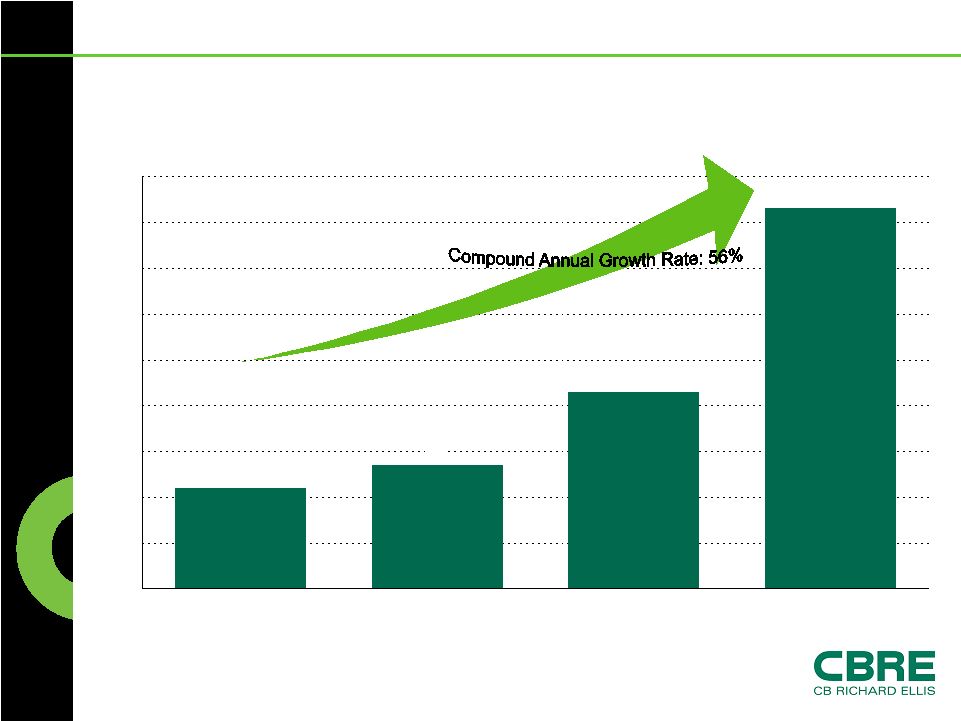
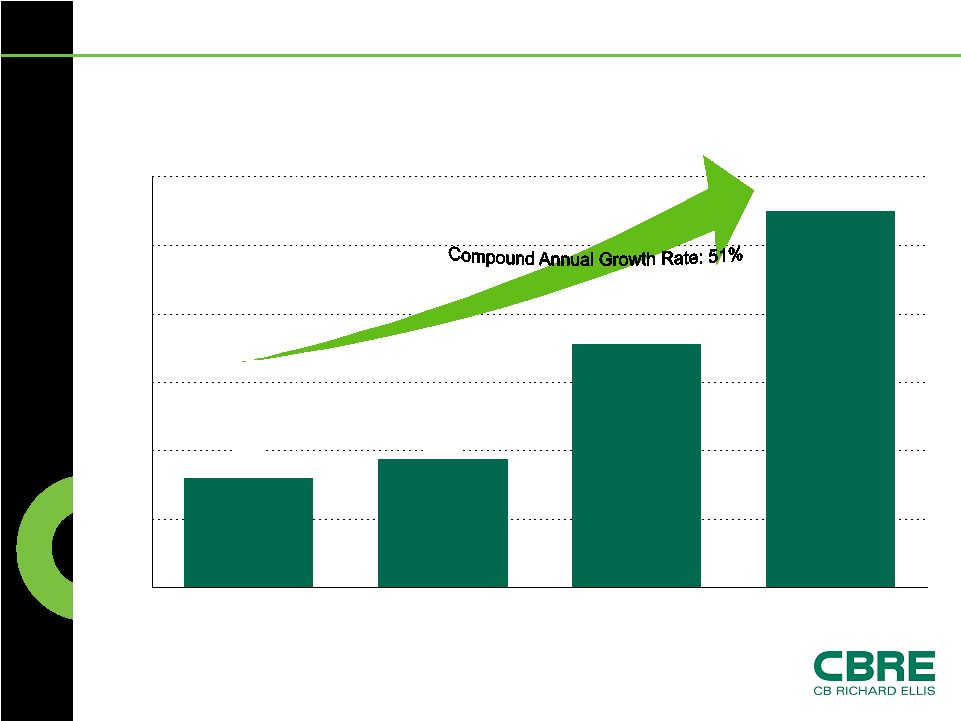 CB
Richard Ellis | Page 9 160 187 549 355 0 100 200 300 400 500 600 2004 2005 2006 2007 Asia Pacific Revenue Progression ($ in millions) |
 CB
Richard Ellis | Page 10 22 27 83 43 0 10 20 30 40 50 60 70 80 90 2004 2005 2006 2007 Asia Pacific EBITDA Progression ($ in millions) |
 CB
Richard Ellis | Page 11 Recent Asia Pacific Acquisitions CBRE India 2007 pH Group Australia 2007 GVA Grimley & Swale Hynes Australia 2007 Realty Marketing Australia 2007 Russell Fairfax Australia 2008 |
 Objectives & Key Strategies |
 CB
Richard Ellis | Page 13 Market Opportunity Major economies remain sound and are growing rapidly Greater cross-border activity between India, China and Japan Robust inbound foreign investment Strong footprint in emerging markets Fragmented marketplace • Continued M&A focus • Increased opportunity to increase ownership in Japan and India |
 CB
Richard Ellis | Page 14 Strategic Advantage Most complete network in Asia Pacific – and globally The best people • Low attrition rates Client Management • Locally • Cross-border Highest operating margin Industry-leading acquisition and integration capabilities with broad opportunities for cross-selling Brand & Marketing |