 Economic Trends Raymond Torto, PhD, CRE Global Chief Economist Exhibit 99.2 |
| Economic Trends Raymond Torto, PhD, CRE Global Chief Economist Exhibit 99.2 |
 CB
Richard Ellis | Page 2 Summary While the global economy has slowed dramatically from 2006/07 rates, this is not and will not be a deep contraction in 2008. Hence, the impact on leasing fundamentals will be mild. However, those property markets that reside in an economy driven greatly by the housing boom, including Spain and Ireland, will be more adversely affected. Capital market froth in the commercial real estate market was driven by cheap and plentiful debt. Neither will be as cheap nor as plentiful in the near future; thus capital market transactions and pricing could reflect 2005 levels. The wide bid/ask spread will narrow quickly once we have price discovery. |
 CB
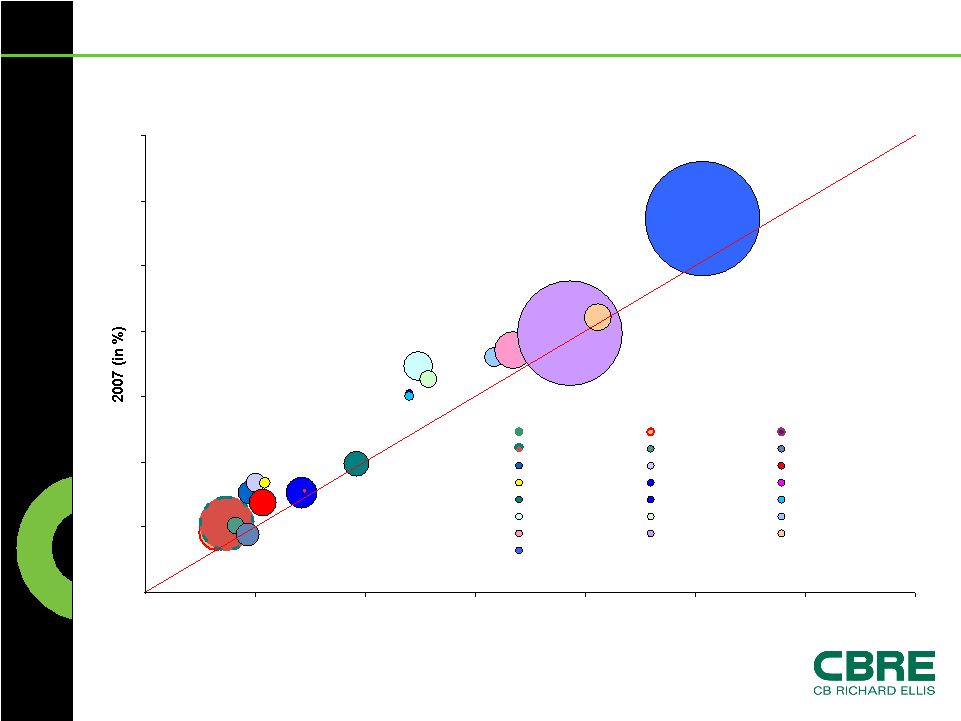
Richard Ellis | Page 3 The Whole World is Slowing Source: Economist Intelligence Unit as of Q1 2008 Q1 2008 Real GDP Growth, Bubbles Sized by Population Italy U.S. Mexico Turkey Philippines Poland Ukraine India JapanDenmark Canada France UK Spain Germany Netherlands Norway Hong Kong Czech Republic Russia Vietnam China 0 2 4 6 8 10 12 14 0 2 4 6 8 10 12 14 2008 (in %) Italy Japan Denmark U.S. Canada France UK Spain Germany Netherlands Mexico Norway Turkey Hong Kong Czech Republic Philippines Poland Ukraine Russia India Vietnam China Weaker in 2008 Stronger in 2008 |
 CB
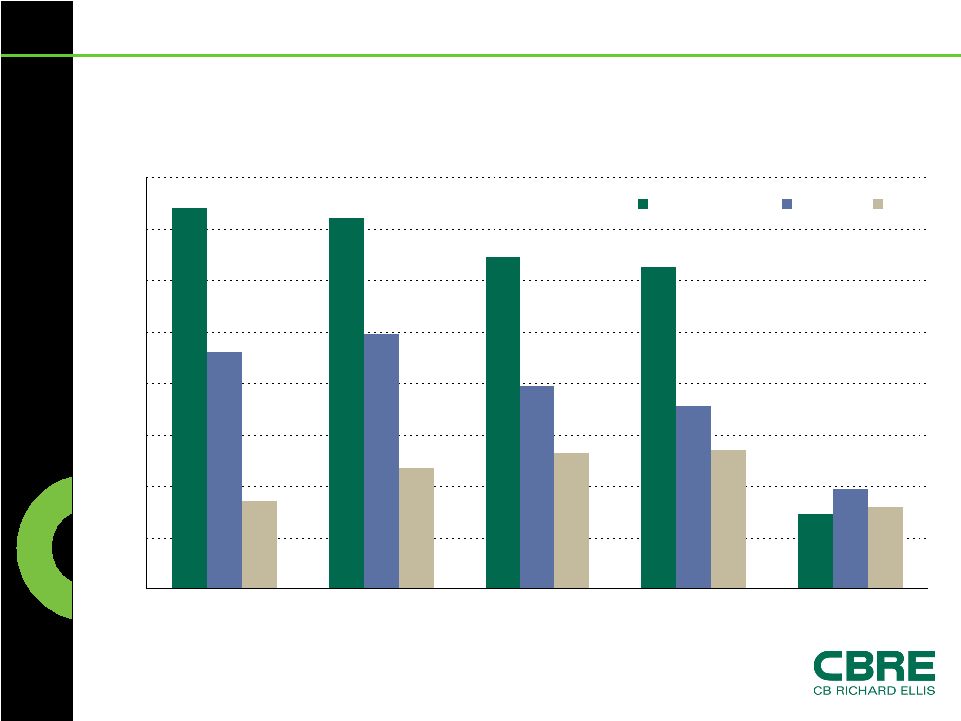
Richard Ellis | Page 4 Deleveraging is Global, Albeit Less so in
Asia Source: Real Capital Analytics Global Capital Trends March/April 2008 ($ in billions) 148 144 129 125 29 99 79 39 71 92 47 34 32 54 53 0 20 40 60 80 100 120 140 160 Q1 2007 Q2 2007 Q3 2007 Q4 2007 Q1 2008 North America Europe Asia Total Investment Sales |
 CB
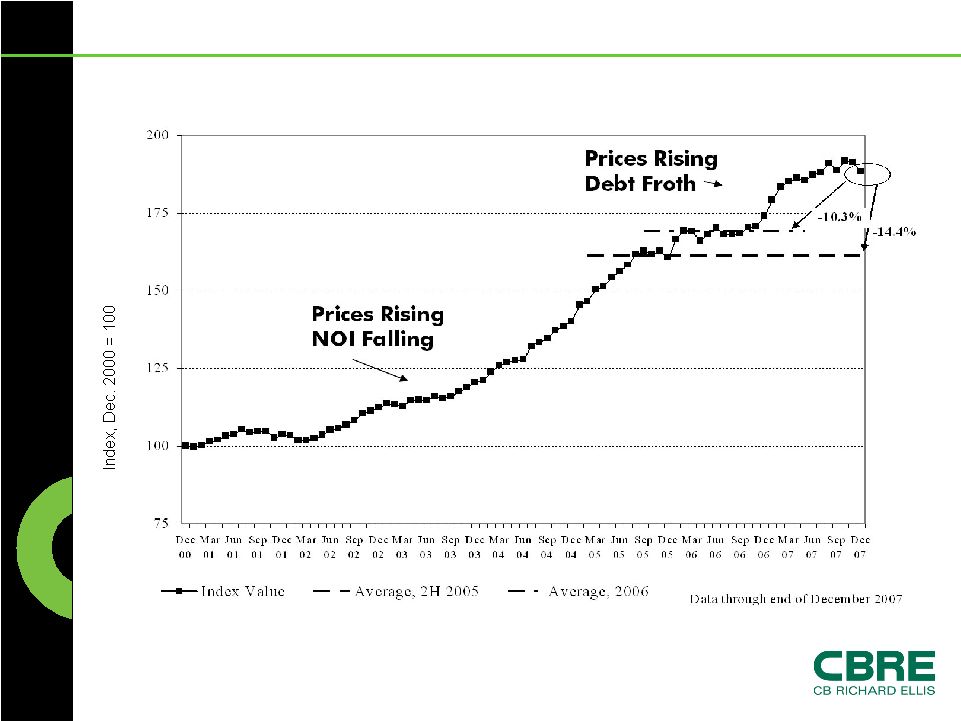
Richard Ellis | Page 5 Where is Pricing? Pulling Back to 2005 Means 10%-14% Reduction Moody’s/Real CPPI |
 CB
Richard Ellis | Page 6 What drives value? % Change in NOI - % Change in Cap Rate = Appreciation Rule of Thumb |
 The
U.S. Economic Outlook |
 CB
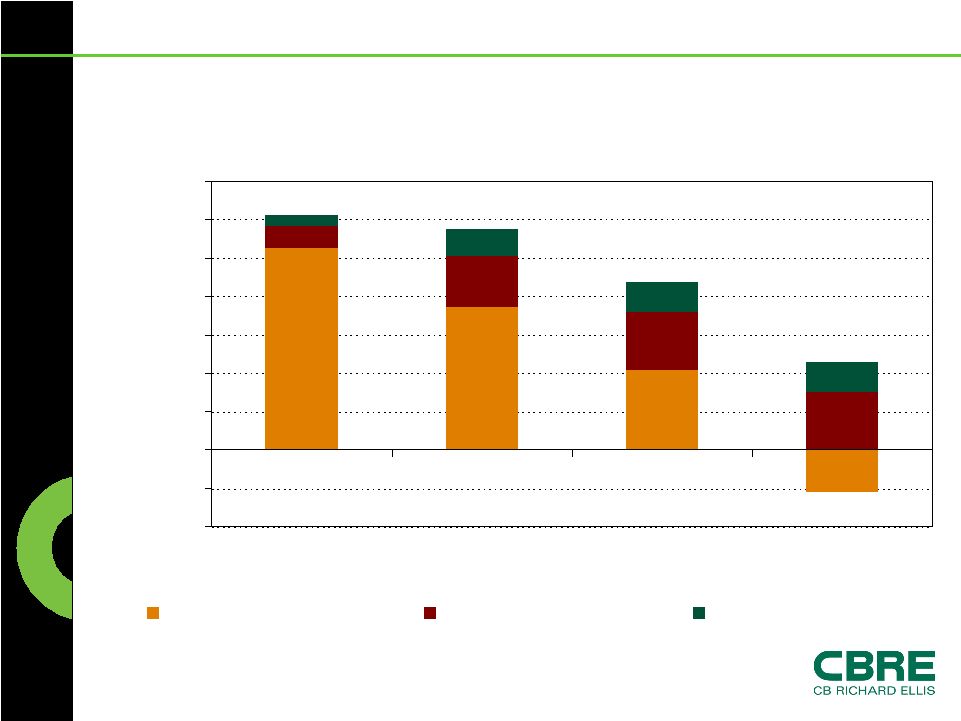
Richard Ellis | Page 8 The Business-Driven Economy Can Not
Offset Housing Drag -1.0% -0.5% 0.0% 0.5% 1.0% 1.5% 2.0% 2.5% 3.0% 3.5% 2005 2006 2007 Q1 2008 Consumer Driven GDP Business Driven GDP Government Driven GDP Source: BEA and CBRE Torto Wheaton Research |
 CB
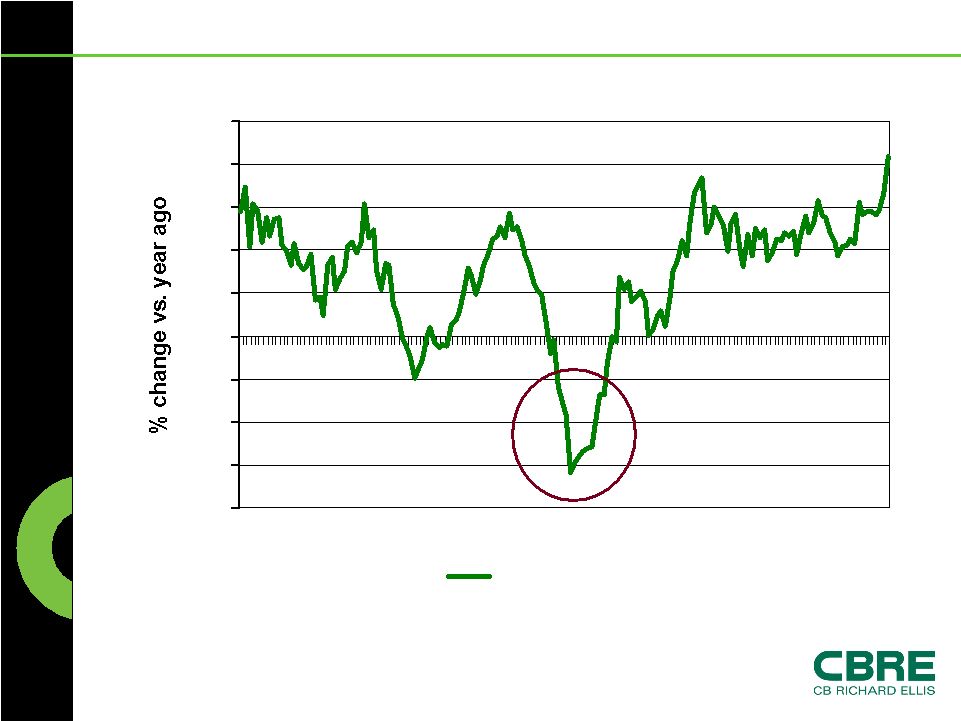
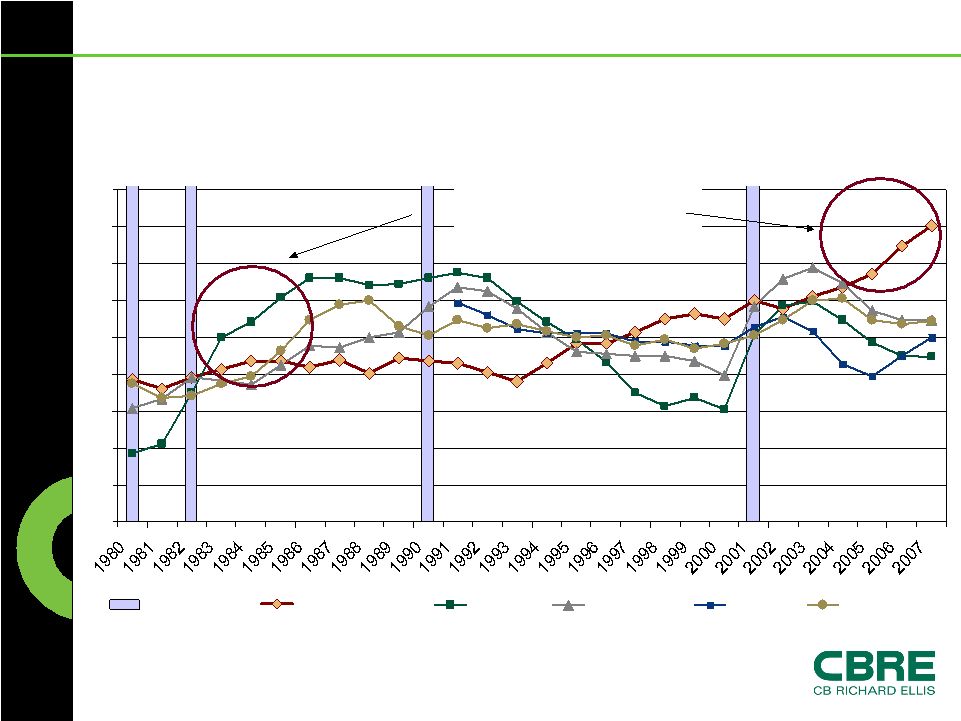
Richard Ellis | Page 9 Corporate Profits at Record Share of
GDP Source: BEA, 2008 5 6 7 8 9 10 11 12 13 80 81 82 83 84 85 86 87 88 89 90 91 92 93 94 95 96 97 98 99 00 01 02 03 04 05 06 07 Earlier Recessions |
 CB
Richard Ellis | Page 10 The Contribution from Exports is
Significant -20 -15 -10 -5 0 5 10 15 20 25 1995 1998 2001 2004 2007 U.S. exports Source: BEA, as of April 2008 |
 The
U.S. Jobs Outlook |
 CB
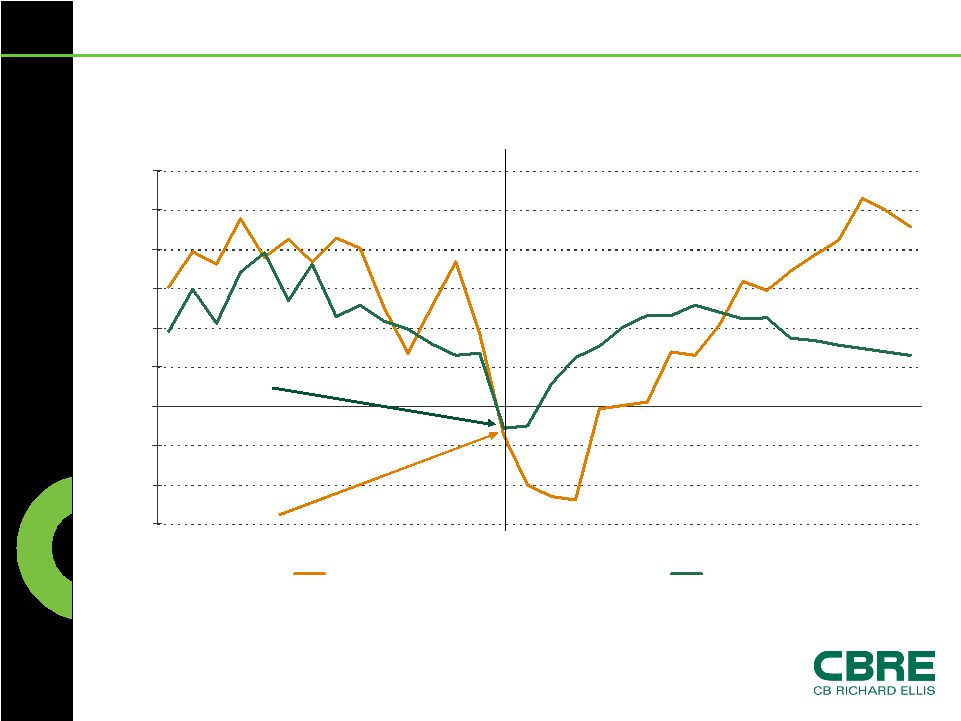
Richard Ellis | Page 12 This Downturn Could be Shorter than
1990s -600 -400 -200 0 200 400 600 800 1,000 1,200 -14 -12 -10 -8 -6 -4 -2 0 2 4 6 8 10 12 14 16 1990s Today (in thousands) Q3 1990 Source: CBRE Torto Wheaton Research Q1 2008 Effects of Stimulus Net New Jobs Created Quarterly |
 CB
Richard Ellis | Page 13 This is What “Short and
Shallow” Implies for CRE 0.4 -0.6 -1.5 -2.9 GDP % Change -0.3 0.2 18 2008/09F* -2.6 -1.7 49 2001 -0.5 -1.4 33 1990
n/a -3.1 22 1982 Economic Rent for Office % Jobs % Change Peak to Peak in Months: Jobs Source: CBRE Torto Wheaton Research *Note: the 2008/09 forecast is the average change over the period of 6 quarters for GDP, jobs and economic rent. |
 Current U.S. Fundamentals |
 CB
Richard Ellis | Page 15 Increase in Vacancy Rates 9.0 9.2 9.5 Retail 9.4 9.4 9.8 Industrial 14.0 14.2 14.7 Suburban 10.3 9.6 9.6 Downtown
12.7% 12.6% 12.9% Office 1Q 07 4Q 07 1Q 08 Source: CBRE Torto Wheaton Research |
 CB
Richard Ellis | Page 16 Net Absorption is Slowing Source: CBRE Torto Wheaton Research -11.1 3.6 Q1 2008 160.7 56.1 2007 200.9 79.8 2006 293.4 89.3 2005 Industrial Office Millions of SF |
 U.S. Property Markets: Most Likely Outlook |
 CB
Richard Ellis | Page 18 Commercial is Not Residential Real Estate
0 0.2 0.4 0.6 0.8 1 1.2 1.4 1.6 1.8 Recession Single Family Office Industrial Retail Multi-Family Rising vacancy without a recession is a sign of overbuilding Source: CBRE Torto Wheaton Research Vacancy Rates Indexed to Their Long-Term Averages |
 CB
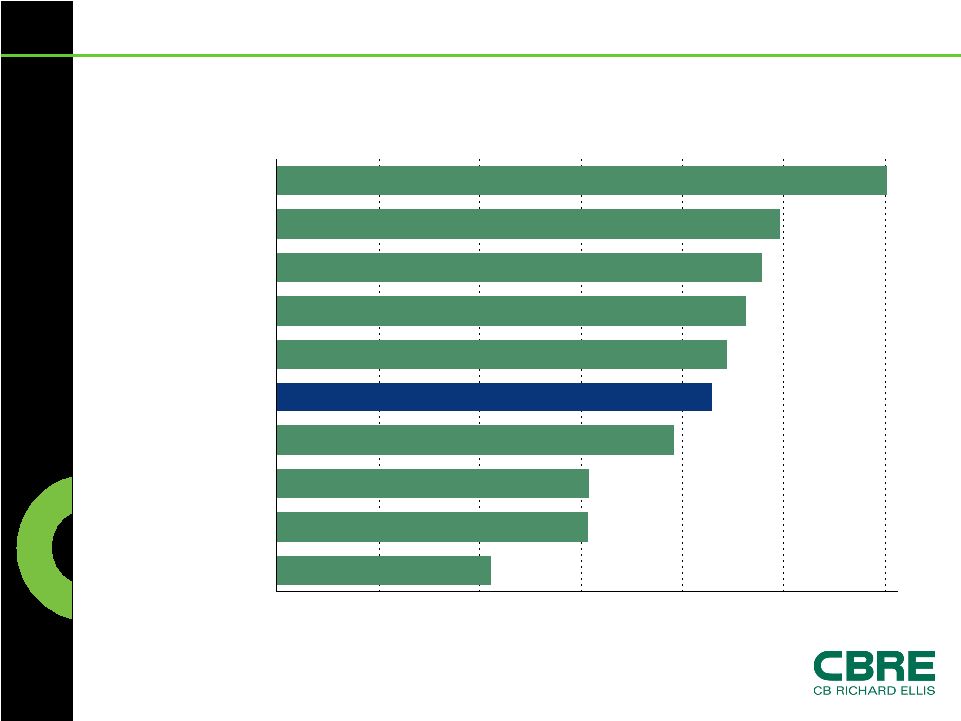
Richard Ellis | Page 19 Many Markets are Below the Long Term
Average Vacancy Source: CBRE Torto Wheaton Research Q4 2007 Office Vacancy as a % of Long Term Average 0% 20% 40% 60% 80% 100% 120% Midtown Manhattan Houston Los Angeles San Francisco All Markets Boston Phoenix Dallas Chicago Detroit |
 CB
Richard Ellis | Page 20 Summary While the global economy has slowed dramatically from 2006/07 rates, this is not and will not be a deep contraction in 2008. Hence, the impact on leasing fundamentals will be mild. However, those property markets that reside in an economy driven greatly by the housing boom, including Spain and Ireland, will be more adversely affected. Capital market froth in the commercial real estate market was driven by cheap and plentiful debt. Neither will be as cheap nor as plentiful in the near future; thus capital market transactions and pricing could reflect 2005 levels. The wide bid/ask spread will narrow quickly once we have price discovery. |