 Corporate Overview Brett White Chief Executive Officer Ken Kay Senior Executive Vice President and Chief Financial Officer Exhibit 99.1 |
| Corporate Overview Brett White Chief Executive Officer Ken Kay Senior Executive Vice President and Chief Financial Officer Exhibit 99.1 |
 CB
Richard Ellis | Page 2 Forward Looking Statements This presentation contains statements that are forward looking within the meaning
of the Private Securities Litigation Reform Act of 1995, including
statements regarding our growth momentum in 2008, future operations and
future financial performance. These statements should be considered as estimates only and actual results may ultimately differ from these estimates. Except to the extent
required by applicable securities laws, we undertake no obligation to
update or publicly revise any of the forward-looking statements that
you may hear today. Please refer to our current annual report on Form
10-K (in particular, “Risk Factors”) and our current
quarterly report on Form 10-Q, which are filed with the SEC and
available at the SEC’s website (http://www.sec.gov), for a full
discussion of the risks and other factors that may impact any estimates
that you may hear today. We may make certain statements during the course
of this presentation which include references to “non-GAAP financial measures,” as defined by SEC regulations. As required by these regulations, we have provided reconciliations of these measures to what we believe are the most directly comparable GAAP measures, which are attached hereto within the appendix. |
 CB
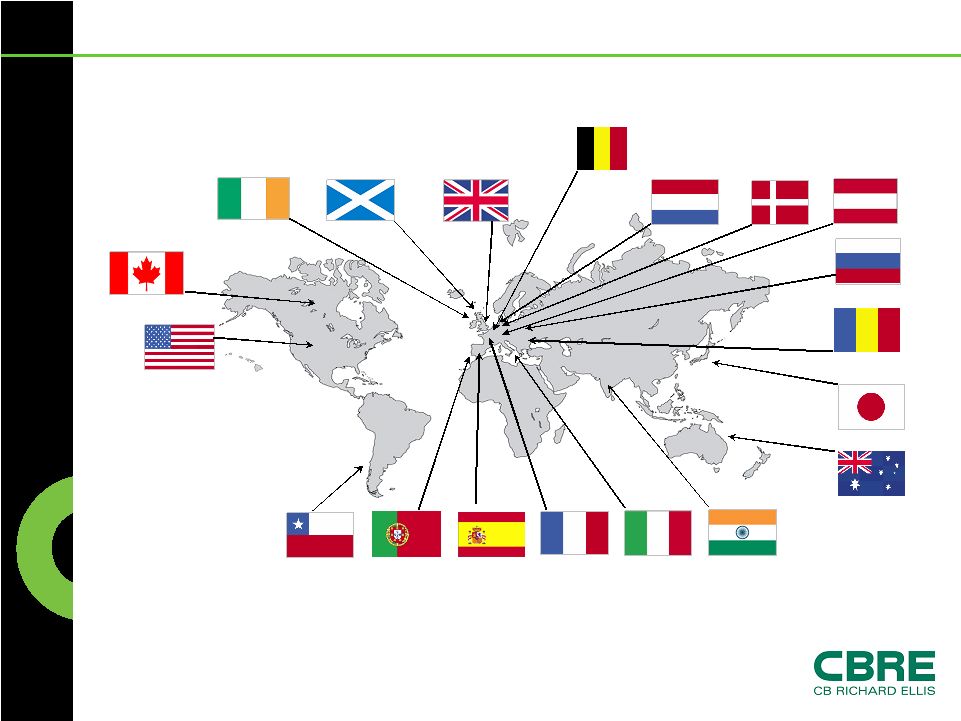
Richard Ellis | Page 3 Global Leader in Commercial Real Estate
Services 100+ years 55 countries #1 in key cities in America, Europe and Asia Pacific #1 commercial real estate brokerage #1 outsourcing #1 appraisal and valuation $42.2 billion in assets under management (1) #2 commercial mortgage brokerage $9.1 billion of development projects in process/pipeline (1) 2.3x nearest competitor Thousands of clients, 88% of Fortune 100 FY 2007 revenue of $6.0 billion FY 2007 normalized EBITDA of $1.0 billion (2) Leading Global Brand Broad Capabilities Scale, Diversity and Earnings Power (1) As of March 31, 2008 (2) Normalized EBITDA excludes one-time items, including merger-related costs,
integration costs related to acquisitions, and loss on trading securities
acquired in the Trammell Crow Company acquisition. |
 CB
Richard Ellis | Page 4 CBRE 2008 Milestones First commercial real estate services company in the Fortune 500; Ranked #404 Ranked #11 among 50 “Best-in-Class” companies World’s Most Powerful Brokerage Firm World’s Top Brokerage and Property Management Firm #1 brand for seven consecutive years Property Advisor of the Year One of the world’s leading outsourcing companies #1 Brokerage and Capital Markets Firm U.S. EPA 2008 ENERGY STAR Partner of the Year Named to “Companies that Care” 2008 Honor Roll |
 CB
Richard Ellis | Page 5 Environmental Stewardship Strategy • Global Taskforce formed • Policy – “We are committed to minimizing our environmental impact and to assisting our clients in doing the same at their properties” – Carbon neutral by 2010 – Best practices and bias towards green space (e.g. Washington DC office) – Engage 100% of our clients in dialogue – Pioneered 100-building portfolio for LEED Certification • Partnerships with NGOs (e.g., NRDC, USGBC, CCI) • Early adopter with announcement in May 2007 |
 CB
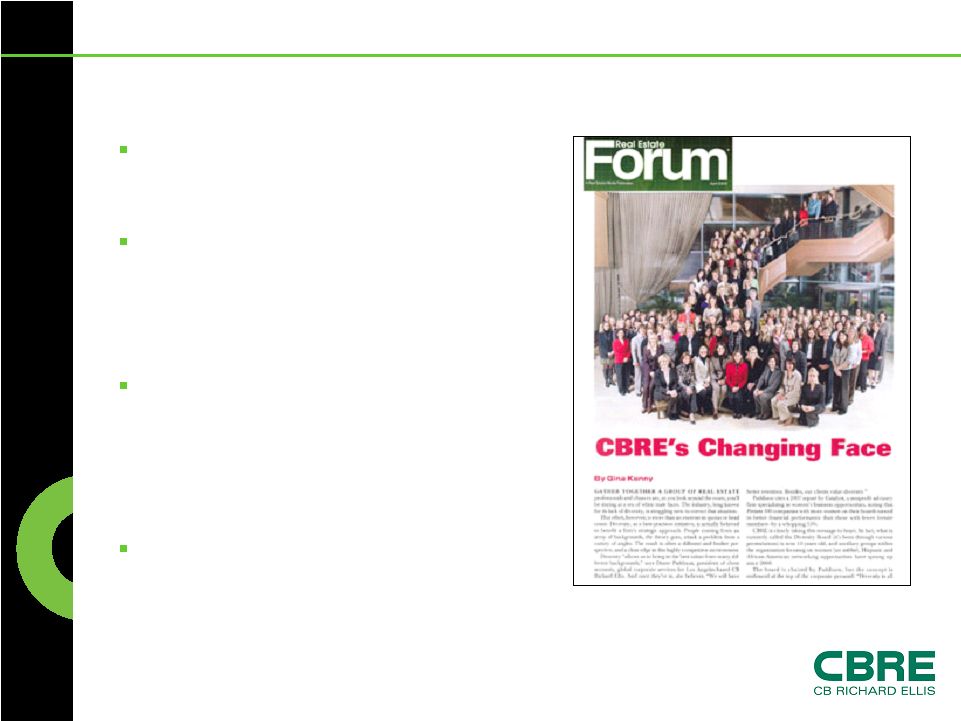
Richard Ellis | Page 6 Diversity & Employee Relations
Executive-level Diversity Board reporting to CEO Definition: “Diversity is all the unique characteristics that make up every one of us….” Affinity Groups: • Women’s Network (2000) • African-American Network Group (2004) • Hispanic Network (2007) Companies that Care Honor Roll (2008) |
 CB
Richard Ellis | Page 7 #1 Position in a Fragmented Market
4.4% 2.8% 1.9% 53.2% 25.0% 12.7% CBRE C&W JLL GBE Other/Third Party Self Providers $27 Billion U.S. Commercial Real Estate Market (1) Large and growing market—4.2% CAGR 1997-2007 Highly fragmented—top four firms have 21.8% market share Source: 2007 external public filings and CBRE management estimates as of December 31,
2007 (1) Excludes global investment management and development services
|
 CB
Richard Ellis | Page 8 Groupe Axival, Inc. CBRE Alberta CBRE Chile CBRE Gunne Paul Gee and Co. Austin Adams Dalgleish Holley Blake Oxford Property Consultants DGI Davis George Grenville Smith and Duncan Immobiliere Developpement & Gestion Modus Sogesmaint Cederholm Rietmeijer Nanninga & Taconis Rutter & Strutz Eurisko Noble Gibbons IKOMA CBRE India EDConsulting CBRE Italy Valuation Services Easyburo SAS CPMS Artequation Guy Neplaz Conseil FM Arquitectos Predibisa Neoturis DTZ Queensland McCann Property and Planning Rafter and O’Hagan DTZ Australia Bridge Real Estate pH Group GVA/Swale Hynes Realty Marketing In-Fill Acquisitions 2005 – Present Advocate Consulting Group CBRE Charlotte Columbus Commercial Realty Project Advantage The Polacheck Company CBRE Hawaii Marshall & Stevens’ Cost Segregation Businesses Krombach Partners CBRE Technical Services Blackrock Retail Property Advisors CBRE Pittsburgh Redford Properties Redstone Real Estate Advisors • 52 acquisitions completed for an aggregate purchase price of approximately $474
million. • Estimated associated annual revenue of approximately $650 million, which includes the
consolidation of the now majority owned IKOMA and CBRE India. • EBITDA margins expected to be consistent with CBRE margins upon full integration.
|
 CB
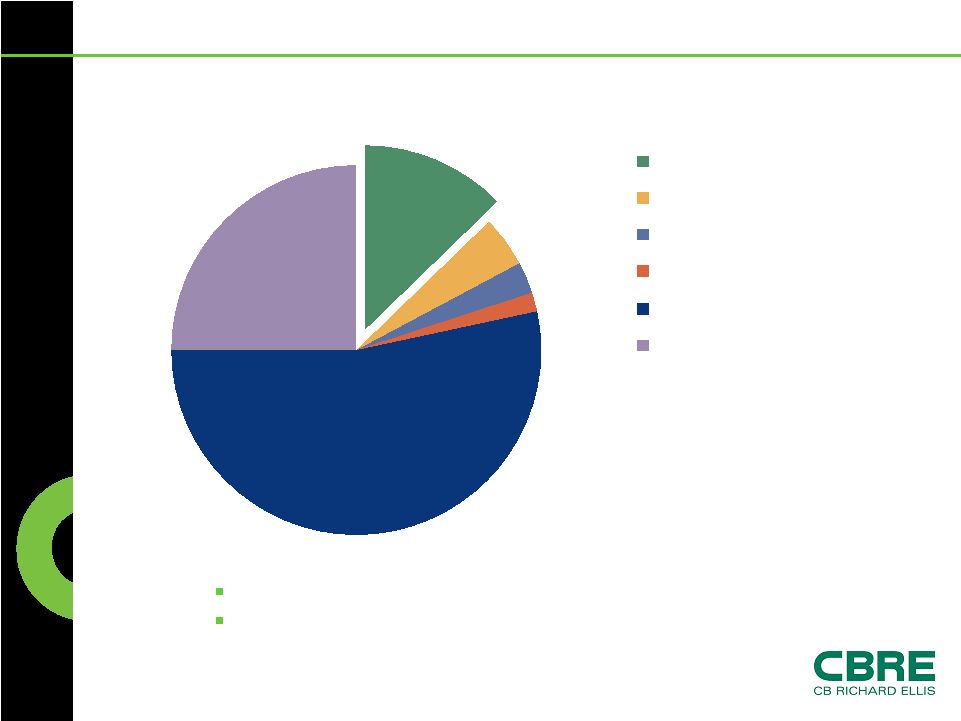
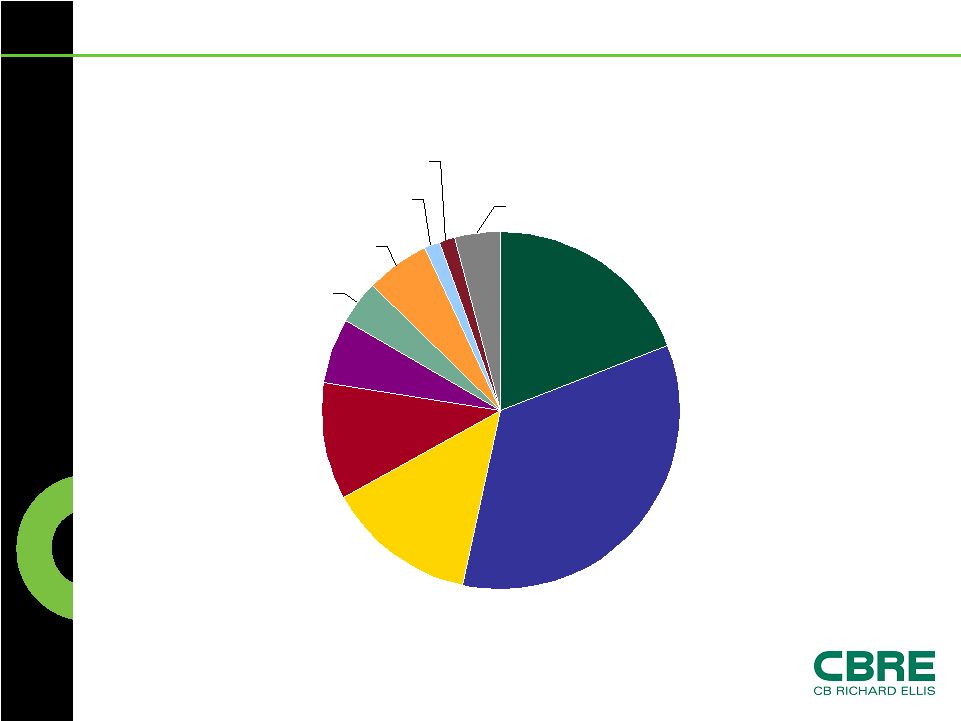
Richard Ellis | Page 9 Diverse Client Base 2007 Revenue by Client Type Corporations 34% Individuals/ Partnerships 11% REITs 6% Conduits/Wall Street Firms 4% Opportunity Funds 6% Offshore Investors 1% Pension
Funds/ P F Advisors 14% Insurance Co's/Banks 19% Other 4% Government 1% |
 CB
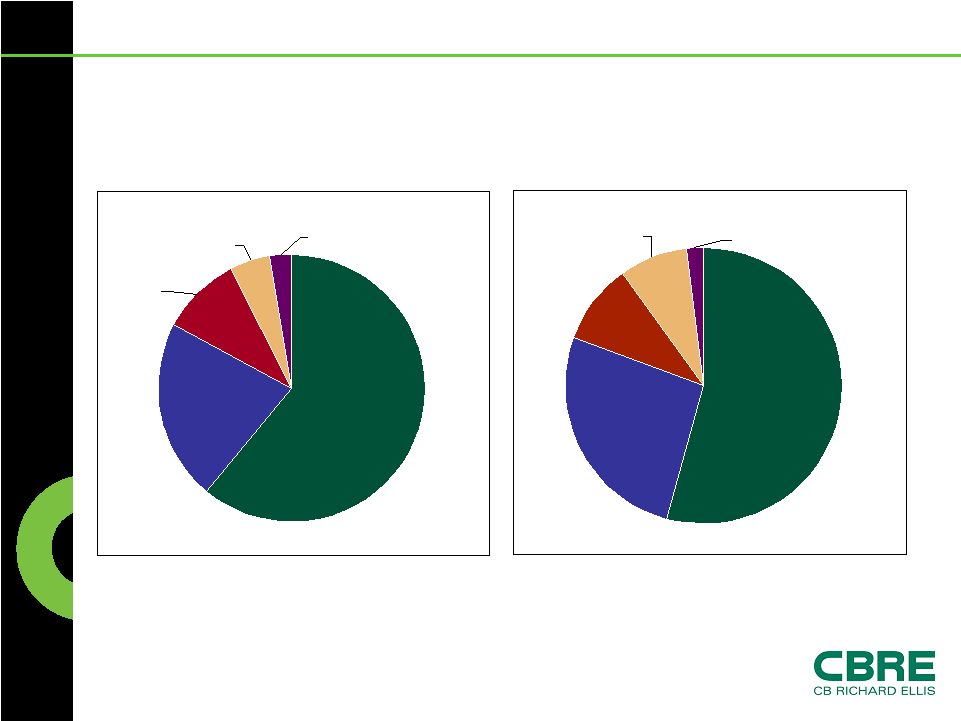
Richard Ellis | Page 10 Global Reach Q1 2008 TTM Revenue Q1 2008 TTM Normalized EBITDA (1) (1) Normalized EBITDA excludes merger-related charges, integration costs related to
acquisitions and the write down of an impaired investment. Americas 54% EMEA 26% Asia Pacific 10% Global Investment Management 8% Development Services 2% Americas 61% EMEA 22% Asia Pacific 10% Global Investment Management 5% Development Services 2% Segment Contribution |
 CB
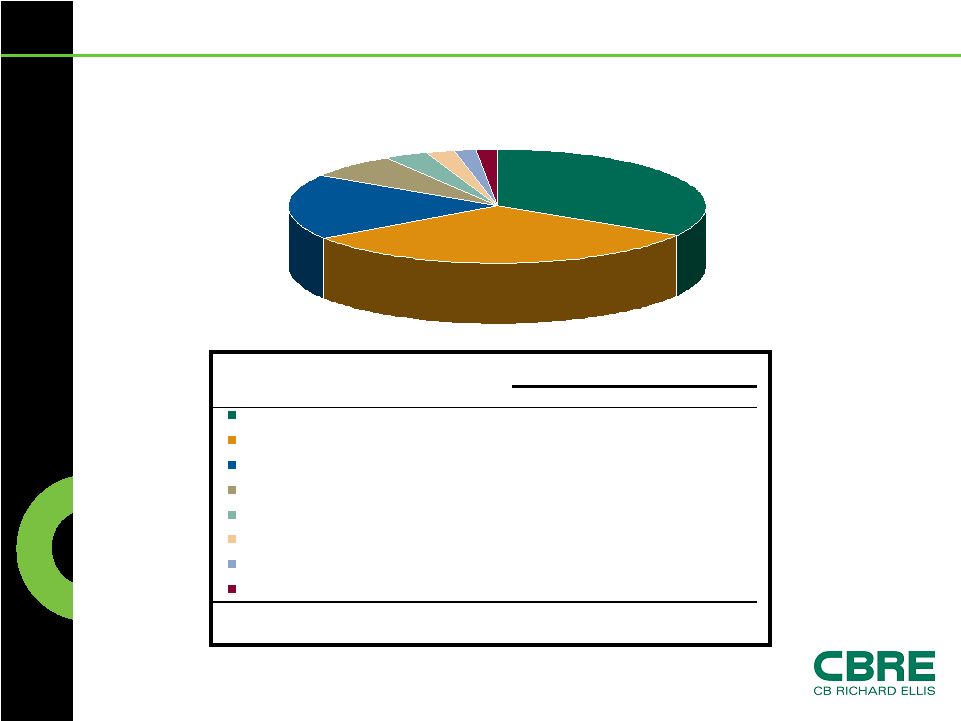
Richard Ellis | Page 11 33% 32% 19% 7% 3% 2% 2% 2% Property & Facilities Management Leasing Sales Appraisal & Valuation Investment Management Development Services Commercial Mortgage Brokerage Other Q1 2008 Revenue Breakdown ($ in millions) 2008 2007 % Change 413.2 307.8 34 394.5 328.5 20 227.9 339.0 -33 87.1 80.0 9 41.0 87.9 -53 26.2 14.6 79 21.9 40.5 -46 19.1 15.6 22 Total 1,230.9 1,213.9 1 Three months ended March 31, |
 CB
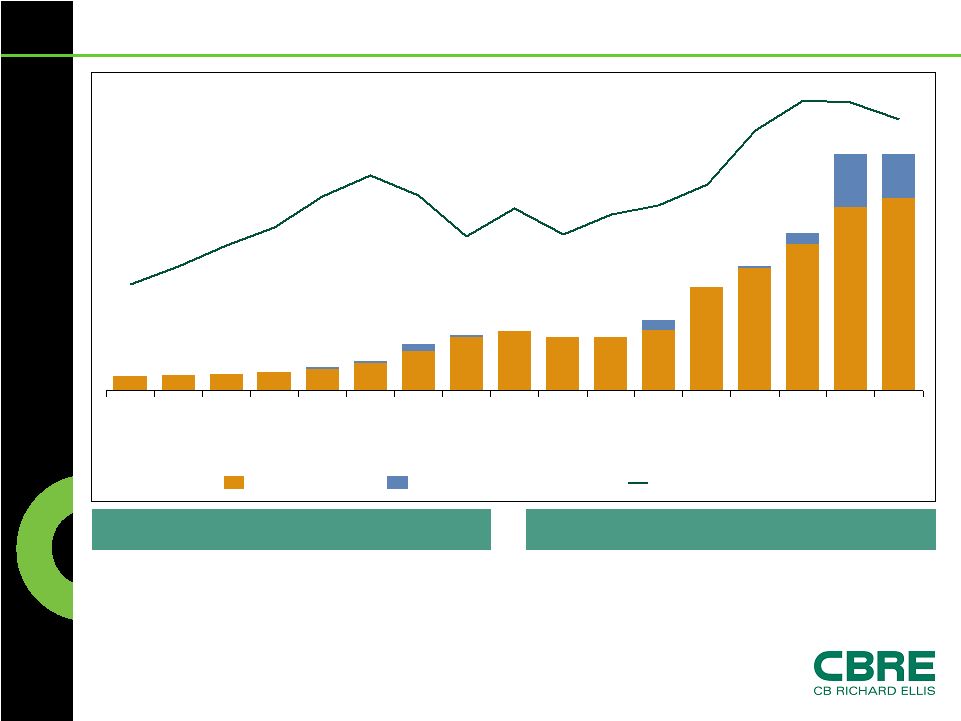
Richard Ellis | Page 12 Consistent Long Term Growth (1) Average Annual Organic Growth = 12% ($ in millions) TTM Q1 2008 Pro Forma EBITDA Margin = 16% (5) Target EBITDA Margin = 20% (1) No reimbursements are included for the period 1992 through 1996, as amounts were immaterial. Reimbursements for 1997 through 2001 have been estimated. For 2002 and forward, reimbursements are included. (2) Includes TCC activity for the period December 20, 2006 through December 31, 2006.
(3) Includes revenue from discontinued operations, which totaled $2.1 million for the three
and twelve months ended December 31, 2007. (4) Normalized EBITDA margin excludes merger-related and other non-recurring costs,
integration costs related to acquisitions, one-time IPO-related compensation expense, gains/losses on trading securities acquired in the TCC
acquisition and the write-down of an impaired investment. (5) Pro forma EBITDA margin adjusts for $55.2 million of net gains from Development
Services activities, which cannot be recognized under purchase accounting
rules. 2 3 3 5.6% 6.6% 7.9% 8.9% 10.6% 11.9% 10.7% 8.4% 9.9% 8.4% 9.6% 10.1% 11.3% 14.4% 16.2%16.1% 15.1% 360 392 429 469 583 759 1,187 1,403 1,518 1,362 1,362 1,810 2,647 3,194 4,032 6,036 6,053 1992 1993 1994 1995 1996 1997 1998 1999 2000 2001 2002 2003 2004 2005 2006 2007 TTM Q1 2008 Organic Revenue Revenue From Acquisitions Normalized EBITDA Margin 4 |
 CB
Richard Ellis | Page 13 Capitalization (1) Represents notes payable on real estate in Development Services that are recourse to
the company. Excludes non-recourse notes payable on real estate of
$512.2 million and $459.4 million at March 31, 2008 and December 31, 2007, respectively. (2) Excludes $244.2 million and $255.8 million of non-recourse warehouse facility at
March 31, 2008 and December 31, 2007, respectively, as well as $54.6
million and $42.6 million of non-recourse revolving credit facility in Development Services at March 31, 2008 and December 31, 2007, respectively. 412.7 1,692.8 2,105.5 Total net debt 414.5 3,024.2 3,438.7 Total capitalization 31.5 988.5 1,020.0 Stockholders' equity 383.0 2,035.7 2,418.7 Total debt 0.8 15.0 15.8 Other debt 2 0.8 6.6 7.4 Notes payable on real estate 1 300.0 - 300.0 Senior secured term loan A-1 (2.7) 960.0 957.3 Senior secured term loan B - 827.0 827.0 Senior secured term loan A 84.1 227.1 311.2 Revolving credit facility (29.7) 342.9 313.2 Cash Variance 12/31/2007 3/31/2008 ($ in millions) As of 412.7 1,692.8 2,105.5 Total net debt 414.5 3,024.2 3,438.7 Total capitalization 31.5 988.5 1,020.0 Stockholders' equity 383.0 2,035.7 2,418.7 Total debt 0.8 15.0 15.8 Other 0.8 6.6 7.4 Notes payable on real estate 300.0 - 300.0 Senior secured term loan A-1 (2.7) 960.0 957.3 Senior secured term loan B - 827.0 827.0 Senior secured term loan A 84.1 227.1 311.2 Revolving credit facility (29.7) 342.9 313.2 Cash Variance 12/31/2007 3/31/2008 ($ in millions) As of |
 CB
Richard Ellis | Page 14 Debt Maturity Debt Management: Projected minimal usage of the revolving credit facility Continue to analyze interest rate swap opportunities to reduce interest rate volatility No major borrowing requirement anticipated As of December 31, Maturity Date 2011 2010 2009 2008 Various $7.4 $7.4 $7.4 $7.4 Notes Payable on Real Estate 6/24/2011 - - - $32.7 Revolving Credit Facility Various $4.8 $4.8 $13.8 $13.8 Other Debt (1) $1,474.8 $195.0 $927.0 $340.6 $1,846.7 $255.0 $938.0 $632.5 $1,063.2 $135.0 $916.0 - 12/20/2013 $297.8 Senior Secured Term Loan A-1 $2,127.7 Total 12/20/2013 $949.0 Senior Secured Term Loan B 12/20/2011 $827.0 Senior Secured Term Loan A (1) Excludes non-recourse debt related to warehouse facility and Development
Services real estate activities |
 CB
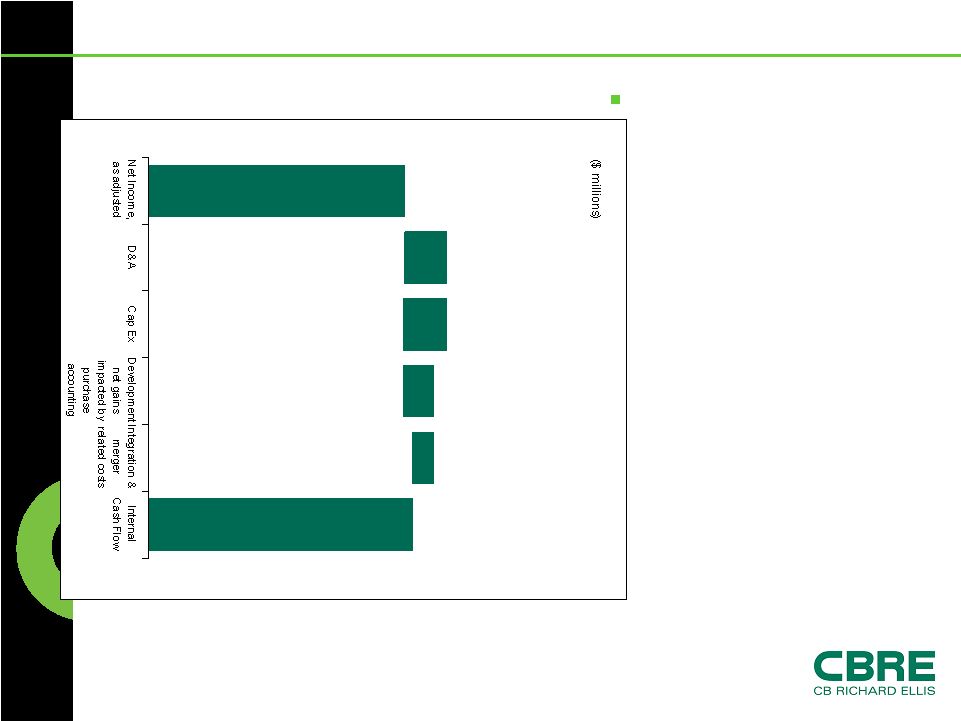
Richard Ellis | Page 15 Q1 2008 TTM Normalized Internal Cash
Flow Strong cash flow generator Low capital intensity Utilization of internal cash flow • Co-investment activities • Development • In-fill acquisitions • Debt reduction • Share repurchases 463 76 (79) 55 (38) 477 1 (1) Represents capital expenditures, net of concessions |
 GAAP Reconciliation Tables |
 CB
Richard Ellis | Page 17 Reconciliation of Normalized EBITDA to
EBITDA to Net Income (Loss) (1) Includes interest income related to discontinued operations of $0.01 million for the
year ended December 31, 2007. (2) Includes depreciation and amortization related to discontinued operations of $0.4
million for the year ended December 31, 2007. (3) Includes interest expense related to discontinued operations of $1.8 million for the
year ended December 31, 2007. (4) Includes provision for income taxes related to discontinued operations of $1.6 million
for the year ended December 31, 2007. ($ in millions) 2007 2006 2005 2004 2003 Normalized EBITDA 970.1 $ 652.5 $ 461.3 $ 300.3 $ 183.2 $ Less: Merger-related charges 56.9 - - 25.6 36.8 Integration costs related to acquisitions 45.2 7.6 7.1 14.4 13.6 Loss (gain) on trading securities acquired in the Trammell Crow Company acquisition 33.7 (8.6) - - - One-time compensation expense related to the initial public offering - - - 15.0 - EBITDA 834.3 653.5 454.2 245.3 132.8 Add: Interest income (1) 29.0 9.8 9.3 4.3 3.8 Less: Depreciation and amortization (2) 113.7 67.6 45.5 54.9 92.8 Interest expense (3) 164.8 45.0 54.3 65.4 71.3 Loss on extinguishment of debt - 33.8 7.4 21.1 13.5 Provision (benefit) for income taxes (4) 194.3 198.3 138.9 43.5 (6.3) Net income (loss) 390.5 $ 318.6 $ 217.3 $ 64.7 $ (34.7) $ Revenue 6,036.3 4,032.0 3,194.0 2,547.1 1,810.1 Normalized EBITDA Margin 16.1% 16.2% 14.4% 11.3% 10.1% Year Ended December 31, |
 CB
Richard Ellis | Page 18 Reconciliation of Normalized EBITDA to
EBITDA to Net Income (Loss) (1) Includes activity related to discontinued operations for the three months ended
December 31, 2007, including interest income of $0.01 million, depreciation
and amortization of $0.4 million, interest expense of $1.8 million and provision for income taxes of $1.6 million. 162.8 TTM Q1 2008 ($ in millions) Consolidated Americas EMEA Asia Pacific Global Investment Management Development Services (1) Normalized EBITDA 912.8 $ 495.2 $ 239.2 $ 87.1 $ 72.8 $ 18.5 $ Less: Merger-related charges 25.1 23.8 1.2 - - 0.1 Integration costs related to acquisitions 38.6 36.6 1.9 0.1 - - Write-down of impaired investment 10.6 10.6 - - - - EBITDA 838.5 424.2 236.1 87.0 72.8 18.4 Add: Interest income 27.2 11.8 7.4 0.9 1.2 5.9 Less: Depreciation and amortization 110.2 72.4 12.6 6.9 3.0 15.3 Interest expense 165.8 134.9 1.2 3.7 3.0 23.0 Royalty and management service (income) expense - (31.3) 21.6 8.1 1.6 - Provision (benefit) for income taxes 190.7 107.6 45.3 25.0 17.3 (4.5) Net income (loss) 399.0 $ 152.4 $ $ 44.2 $ 49.1 $ (9.5) $
Revenue 6,053.3 3,681.3 1,331.4 592.1 301.8 146.7 Normalized EBITDA Margin 15.1% 13.5% 18.0% 14.7% 24.1% 12.6% |
 CB
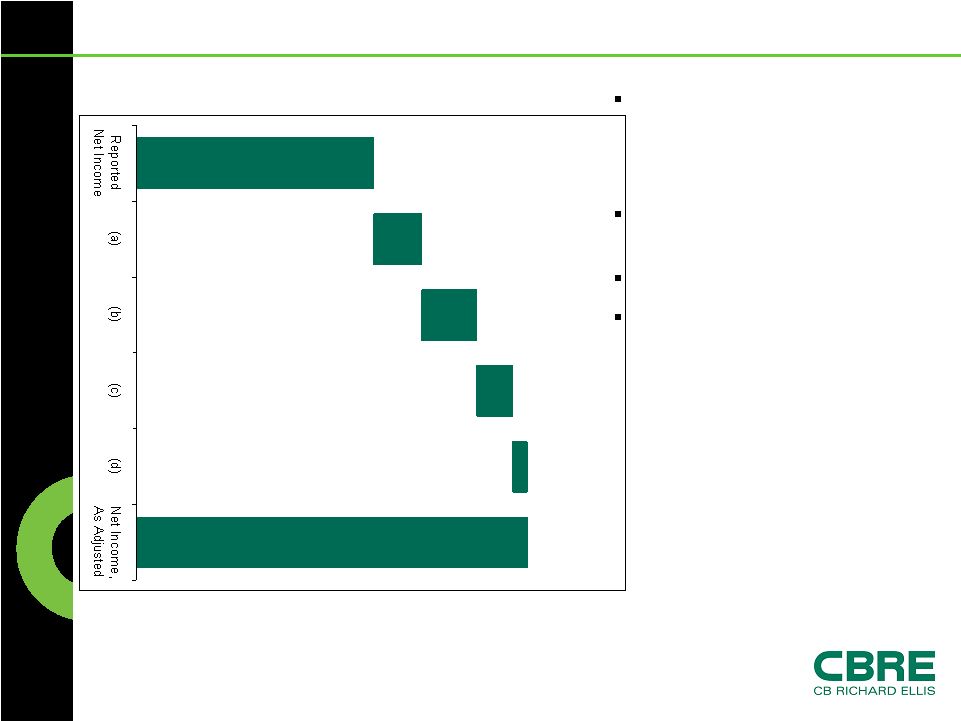
Richard Ellis | Page 19 Reconciliation of Net Income to Net Income,
As Adjusted TTM Q1 2008 Results 399 20 23 15 6 463 Amortization expense related to net revenue backlog, incentive fees and customer relationships acquired (1) Integration costs related to acquisitions (1) Merger-related charges (1) Write-down of impaired investment (1) (1) Net of tax. |