 Business Review
Day U.S. Real Estate: Healthy Moderation Raymond G. Torto, Ph.D CBRE Principal and Chief Strategist Torto Wheaton Research May 18, 2007 Exhibit 99.7 |
| Business Review
Day U.S. Real Estate: Healthy Moderation Raymond G. Torto, Ph.D CBRE Principal and Chief Strategist Torto Wheaton Research May 18, 2007 Exhibit 99.7 |
 CB Richard Ellis |
Page 2 CB Richard Ellis | Page 2 What Did We Say Last Year? Economy healthy but wide variance across cities Single family housing and condo oversupply a developing issue for economy Capital will continue to flow to real estate on diversification merits Cap rates were unlikely to go much lower, the direction of interest rates is up Commercial real estate fundamentals would continue strong for 2006 |
 Economy in 2007
|
 CB Richard Ellis |
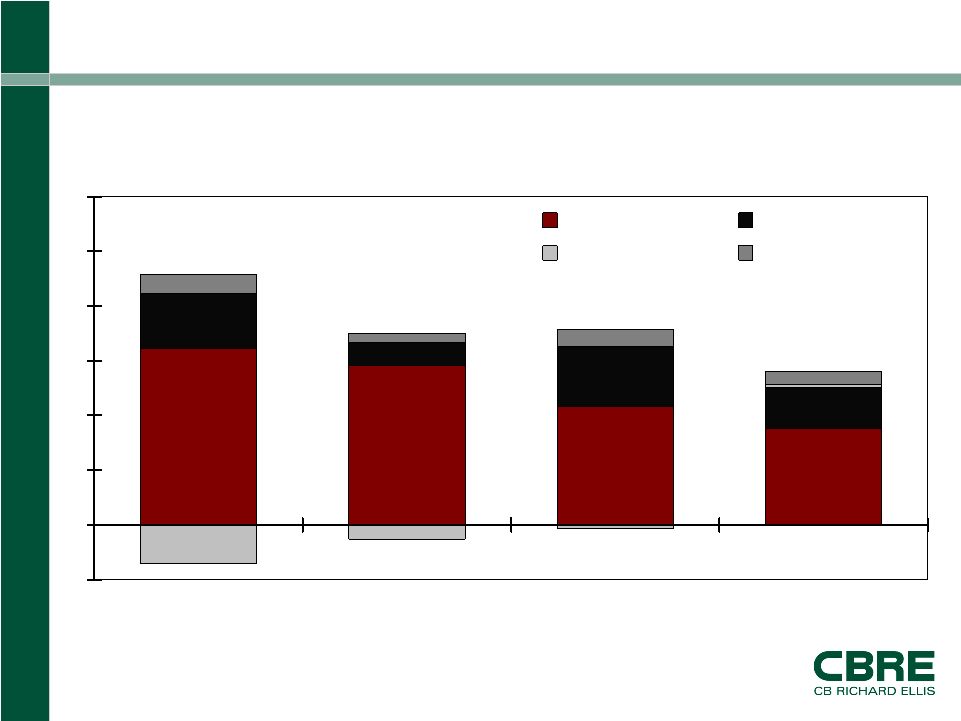
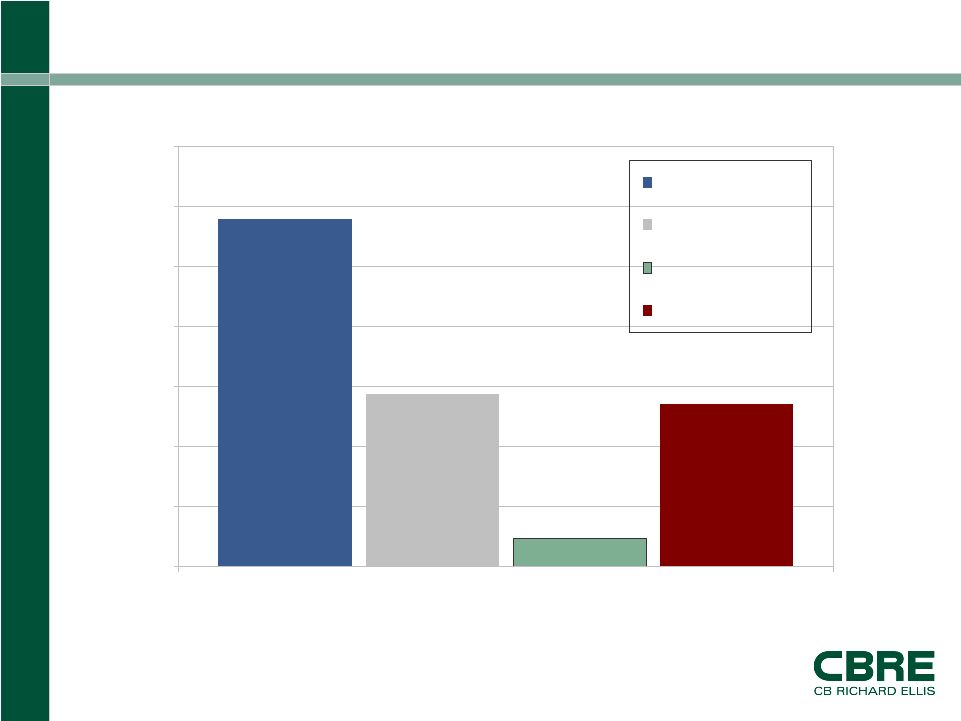
Page 4 CB Richard Ellis | Page 4 -1 0 1 2 3 4 5 6 04 05 06 07 Household Business Trade Government 3.9% 3.2% 3.4% 2.8% Source: Moody’s Economy.com GDP Growth Slows and Shifts: Consumers to Business Real GDP Growth |
 CB Richard Ellis |
Page 5 CB Richard Ellis | Page 5 As One Part of the Economy Slows, Another Keeps Going Source: BLS -1.0 -0.5 0.0 0.5 1.0 1.5 2.0 2.5 Service-producing Goods-producing Employment, % change year ago |
 CB Richard Ellis |
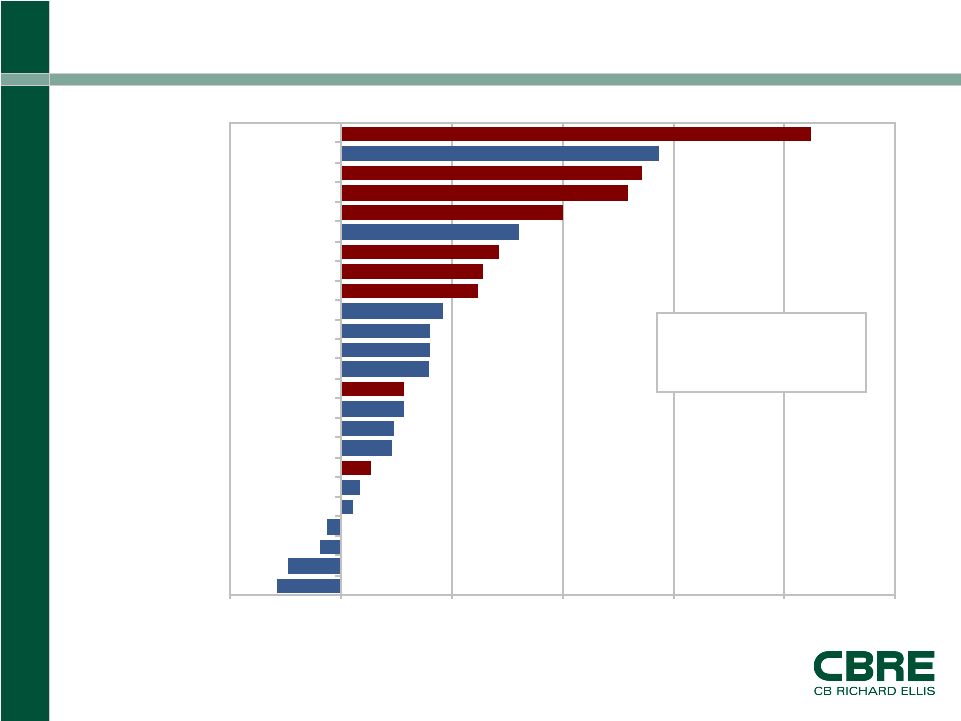
Page 6 CB Richard Ellis | Page 6 Notice the Diversity and High-Quality of Jobs Being Produced Source: BLS -2 0 2 4 6 8 10 Durable mfg. Nondurable mfg. Federal gov't. Construction Retail trade Utilities Legal services Information Other services Admin. services Financial State gov't. Local gov't. Wholesale trade Distribution Education HQ Healthcare Leisure & hospitality Architect & Engin. Accounting Computer systems Mining Technical consult. April job creation, % change year ago High-value added services producing industries |
 Housing Issues
|
 CB Richard Ellis |
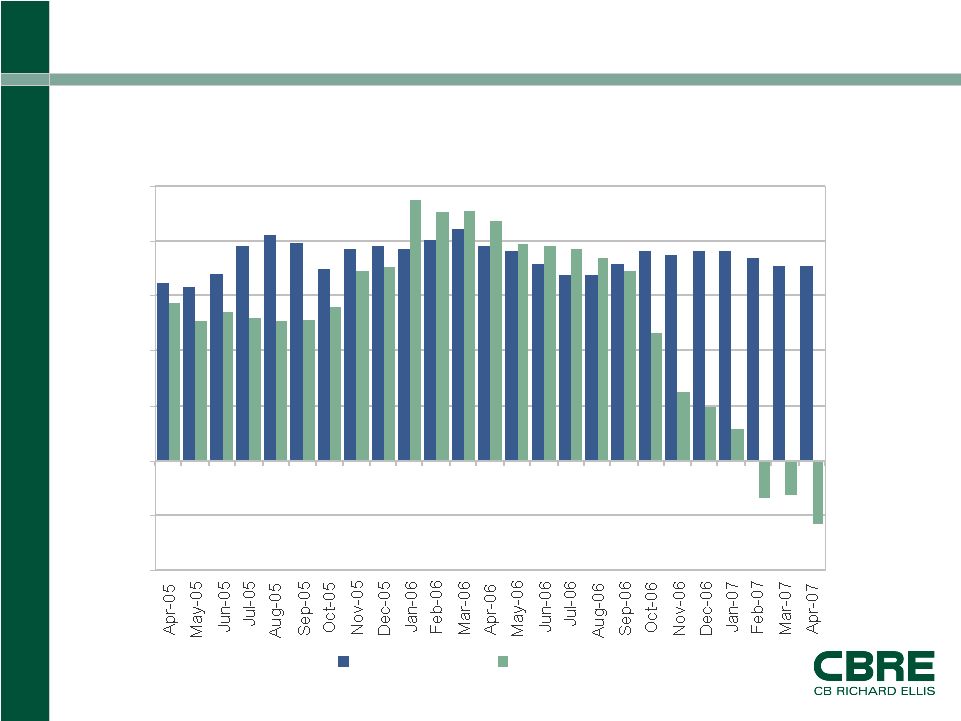
Page 8 CB Richard Ellis | Page 8 This Is No Coincidence! 5 10 15 20 25 30 35 40 45 1999Q1 2000Q1 2001Q1 2002Q1 2003Q1 2004Q1 2005Q1 2006Q1 2007Q1 4 5 6 7 8 9 10 11 12 13 14 Retail Space Absorption ( L ) House Prices ( R ) Retail space absorption, Sum of markets, 4-qtr moving sum, mil sqft Existing single family house price, % change year ago Source: OFHEO, BEA |
 CB Richard Ellis |
Page 9 CB Richard Ellis | Page 9 New Condo Supply is Concentrated * Units underway with target completion in 2007. Source: TWR/Dodge Pipeline West Palm Beach 0 5 10 15 20 Miami Tampa Orlando Phoenix Las Vegas Fort Lauderdale 2006 2007* Condo Units Completed, Ths. |
 Weight of
Capital |
 CB Richard Ellis |
Page 11 CB Richard Ellis | Page 11 Expected Performance Moderating 10.2 8.5 3.8 13.0 4.9 11.1 8.8 11.9 2006 Actual Returns** Other Hedge Funds Money Market Funds/Cash Equivalents Venture Capital/Private Equity Fixed Income Foreign Equities U.S. Stocks All Real Estate Sector 8.2 8.5 4.0 12.3 5.4 9.5 8.5 9.3 2007 Return Expectations ** “2006 Actual Returns” represents the projected returns through 12/31/06 provided in the 2007 Plan Sponsor Survey Source: Kingsley Associates
2007 |
 CB Richard Ellis |
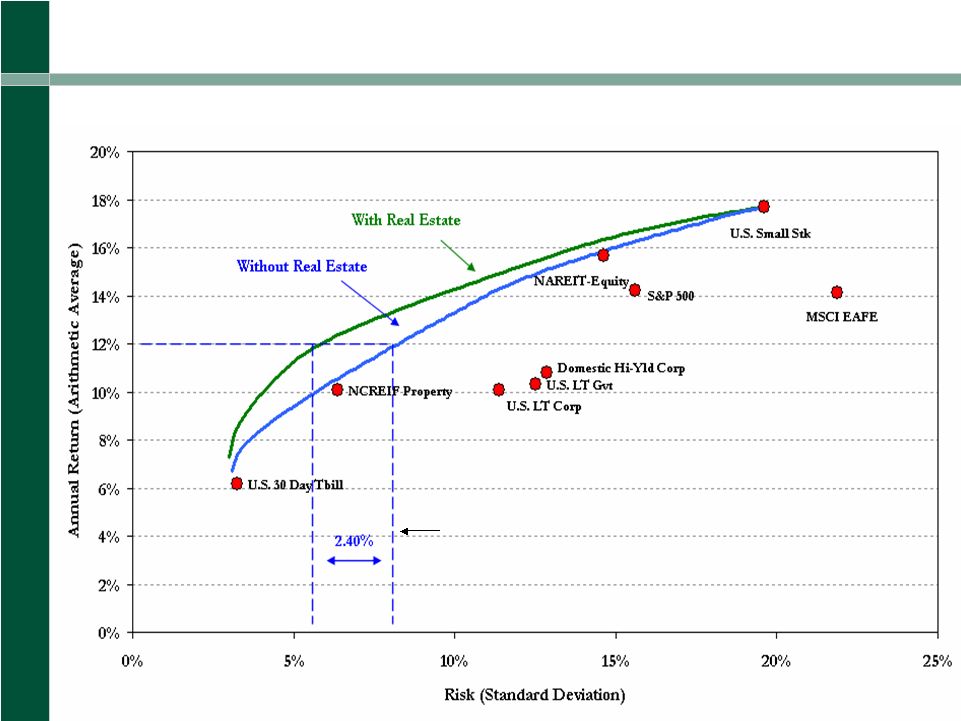
Page 12 CB Richard Ellis | Page 12 Efficient Frontiers with and without Real Estate Selected Asset Classes for the Twenty-eight Year Period 1978–2005 An Illustration of “Free Lunch” 2.40% Free Lunch Prior to the last three years the “free lunch” was 1.74% |
 CB Richard Ellis |
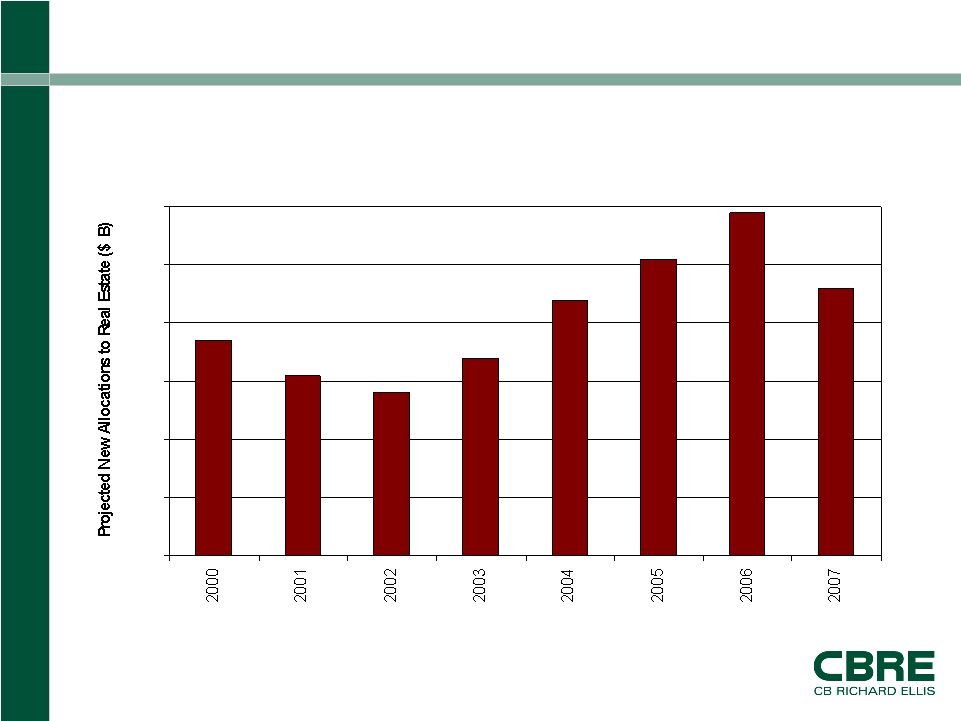
Page 13 CB Richard Ellis | Page 13 Institutional Intentions Moderating: New Money Flow Receding Expected Capital Flows to Real Estate 37 31 28 34 44 51 59 46 $0 $10 $20 $30 $40 $50 $60 Source: Kingsley Associates 2007 Plan Sponsor Survey
|
 CB Richard Ellis |
Page 14 CB Richard Ellis | Page 14 Market Velocity Remains Strong Source: Real Capital Analytics, April 2007 2007 1Q Chg Yr Ago 2006 ($) Office $76.4B 225% $137.3B Retail $17.5B 96% $51.7B Industrial $9.8B -20% $41.7B Multi-Housing $19.0B -28% $89.6B Total $122.7B 73% $320.3B |
 CB Richard Ellis |
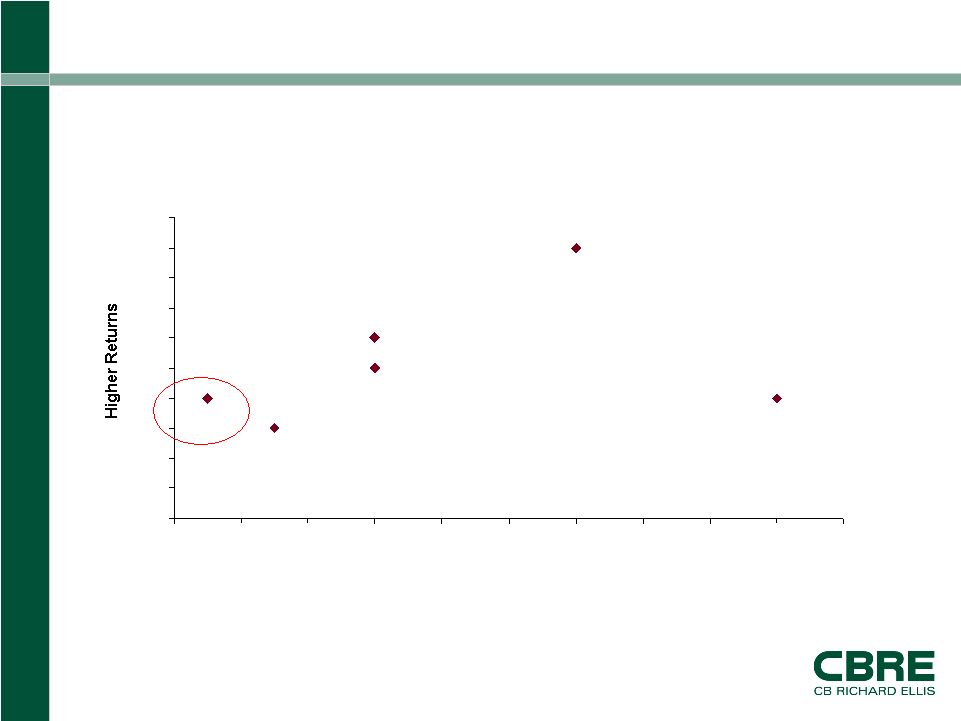
Page 15 CB Richard Ellis | Page 15 Return-Risk Tradeoffs USA Canada UK Australia Ireland Sweden 6 7 8 9 10 11 12 13 14 15 16 6 7 8 9 10 11 12 13 14 15 16 More Volatile |
 CB Richard Ellis |
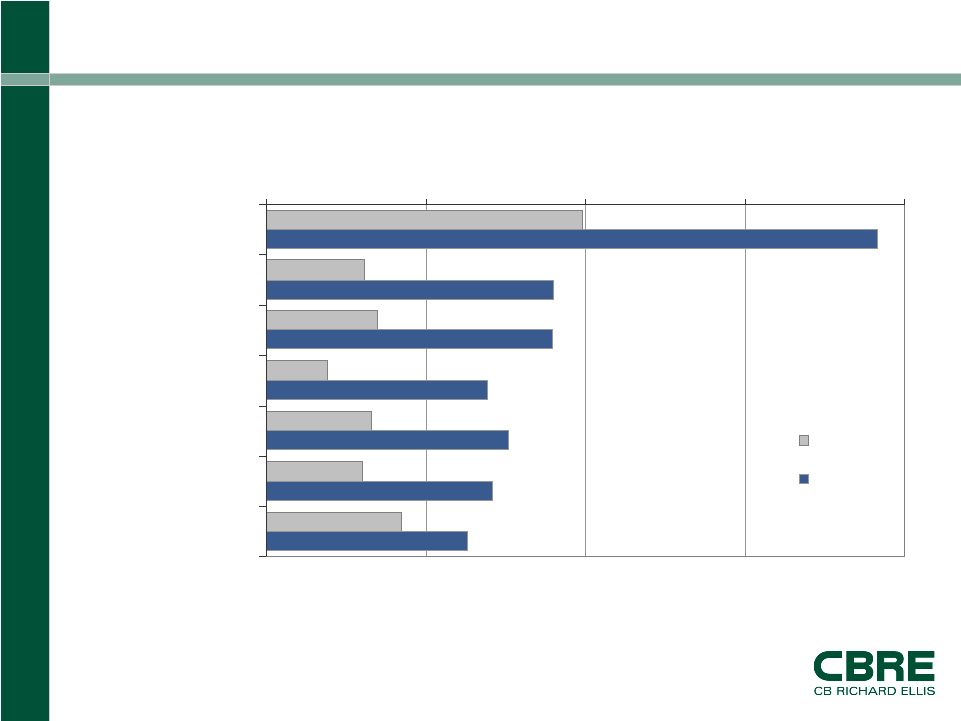
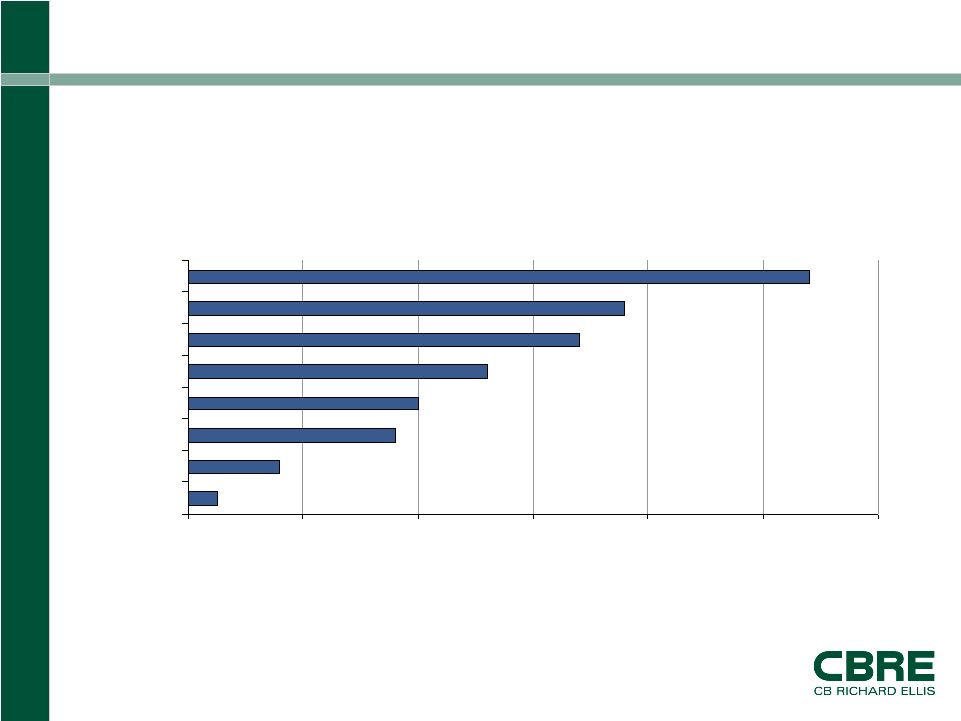
Page 16 CB Richard Ellis | Page 16 Incoming Capital (2006 Top Investors in U.S. Real Estate) Source: Real Capital Analytics, April 2007 Incoming Capital (2006 top investors in U.S. real estate) $0 $1 $2 $3 $4 $5 $6 Other United Kingdom Europe Germany Canada Pacific Rim Australia Middle East ($ in Billions) |
 Real Estate
Pricing |
 CB Richard Ellis |
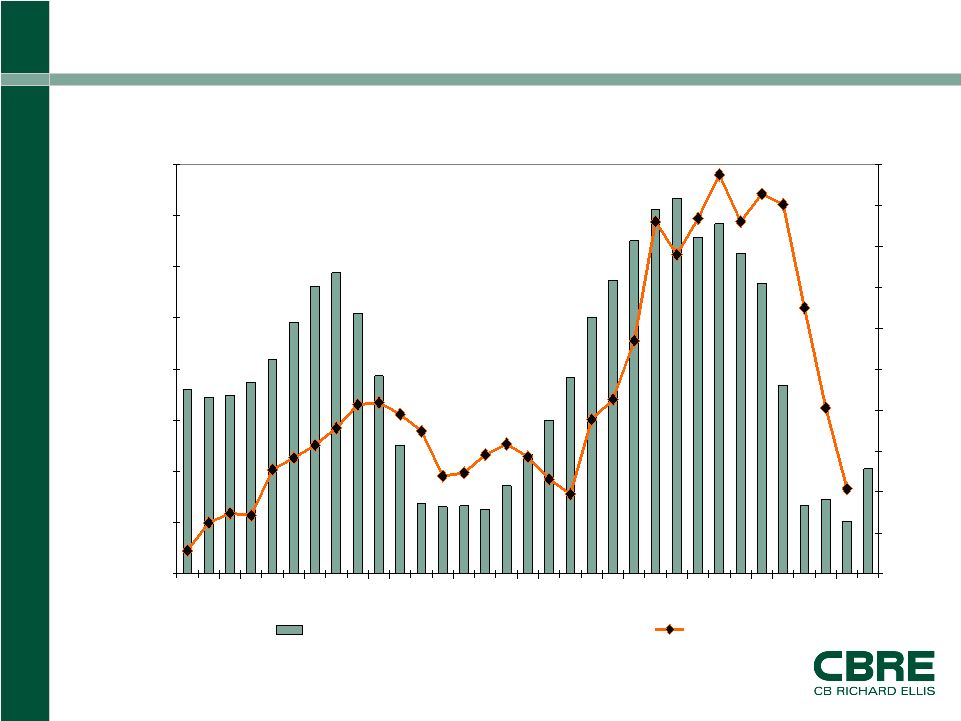
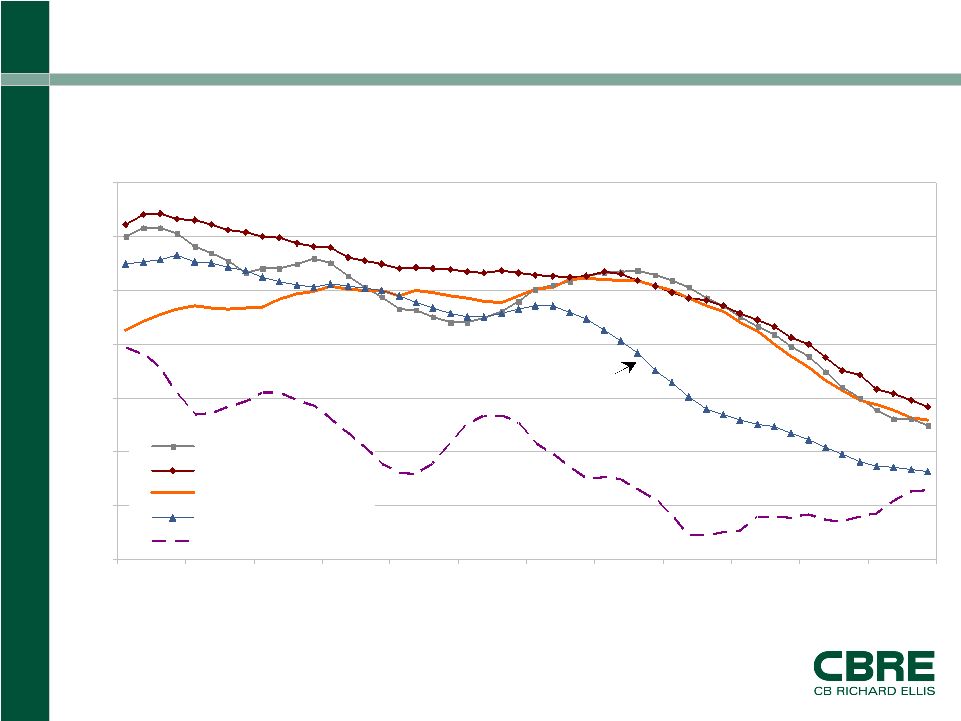
Page 18 CB Richard Ellis | Page 18 Source: NCREIF, Torto Wheaton Research Cap Rate Compression… 3.5 4.5 5.5 6.5 7.5 8.5 9.5 10.5 95Q1 96Q1 97Q1 98Q1 99Q1 00Q1 01Q1 02Q1 03Q1 04Q1 05Q1 06Q1 Office Industrial Retail Multi-housing 10yr. Treasury (4-qtr. MAVE) Cap rate, % Multi-housing |
 CB Richard Ellis |
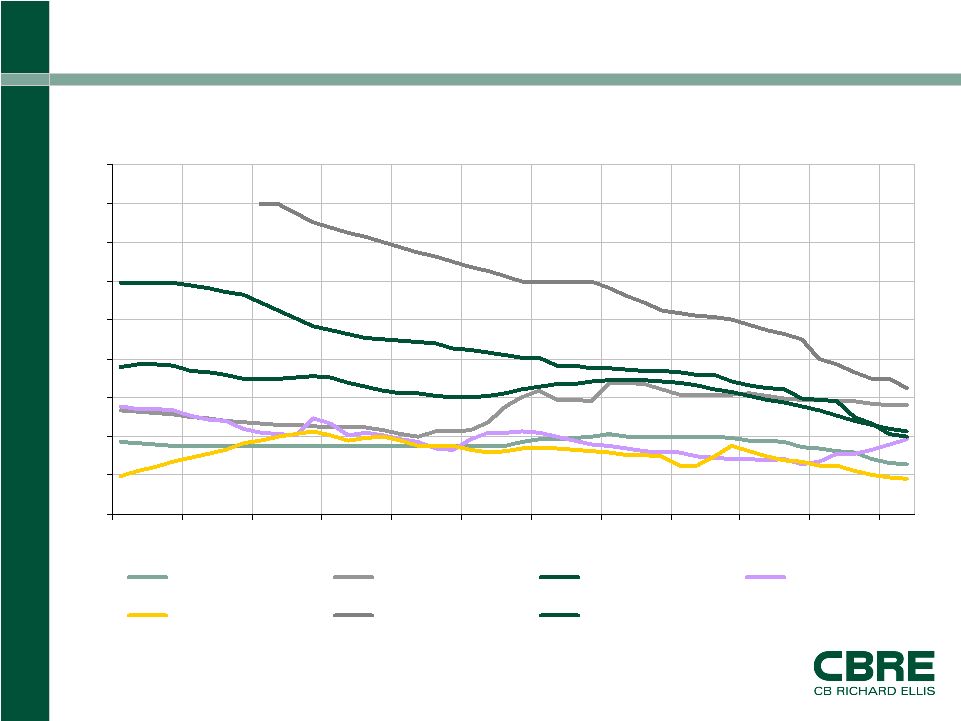
Page 19 CB Richard Ellis | Page 19 Sources: CBRE, NCREIF, IPD, Torto Wheaton Research …Is Across the Globe 2 4 6 8 10 12 14 16 18 20 1995 1996 1997 1998 1999 2000 2001 2002 2003 2004 2005 2006 Western Europe Oceania North America Southeast Asia Japan Mexico Central Europe Cap Rates/Prime Yield, % |
 CB Richard Ellis |
Page 20 CB Richard Ellis | Page 20 The Easy Money Has Been Made! Office, Industrial, Retail, Multi-Housing: NCREIF Weighted Source: TWR Investment Database, Fall 2006 5.4% 11.3% 5.7% 0% 2% 4% 6% 8% 10% 12% 14% Total Return Yield NOI Growth Cap Rate Contribution 5 Year Hold |
 Fundamental
Matters! |
 CB Richard Ellis |
Page 22 CB Richard Ellis | Page 22 Nevertheless Rents Will Do Better Than Inflation Percentage Increase in Rents by Property Type Source: TWR Outlook XL, Spring 2007 5.2% (1999) 2.8% 3.3% 3.8% Retail 10.8% (2000) 3.7% 4.8% 1.4% Industrial 13.6% (2000) 3.8% 5.3% 5.3% Office 8.0% (2001) 3.1% 3.1% 4.4% Multi- Housing Last High 5 Year Forecast 2007F 2006 |
 CB Richard Ellis |
Page 23 CB Richard Ellis | Page 23 Trusted Advice. Proven Performance. Sign up for our free weekly commentary “About Real Estate” at www.tortowheatonresearch.com Torto Wheaton Research 200 High Street, 3rd Floor Boston, MA 02110 Tel: 617.912.5200 Fax: 617.912.5240 |