 Business Review
Day Corporate Overview Brett White President and Chief Executive Officer Ken Kay Chief Financial Officer May 18, 2007 Exhibit 99.1 |
| Business Review
Day Corporate Overview Brett White President and Chief Executive Officer Ken Kay Chief Financial Officer May 18, 2007 Exhibit 99.1 |
 CB Richard Ellis |
Page 1 This presentation contains statements that are forward looking within the meaning of the Private Securities Litigation Reform Act of 1995, including statements regarding our growth momentum in 2007, future operations and future financial performance. These statements should be considered as estimates only and actual results may ultimately differ from these estimates. Except to the extent required by applicable securities laws, we undertake no obligation to update or publicly revise any of the forward-looking statements that you may hear today. Please refer to our current annual report on Form 10-K (in particular, “Risk Factors”) and our current quarterly report on Form 10-Q which are filed with the SEC and available at the SEC’s website (http://www.sec.gov), for a full discussion of the risks and other factors that may impact any estimates that you may hear today. We may make certain statements during the course of this presentation which include references to “non-GAAP financial measures,” as defined by SEC regulations. As required by these regulations, we have provided reconciliations of these measures to what we believe are the most directly comparable GAAP measures, which are attached hereto within the appendix. Forward Looking Statements |
 Company
Overview |
 CB Richard Ellis |
Page 3 (1) As of 3/31/2007. (2) Combined Revenue includes $764.7 million for TCC for the period April 1, 2006 through December 20,
2006. (3) EBITDA excludes one-time items, including merger-related costs, integration costs related to
acquisitions, and gains/losses on trading securities acquired in the TCC acquisition.
Combined normalized EBITDA includes $102.1 million for TCC for the period April 1, 2006 through December 20, 2006. 2.5x nearest competitor Thousands of clients, 85% of Fortune 100 Q1 2007 TTM combined CBRE & TCC Revenue of $5.3 billion (2) Q1 2007 TTM combined CBRE & TCC EBITDA of $832.5 million (3) Strong organic revenue and earnings growth #1 commercial real estate brokerage #1 appraisal and valuation #1 property and facilities management #2 commercial mortgage brokerage $30.6 billion in investment assets under management (1) $8.4 billion of development projects in process/pipeline (1) Leading Global Brand Broad Capabilities Scale, Diversity and Earnings Power 100 years 50 countries #1 in key cities in U.S., Europe and Asia The World Class Commercial Real Estate Services Provider |
 CB Richard Ellis |
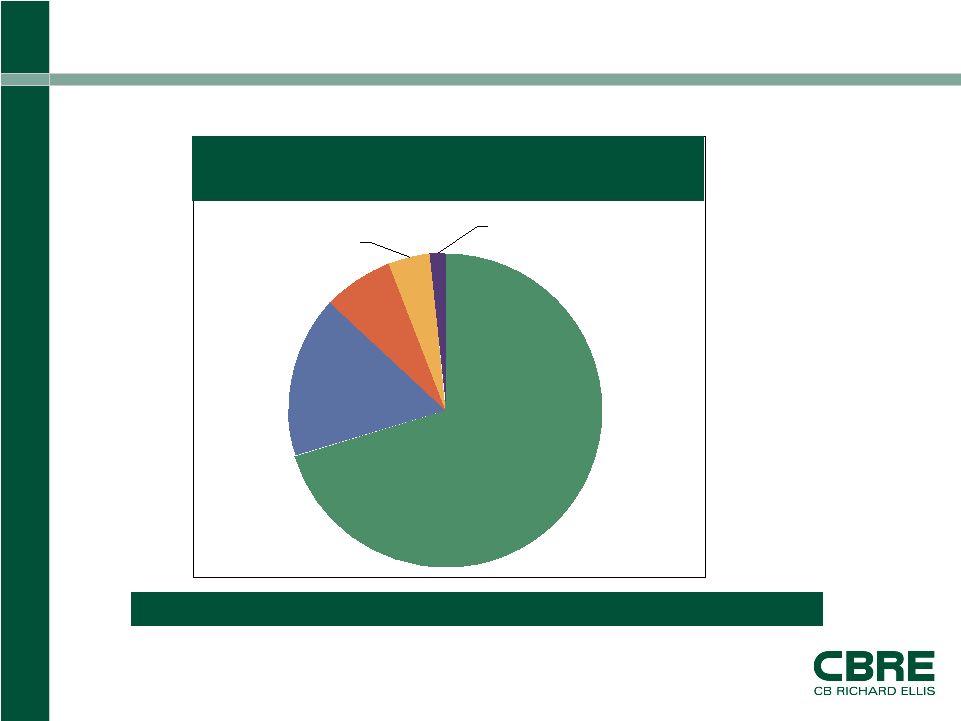
Page 4 Global Reach & Local Leadership 2006 Revenue by Region (1) Diversified revenues spread across a broad geographic footprint. (1) Includes TCC revenue. Americas 70.3% Development Services 1.4% Global Investment Management 4.5% EMEA 16.7% Asia-Pacific 7.1% |
 CB Richard Ellis |
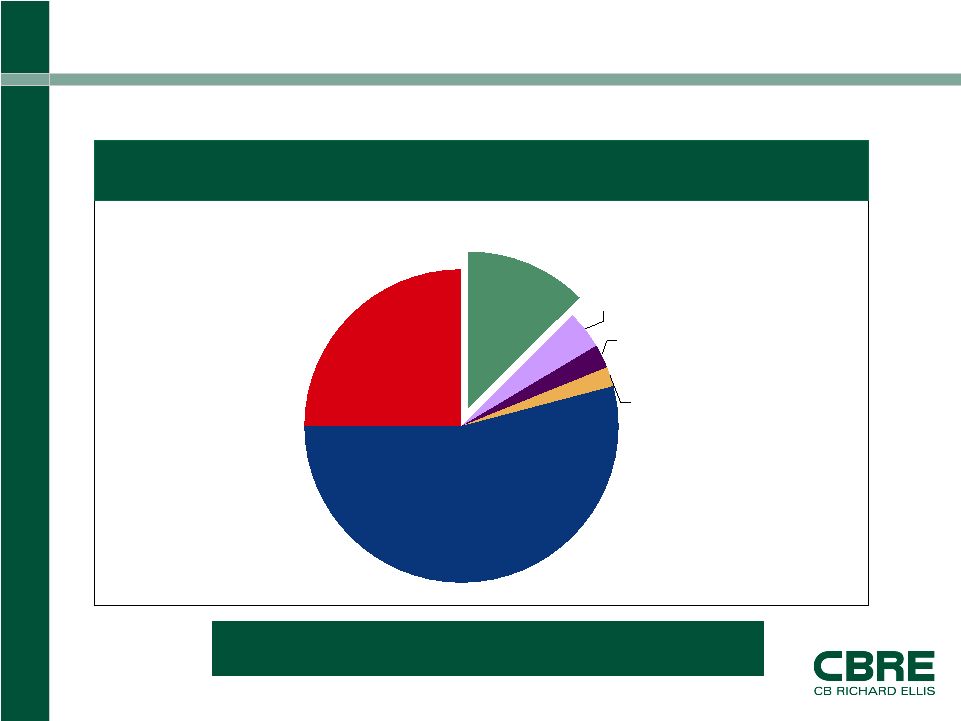
Page 5 #1 Position in a Fragmented Market $26 Billion US Commercial Real Estate Services Industry (1) U.S. Market Share Top 4 = 20.7% Share Source: Full year 2006 external public filings and management estimates. (1) Excludes investment management and development. Includes reimbursable expenses. The market is large but still highly fragmented and has grown at a 4.3% CAGR from 1996 to 2006. CBRE 12.6% Self Providers 25.0% JLL 2.4% C&W 3.8% GBEL 1.9% Other/3rd Party 54.3% |
 CB Richard Ellis |
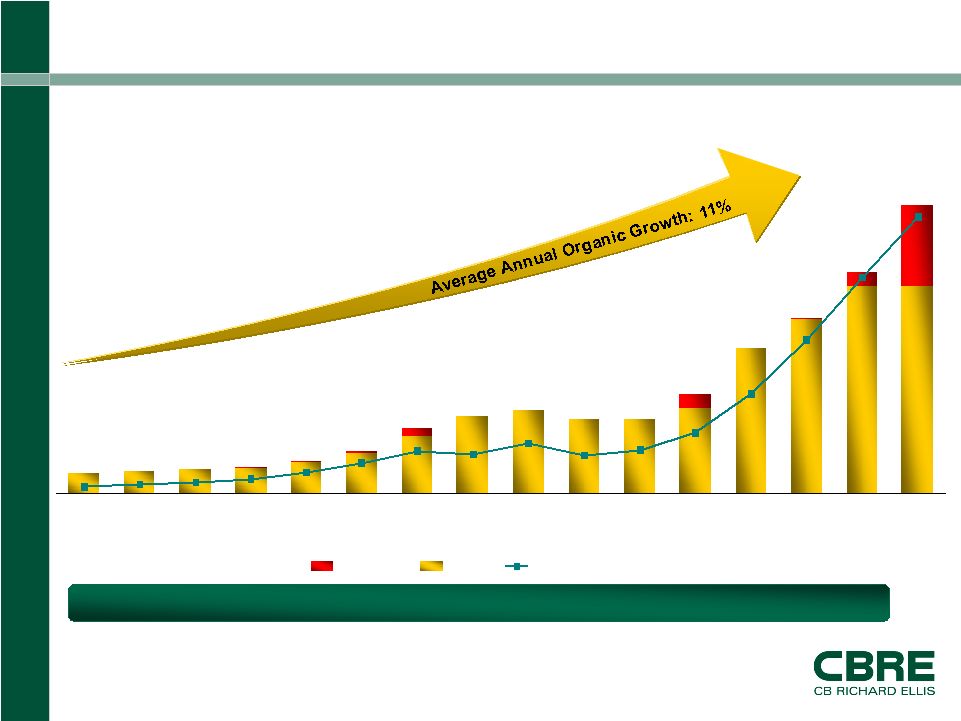
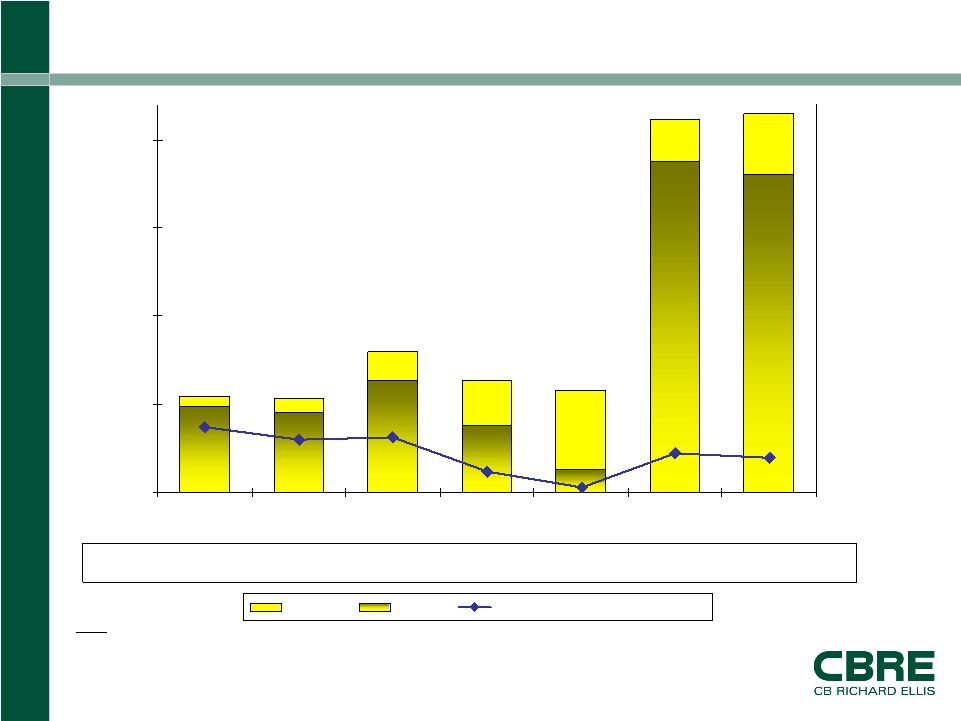
Page 6 Consistent Long Term Growth (1) CBRE has consistently outpaced industry growth. (1) No reimbursements are included for the period 1992 through 1996 as amounts were immaterial. Reimbursements for 1997 through 2001 have been estimated. For 2002 through TTM Q1 2007 combined, reimbursements are included. (2) TCC is included for the full 12 month period. (3) Normalized EBITDA excludes merger-related and other non-recurring costs,
integration costs related to acquisitions, one-time IPO-related
compensation expense and gains/losses on trading securities acquired in the TCC acquisition. (3) ($ in millions) (2) $360 $392 $429 $469 $583 $759 $1,187 $1,403 $1,518 $1,362 $1,362 $1,810 $3,194 $4,032 $5,259 $2,647 $117.4 $150.5 $115.0 $130.7 $183.2 $300.3 $461.3 $127.2 $20.2 $25.9 $33.7 $41.5 $62.0 $90.1 $652.5 $832.5 1992 1993 1994 1995 1996 1997 1998 1999 2000 2001 2002 2003 2004 2005 2006 TTM Q1 2007 Acquisitions Organic Normalized EBITDA Combined |
 CB Richard Ellis |
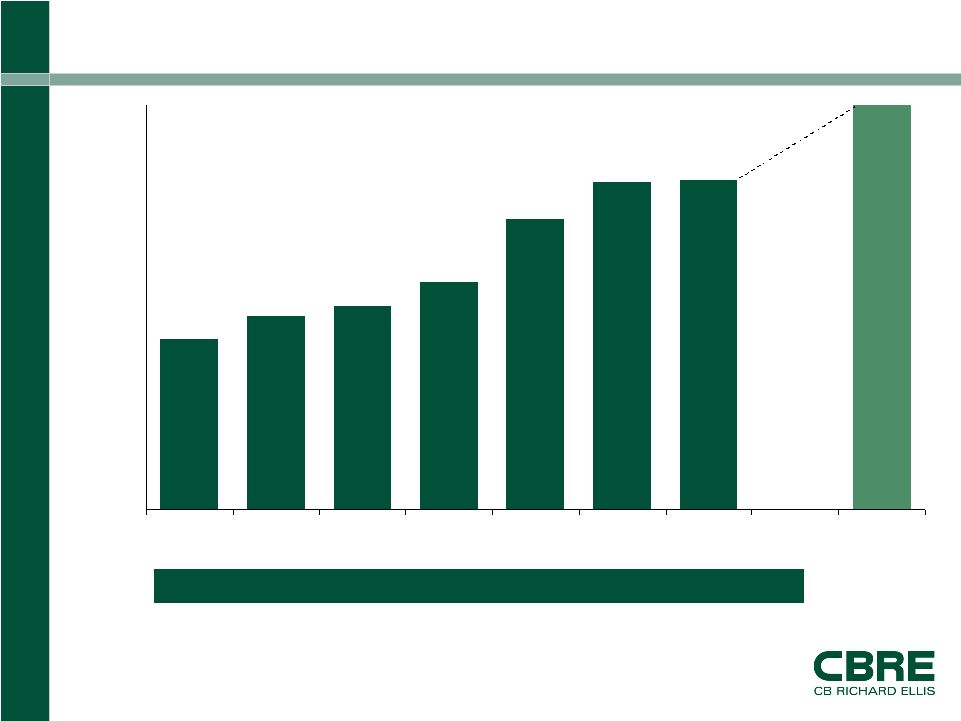
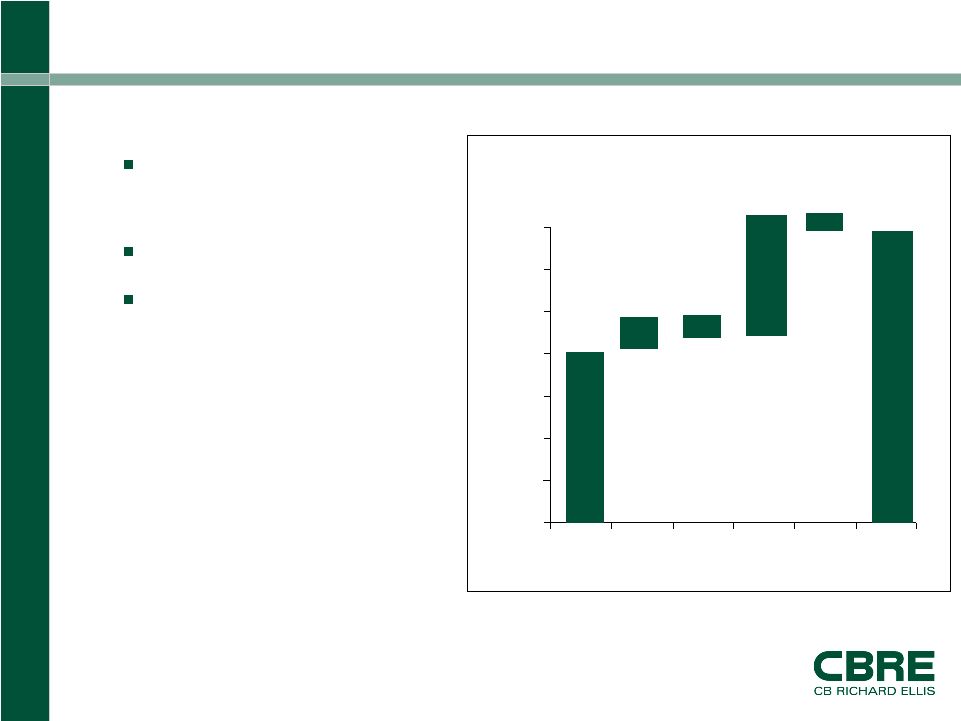
Page 7 Normalized EBITDA Margins (1) 8.4% 9.6% 10.1% 11.3% 14.4% 16.2% 16.3% 20.0% 0.0% 5.0% 10.0% 15.0% 20.0% 2001 2002 2003 2004 2005 2006 TTM Q1 2007 Future Combined (1) Normalized EBITDA margins exclude merger-related and other non-recurring costs, integration costs
related to acquisitions, one-time IPO-related compensation expense and gains/losses on
trading securities acquired in the TCC acquisition. (2) 2001 reimbursements are estimated. (3) Includes TCC activity for the period December 20, 2006 through December 31, 2006. (4) Q1 2007 TTM includes TCC for the period December 20, 2006 through March 31, 2007. CBRE has consistently improved its EBITDA margin. (2) (3) (4) |
 CB Richard Ellis |
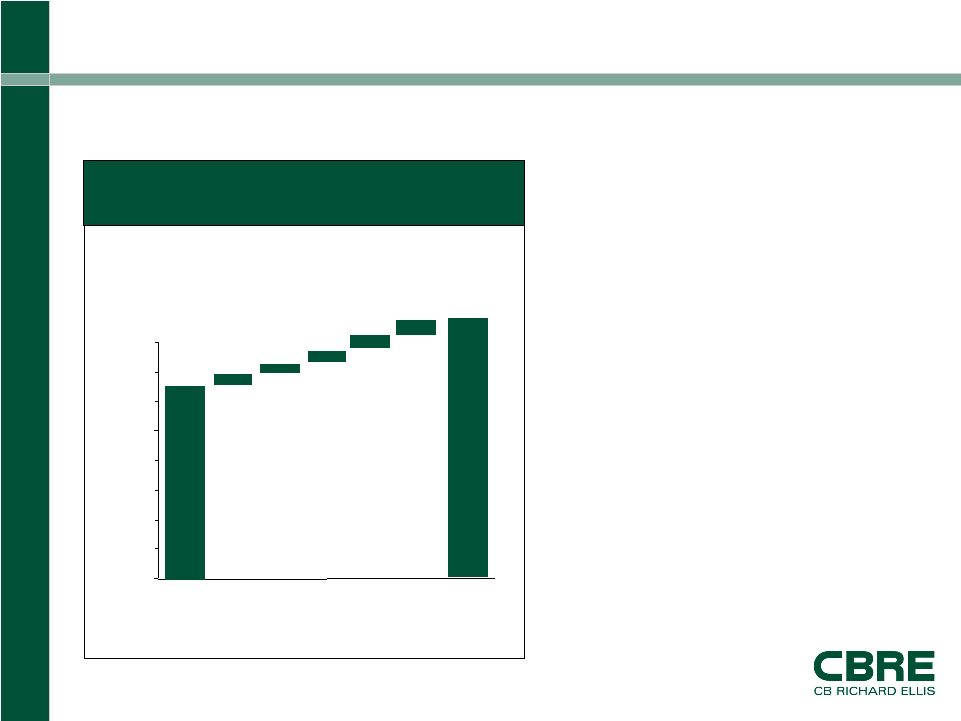
Page 8 Debt Highlights ($ in millions) Notes: - Normalized EBITDA excludes merger-related and other non-recurring costs,
integration costs related to acquisitions, one-time IPO-related compensation expense and gains/losses on trading securities acquired in the TCC
acquisition. - 2006 combined normalized EBITDA includes $106.5 million for TCC for the period January
1, 2006 through December 20, 2006. - 3/31/07 TTM Combined Normalized EBITDA includes $102.1 million for TCC for the period
April 1, 2006 through December 20, 2006. - Total debt excludes non-recourse debt. $798.4 $634.6 $577.3 $2,118.1 $2,149.0 $450.1 $634.5 $128.0 $1,873.6 $1,802.7 $543.9 $529.8 $377.7 $486.5 4.2x 3.4x 2.5x 2.2x 1.3x 0.3x 3.5x $0 $500 $1,000 $1,500 $2,000 12/31/01 12/31/02 12/31/03 12/31/04 12/31/05 12/31/06 Combined 3/31/07 TTM Combined 0.0x 5.0x 10.0x 15.0x 20.0x 25.0x Total Debt Net Debt Net Debt to Normalized EBITDA Normalized EBITDA:
$115 $131 $183
$300 $461 $759
$833 |
 CB Richard Ellis |
Page 9 (1) Represents capital expenditures, net of concessions. Q1 2007 TTM Combined Normalized Internal Cash Flow Strong cash flow generator Low capital intensity Utilization of internal cash flow • Debt reduction • Co-investment activities • Development • In-fill acquisitions - 100 200 300 400 500 600 700 ($ millions) 373 Net Income, as adjusted D&A Cap Ex (39) 601 Internal Cash Flow (1) 53 240 (26) Net proceeds from Savills disposition Integration and merger related costs |
             CB Richard Ellis | Page
10 2007 Key Drivers of Earnings Growth Revenue growth, margin expansion and deleveraging allow CBRE to achieve substantial earnings growth. = + + Revenue Growth Market growth Market share gains Cross selling In-fill acquisitions 2006 revenue growth = 26% Margin Expansion Synergy savings Operating leverage Fixed cost controls 2006 Normalized EBITDA growth = 41% Deleveraging Balance Sheet Term loan pay down 2006 net debt paydown: $548.9 million Significant EPS Growth Estimated 30% growth 2006 Adjusted EPS growth = 48% |
 Appendix
|
 CB Richard Ellis |
Page 12 Appendix Reconciliation of Normalized EBITDA to EBITDA to Net Income (Loss) ($ in millions) Q1 2007 TTM 2006 2005 2004 2003 2002 Normalized EBITDA 730.4 652.5 461.3 300.3 183.2 130.7 Less: Merger-related and other non-recurring charges 31.8 - - 25.6 36.8 - Loss(Gain) on trading securities acquired in the Trammell Crow Company acquisition 25.1 (8.6) - - - - Integration costs related to acquisitions 18.4 7.6 7.1 14.4 13.6 - One-time compensation expense related to the initial public offering - - - 15.0 - - EBITDA 655.1 653.5 454.2 245.3 132.8 130.7 Add: Interest income 13.2 9.8 9.3 4.3 3.6 3.2 Less: Depreciation and amortization 80.0 67.6 45.5 54.9 92.6 24.6 Interest expense 73.0 45.0 54.3 65.4 71.3 60.5 Loss on extinguishment of debt 33.8 33.8 7.4 21.1 13.5 - Provision (benefit) for income taxes 187.8 198.3 138.9 43.5 (6.3) 30.1 Net income (loss) 293.7 318.6 217.3 64.7 (34.7) 18.7 Revenue 4,494.6 4,032.0 3,194.0 2,647.1 1,810.1 1,361.8 Normalized EBITDA Margin 16.3% 16.2% 14.4% 11.3% 10.1% 9.6% Year Ended December 31, |
 CB Richard Ellis |
Page 13 Appendix Reconciliation of Net Income to Net Income, As Adjusted - 50 100 150 200 250 300 350 400 (a) Amortization expense related to net revenue backlog, incentive fees and customer relationships acquired (1) (b) Integration costs related to acquisitions (1) (c) Loss on trading securities acquired in the Trammell Crow Company acquisition (1) (d) Merger-related costs (1) (e) Costs of extinguishment of debt (1) Net Income, As Adjusted TTM 1st Quarter 2007 Results ($ millions) 294 373 14 11 Reported Net Income (a) (b) (c) (1) Net of tax. 15 19 (d) 20 (e) |