Business Review
Day
Manhattan Market
Outlook
May 17, 2006
John Powers
Co-Chairman, New York Tri-State Region
Exhibit 99.5
| Business Review
Day Manhattan Market Outlook May 17, 2006 John Powers Co-Chairman, New York Tri-State Region Exhibit 99.5 |
 CB
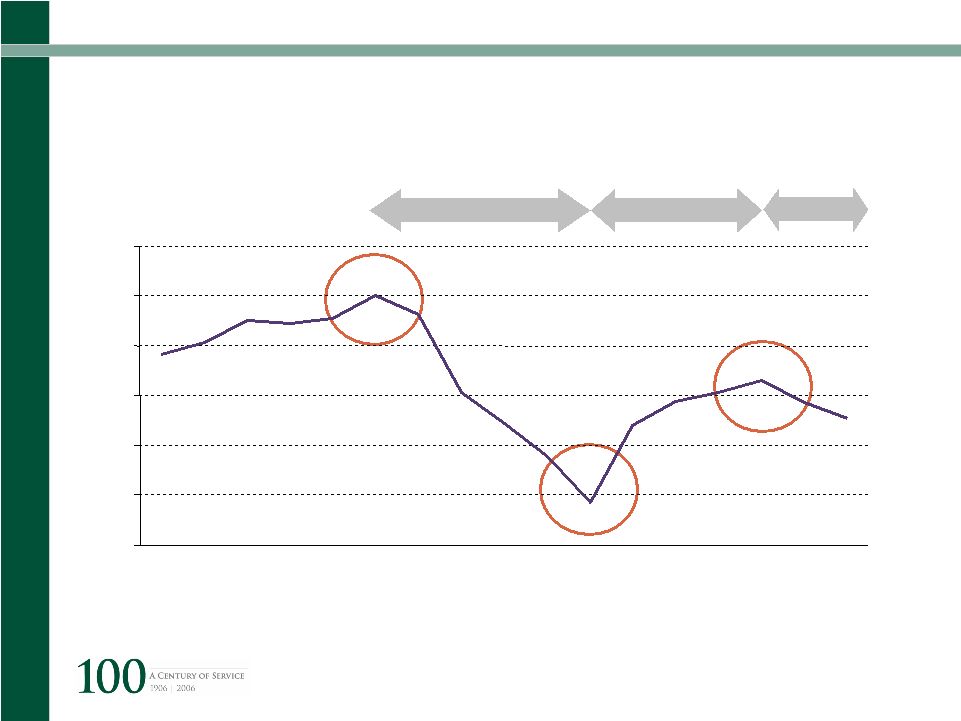
Richard Ellis | Page 2 Downhill Speed Reconsidering Price Constraints |
 CB
Richard Ellis | Page 3 Downhill Speed Reconsidering Price Constraints |
 CB
Richard Ellis | Page 4 National Economy GDP Growth Strong |
 CB
Richard Ellis | Page 5 U.S. Economy Overview: U.S. GDP (2002 – 2006 YTD) First Quarter 2006 Real GDP up 4.8% 0.0 1.0 2.0 3.0 4.0 5.0 6.0 7.0 8.0 Q1 '02 Q1 '03 Q1 '04 Q1 '05 Q1 '0 |
 CB
Richard Ellis | Page 6 4.9% 1.5% 4Q ’05 4.7% 1.5% 1Q ‘06 5.1% Unemployment Rate 1.6% Job Growth 3Q ’05 Economic Performance Source: Federal Reserve Bank |
 CB
Richard Ellis | Page 7 3.8% -0.3% 9.4% 4Q ’05 7.6% 7.9% Personal Consumption 3.2% 6.7% 1Q ‘06 4.2% Productivity 2.6% Personal Income 3Q ’05 Economic Performance Source: Federal Reserve Bank |
 CB
Richard Ellis | Page 8 109.6 107.5 102.7 Consumer Confidence 87.4 N/A N/A N/A April 88.9 1.9% 7.9% 4.2% March 86.7 Consumer Sentiment 2.5% New Housing Starts (1) 6.7% Retail Sales (1) 0.4% Durable Goods (1) February (1) Year over year Economic Performance Source: Federal Reserve Bank |
 CB
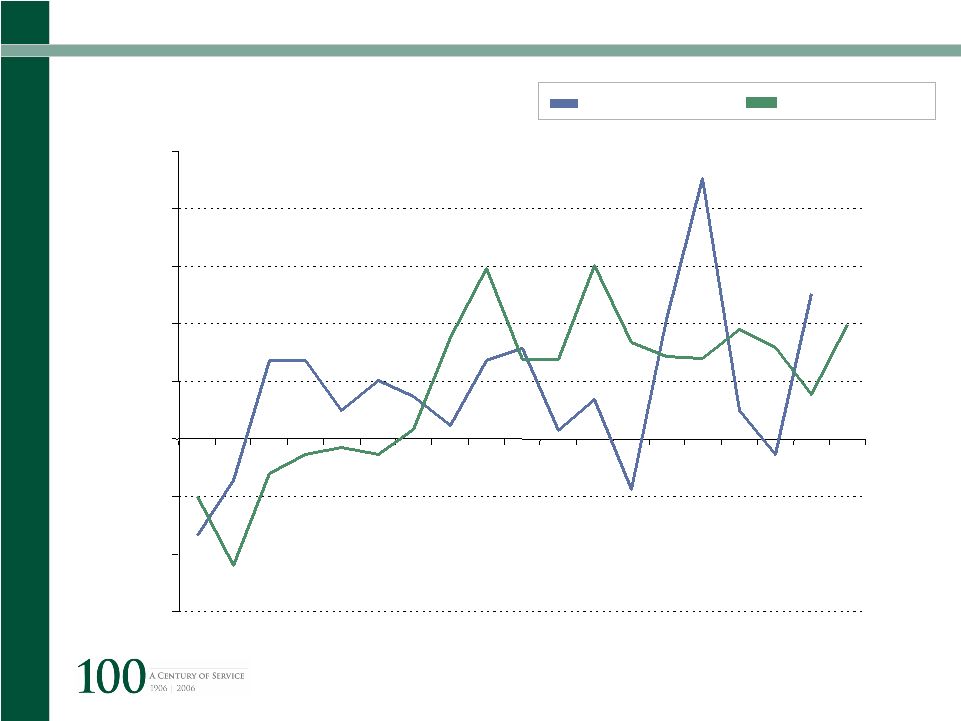
Richard Ellis | Page 9 Corporate Profits % Change Qtr. Over Qtr. Corporate Profits Fixed Investment Source: Bureau of Labor Statistics -15% -10% -5% 0% 5% 10% 15% 20% 25% Q3, 2001 Q3, 2002 Q3, 2003 Q3, 2004 Q3, 2005 |
 CB
Richard Ellis | Page 10 Wall Street Performance 2004 2005 YTD 2006 NASDAQ 9% 1% 2% S&P 500 11% 3% 3% Dow Jones 3% 1% 6% |
 CB
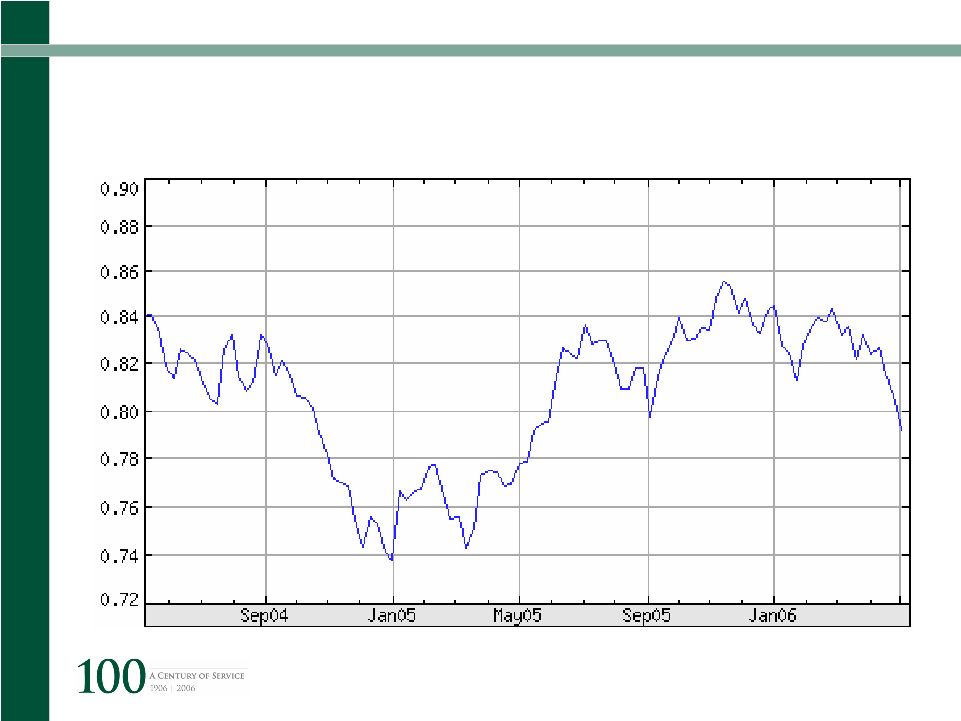
Richard Ellis | Page 11 U.S. Economy USD is Again Weakening Versus EURO Euros to 1 USD Source: US Treasury |
 CB
Richard Ellis | Page 12 Imports / Exports 13.0% 12.1% 1Q 2006 12.1% 5.1% 4Q 2005 2.4% 2.5% 3Q 2005 Imports Exports Source: Bureau of Labor Statistics |
 CB
Richard Ellis | Page 13 4.2% 3.3% 2004 -2.5% 4.3% 1Q ’06 5.4% Producer Price Index 3.4% Consumer Price Index 2005 Economic Performance Source: Federal Reserve Bank Gold at $680 per ounce! |
 CB
Richard Ellis | Page 14 National Economy Has Momentum … But how long will it continue |
 CB
Richard Ellis | Page 15 How Long Will It Last … HIGHER INTEREST |
 CB
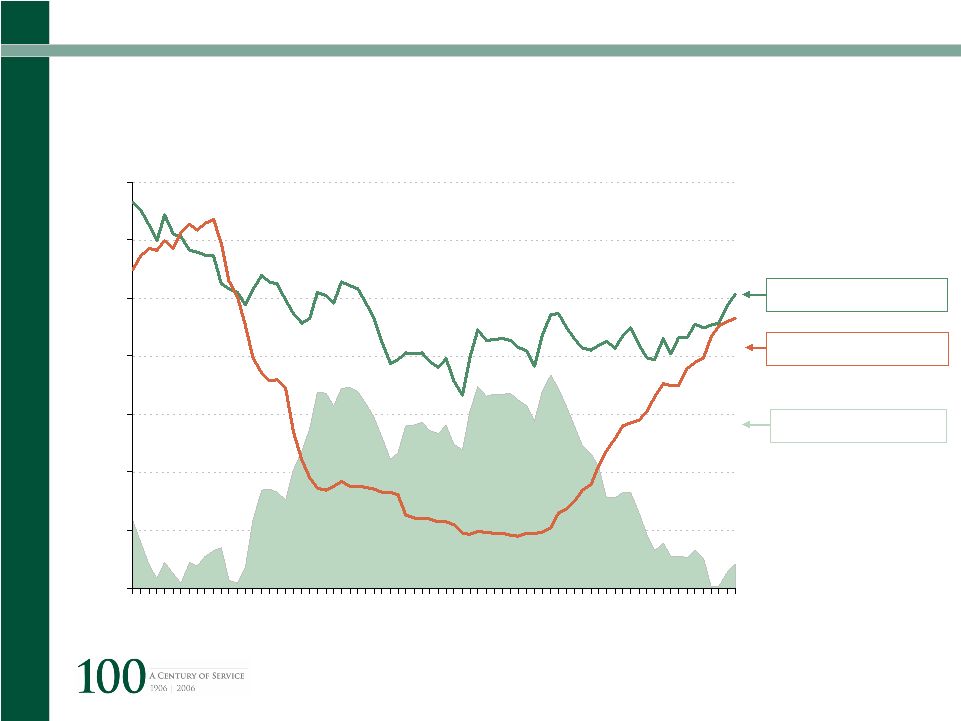
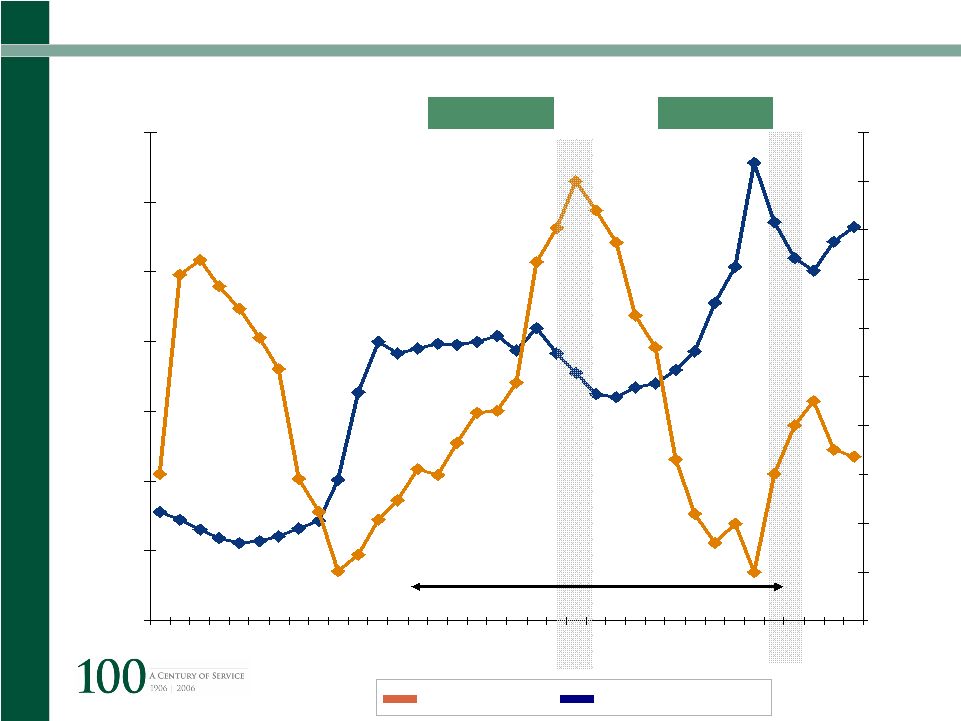
Richard Ellis | Page 16 Interest Rates 0% 1% 2% 3% 4% 5% 6% 7% 2000 2001 2002 2003 2004 2005 2006 10-Year and 3-Month Constant Maturity Rates 10-Year Treasury 3-Month Treasury Variance Source: US Treasury |
 CB
Richard Ellis | Page 17 How Long Will It Last … HOUSING HAS PEAKED |
 CB
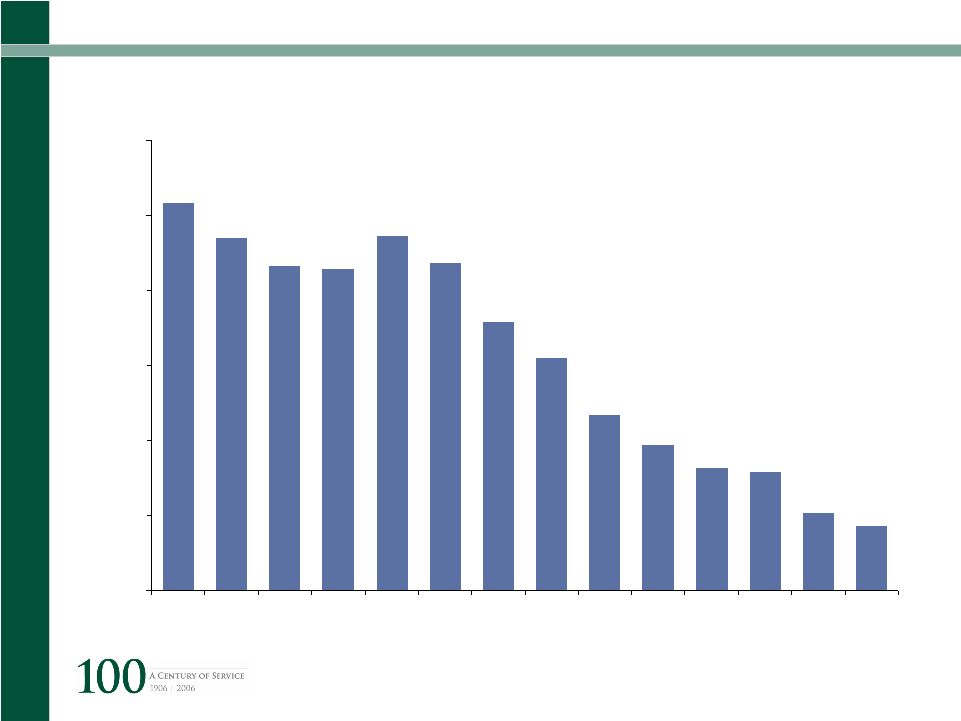
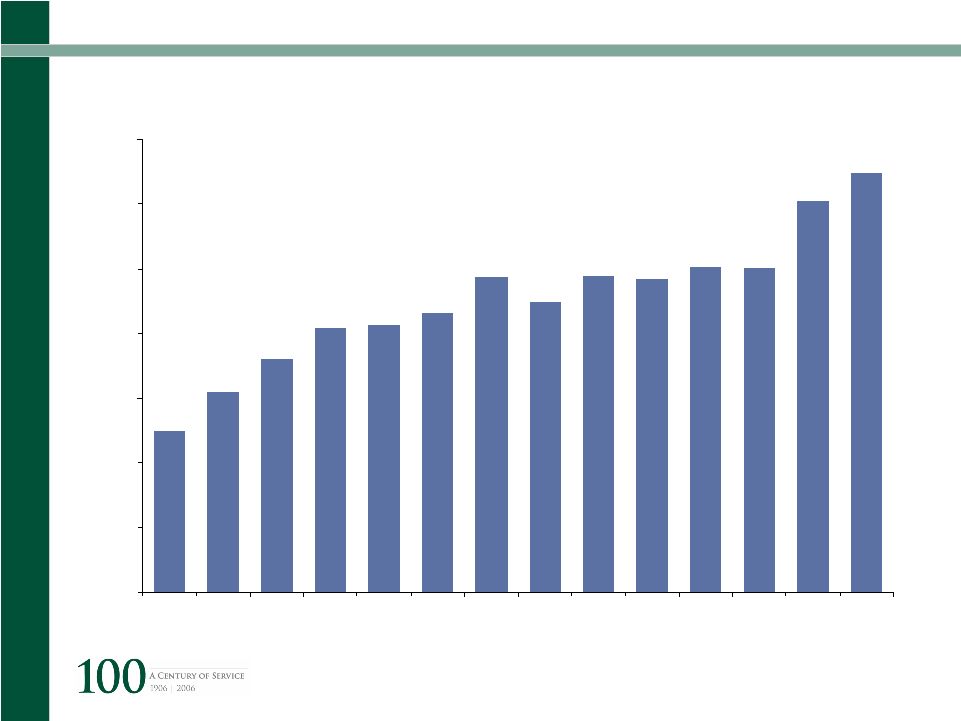
Richard Ellis | Page 18 Toward A Buyer’s Market 2 3 4 5 6 7 Average 6.9 months on the market 2 3 4 5 6 7 Average 5.5 months on the market CONDOS AND CO-OPS NEW SINGLE-FAMILY HOMES ’03 ’04 ’05 ‘06 ’03 ’04 ’05 ‘06 Source: New York Times |
 CB
Richard Ellis | Page 19 How Long Will It Last … OIL PRICES |
 CB
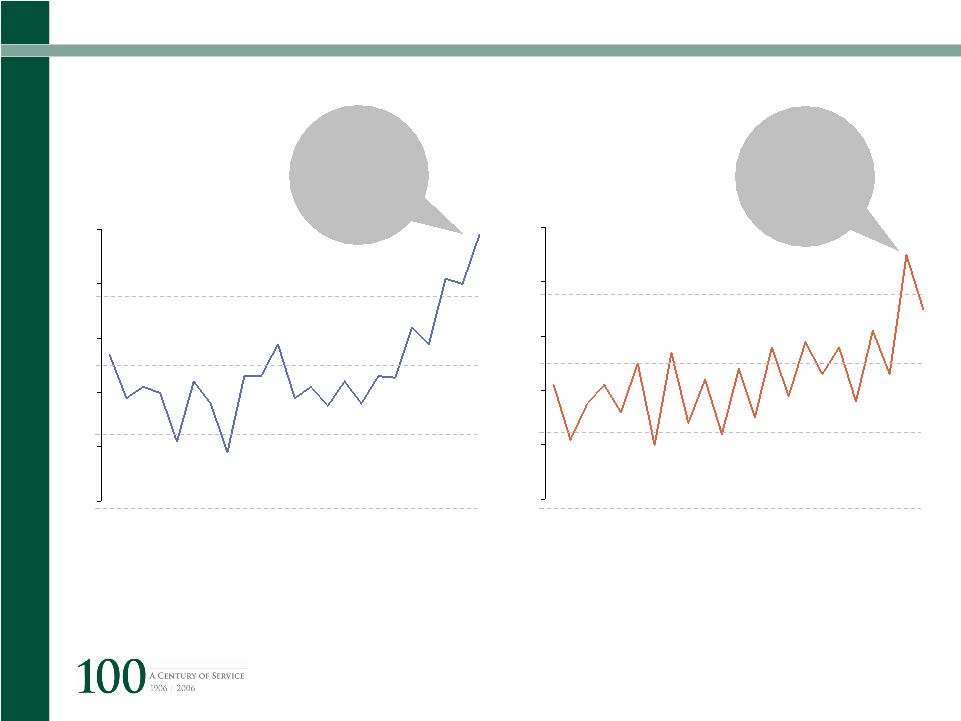
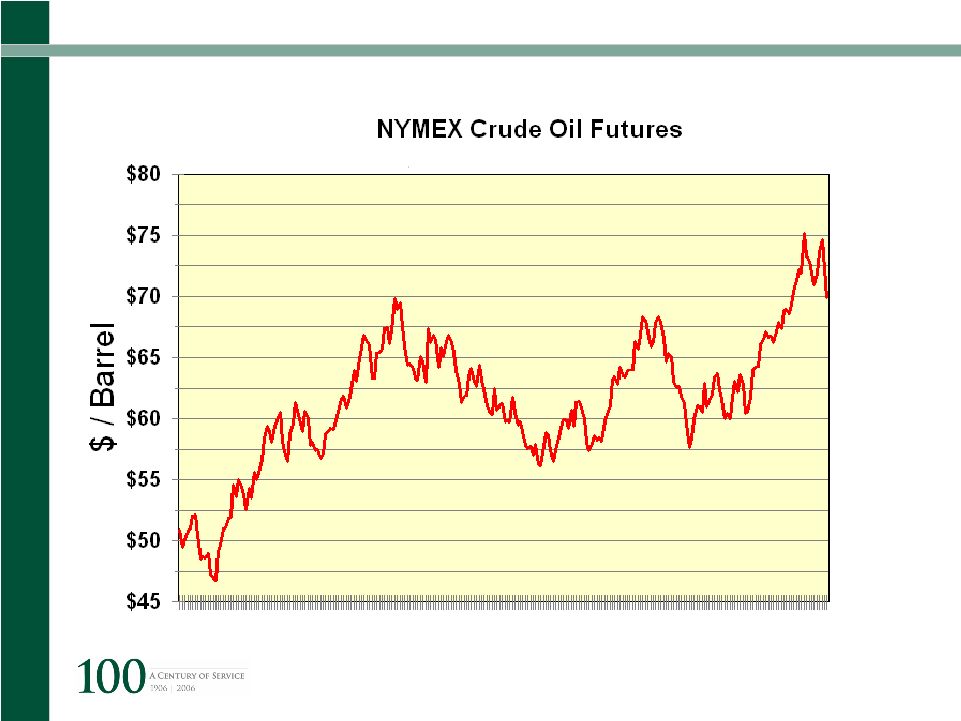
Richard Ellis | Page 20 U.S. Economy Increasing Oil Prices May-05 Sept-05 Jan-06 May-06 Source: WTRG Economics |
 CB
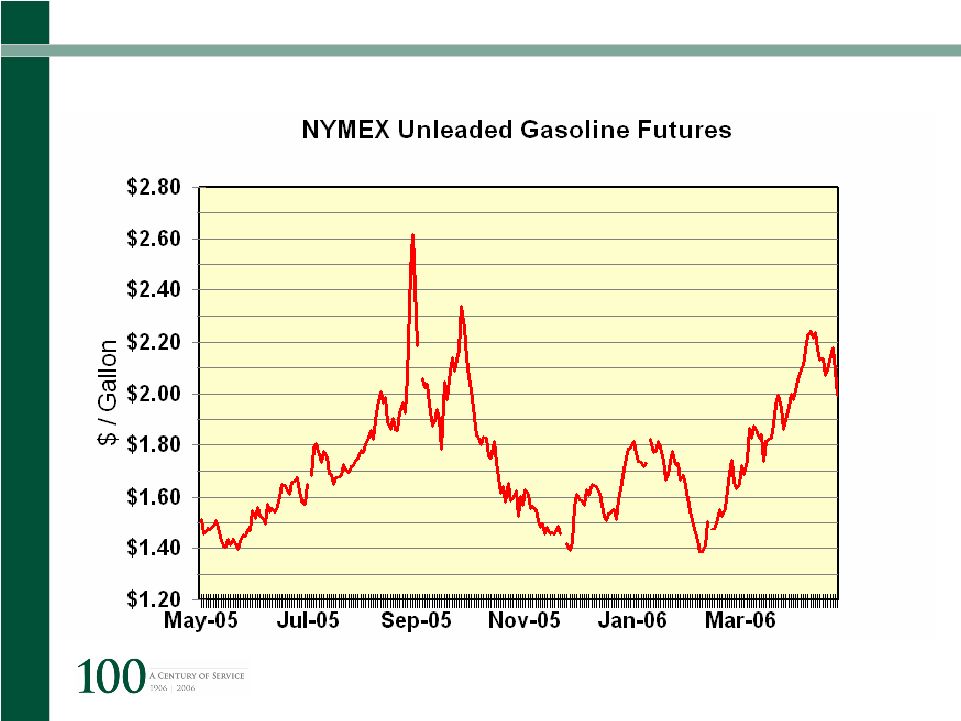
Richard Ellis | Page 21 U.S. Economy Increasing Gasoline Prices Source: WTRG Economics |
 CB
Richard Ellis | Page 22 U.S. Economy Average Daily Oil Imports (Millions of Barrels) 0.0 2.0 4.0 6.0 8.0 10.0 12.0 14.0 1995 2005 United States China India Source: US Energy Information Administration |
 CB
Richard Ellis | Page 23 How Long Will It Last … GROWING DEFICIT$ |
 CB
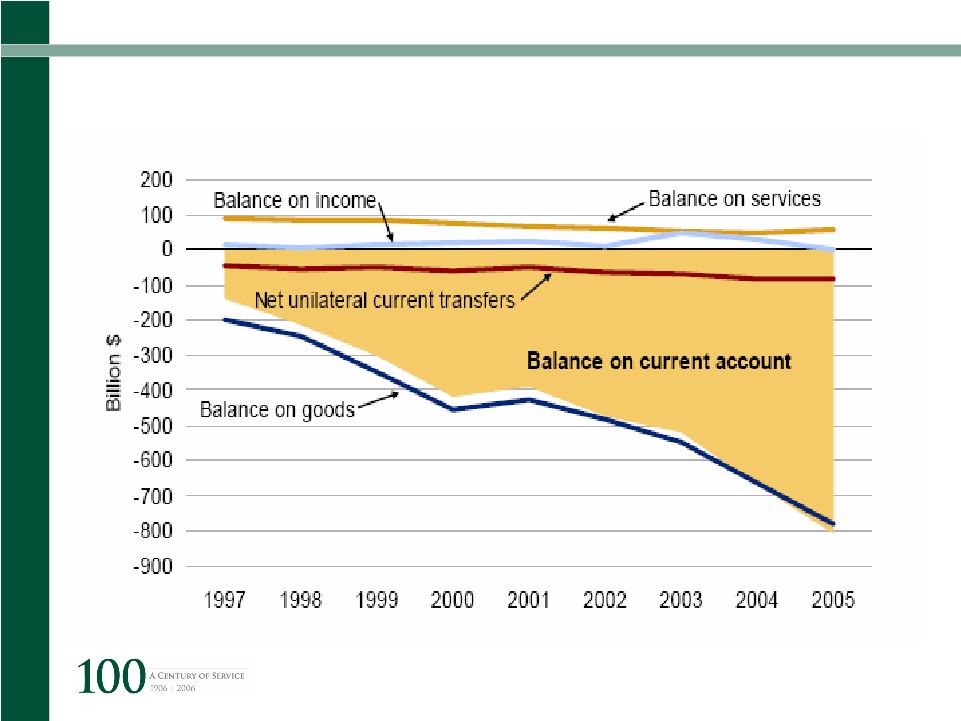
Richard Ellis | Page 24 Growing Current Account Deficit Income and Services Little Offset Source: US Treasury |
 CB
Richard Ellis | Page 25 Largest Foreign Holders of US Debt $485 Billion China $283 Billion UK $2,536 Billion $814 Billion Amount By Country Others Japan Total Held Over $4.1 Trillion – 48% Source: US Treasury Dept. 6/2005 32% |
 CB
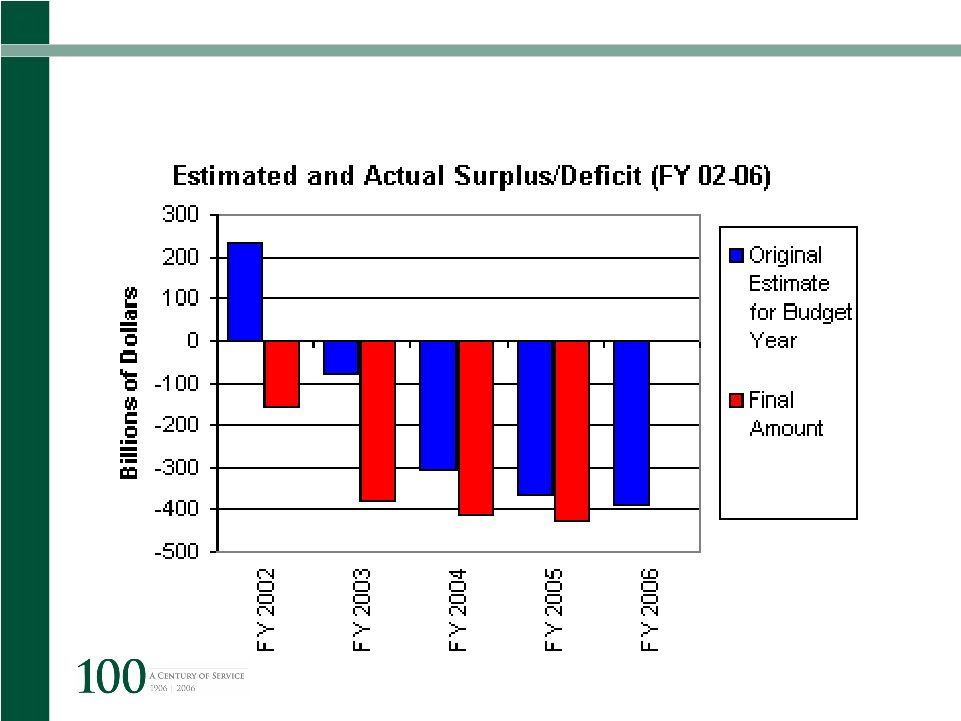
Richard Ellis | Page 26 Growing Federal Deficit Federal Deficit at $8.4 Trillion and Growing |
 CB
Richard Ellis | Page 27 How Long Will It Last … ONGOING TOLL |
 CB
Richard Ellis | Page 28 Economic Forecast 2007 2006 2005 2.3 4.7 4.8 1Q 3.4 5.1 3.2 FY 2.4 2.4 Inflation (CPI) 4.8 2.3 3.0 FY 4.8 2.9 3.5 FY Unemployment Bottom 10% GDP / Consensus Source: Blue Chip Economic Indicators Actual / Consensus |
 CB
Richard Ellis | Page 29 New York City Economy On a Roll |
 CB
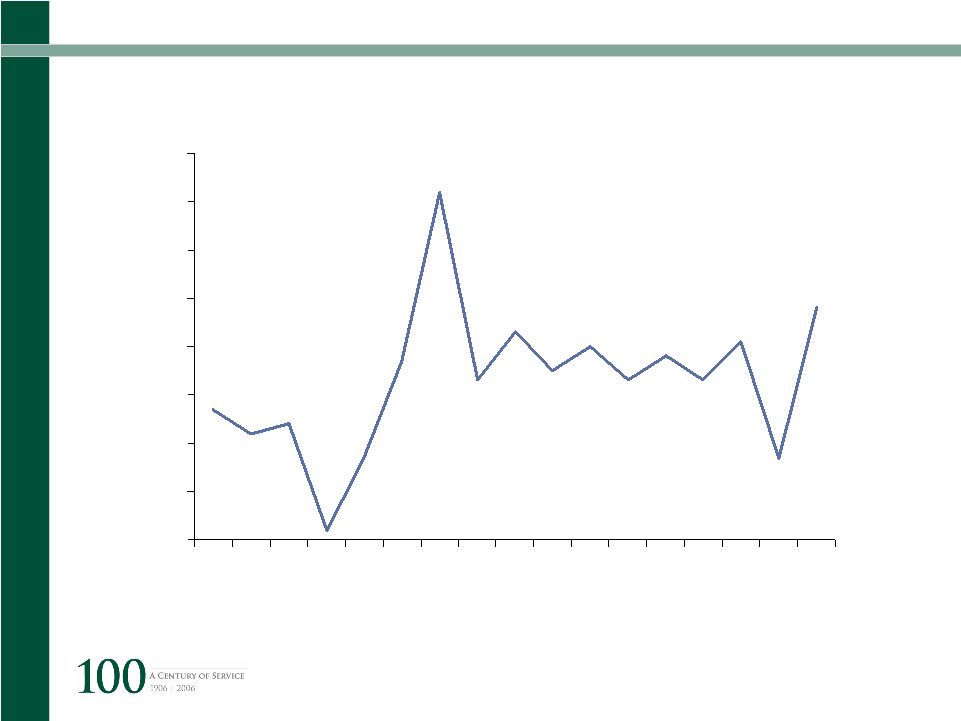
Richard Ellis | Page 30 GCP -8% -6% -4% -2% 0% 2% 4% 6% 8% 10% 2000 2001 2002 2003 2004 2005 |
 CB
Richard Ellis | Page 31 Economic Indicators – New York City 5.8% Unemployment 3.9% Inflation 1.4% Job Growth 3.4% GCP Growth 2005 vs. 2004 * NYC ranked 9 th in terms of job growth when compared to the 19 largest metropolitan areas. Source: New York City Comptroller |
 CB
Richard Ellis | Page 32 New York City Economy Metropolitan NY Residential Sales Transaction Volume (000s) Single Family Home Price Index (YR 2000 =100) Source: New York City Dept. of Finance 0 5 10 15 20 25 30 35 40 45 50 1990 1992 1994 1996 1998 2000 2002 2004 0% 50% 100% 150% 200% |
 CB
Richard Ellis | Page 33 New York City Economy Manhattan Residential Condo Market (Avg. Sale Prices) Source: New York City Dept. of Finance $0 $150 $300 $450 $600 $750 $900 $1,050 $1,200 $1,350 $1,500 $1,650 2001 2002 2003 2004 2005 2 Bedroom 1 Bedroom Studio ($000’s) |
 CB
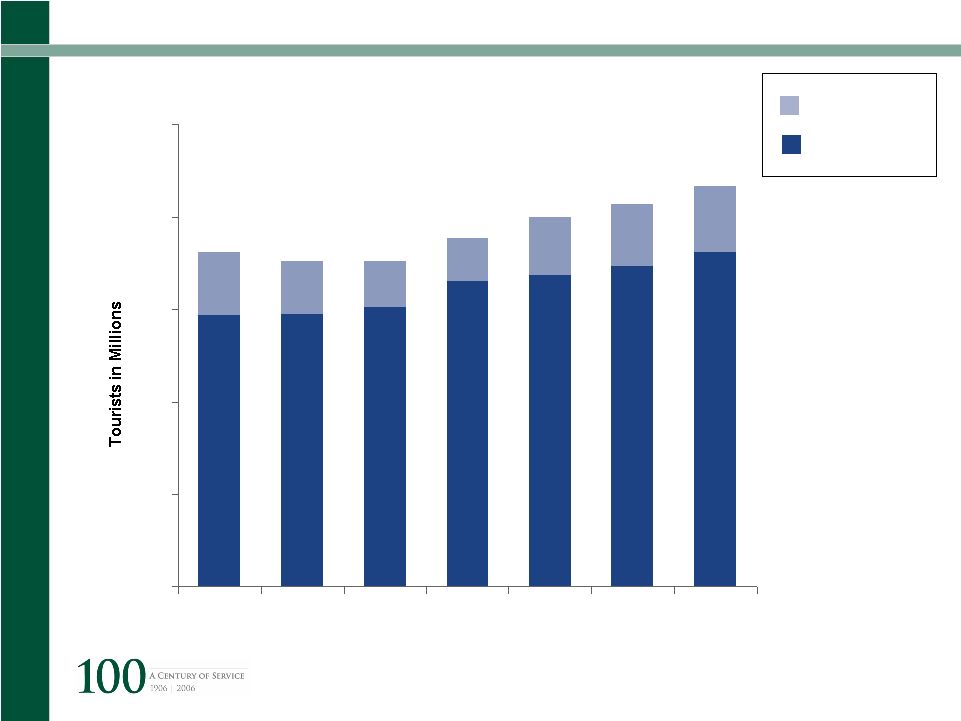
Richard Ellis | Page 34 0 10 20 30 40 50 2000 2001 2002 2003 2004 2005 2006 New York City Economy International Domestic 36.2 35.2 35.3 37.8 40.0 41.5 43.4 New York Visitors Source: NYC & Company |
 CB
Richard Ellis | Page 35 50% 60% 70% 80% 90% 100% 1999 2000 2001 2002 2003 2004 2005 $150 $180 $210 $240 $270 $300 New York City Economy Hotel Occupancy Room Rate Hotel Occupancy Rates Source: PKF Consulting |
 CB
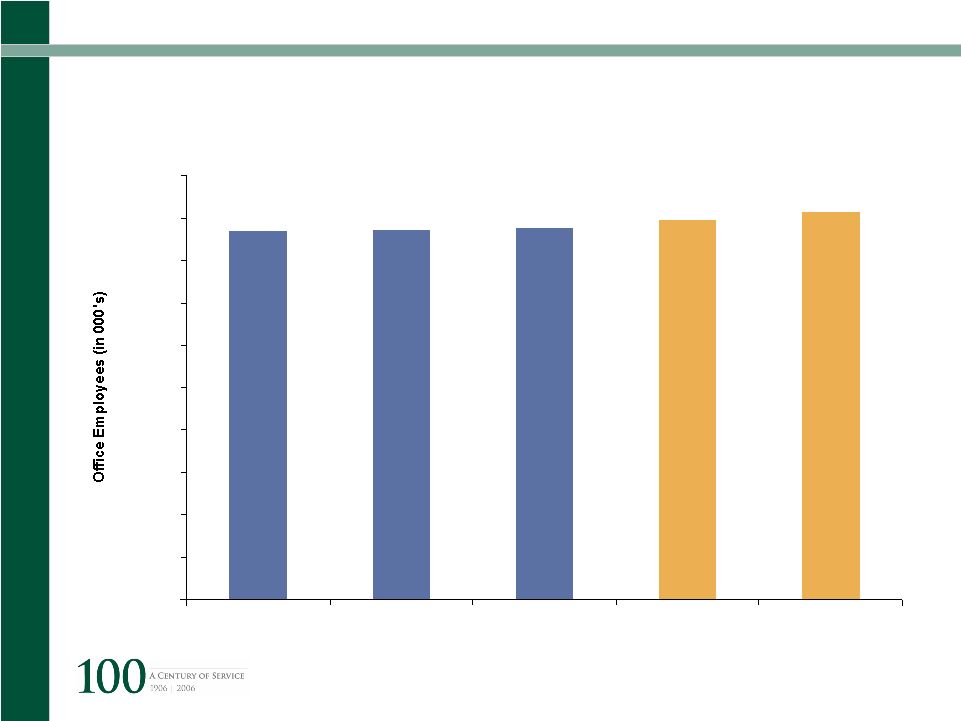
Richard Ellis | Page 36 New York City Economy 500 600 700 800 900 1,000 1,100 1,200 1,300 1,400 1,500 2003 2004 2005 2006 2007 Source: Torto Wheaton Research Office-Based Employees 1.5% 1.5% |
 CB
Richard Ellis | Page 37 INVESTMENT SALES Where is the top? |
 CB
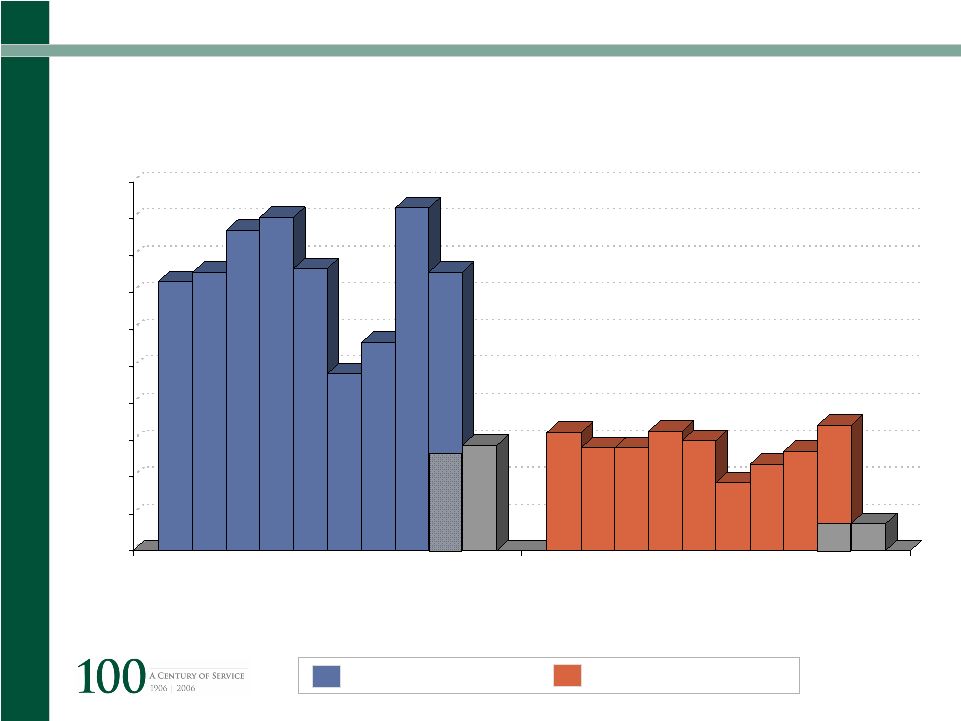
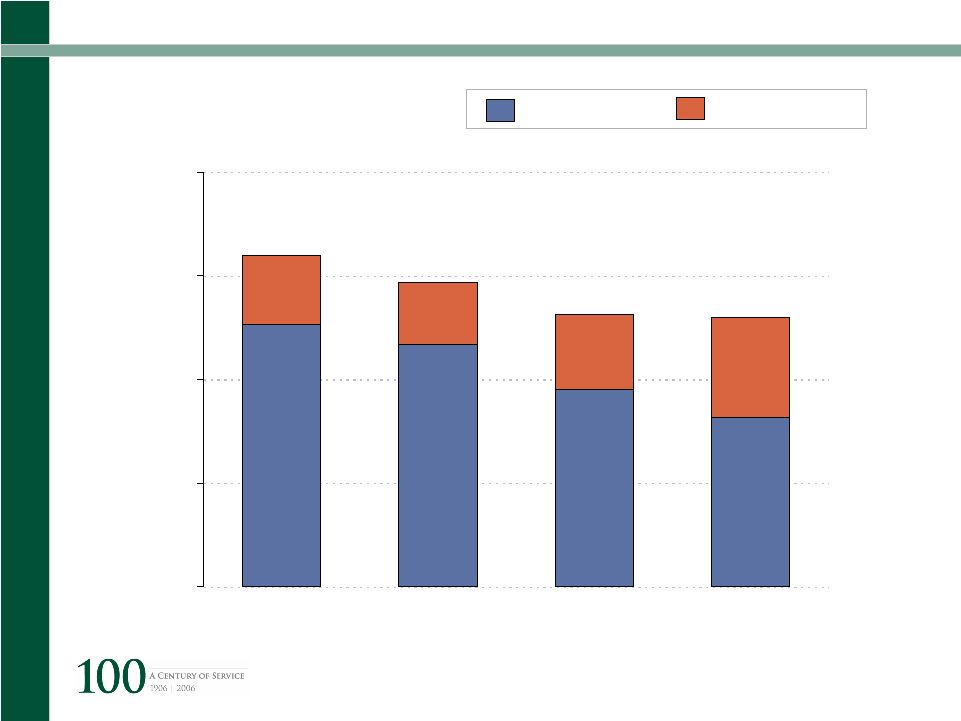
Richard Ellis | Page 38 Investment Sales Dollar Transaction Volume $1.0 $3.0 $5.0 $7.0 $9.0 $11.0 2001 2002 2003 2004 2005 $1.0 $3.0 $5.0 $7.0 $9.0 $11.0 2001 2002 2003 2004 2005 $ Billions $ Billions Class “A” Class “B” |
 CB
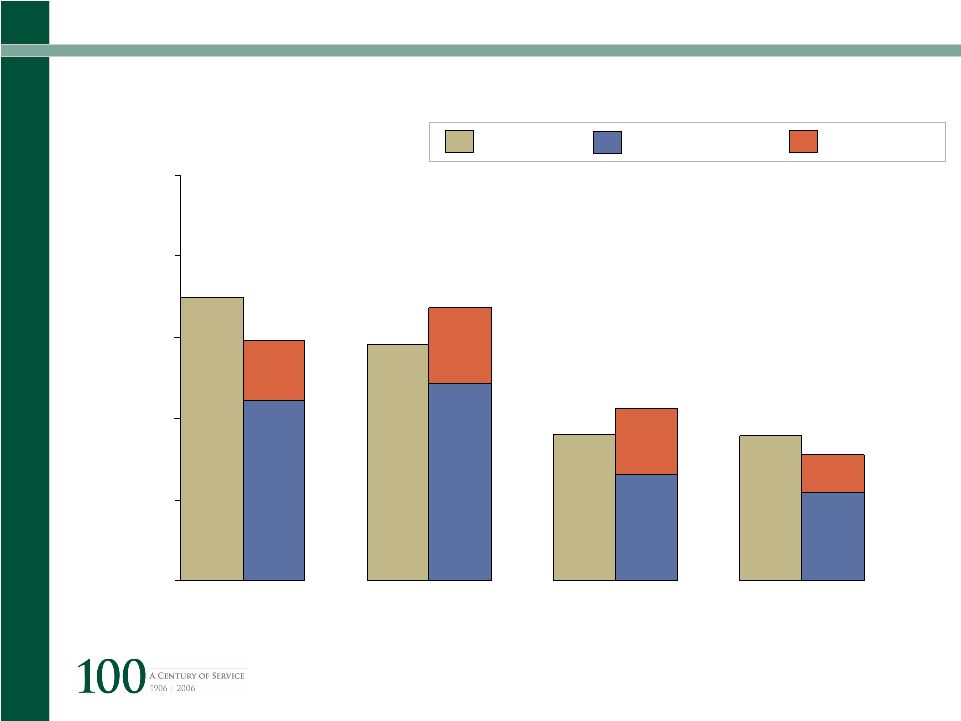
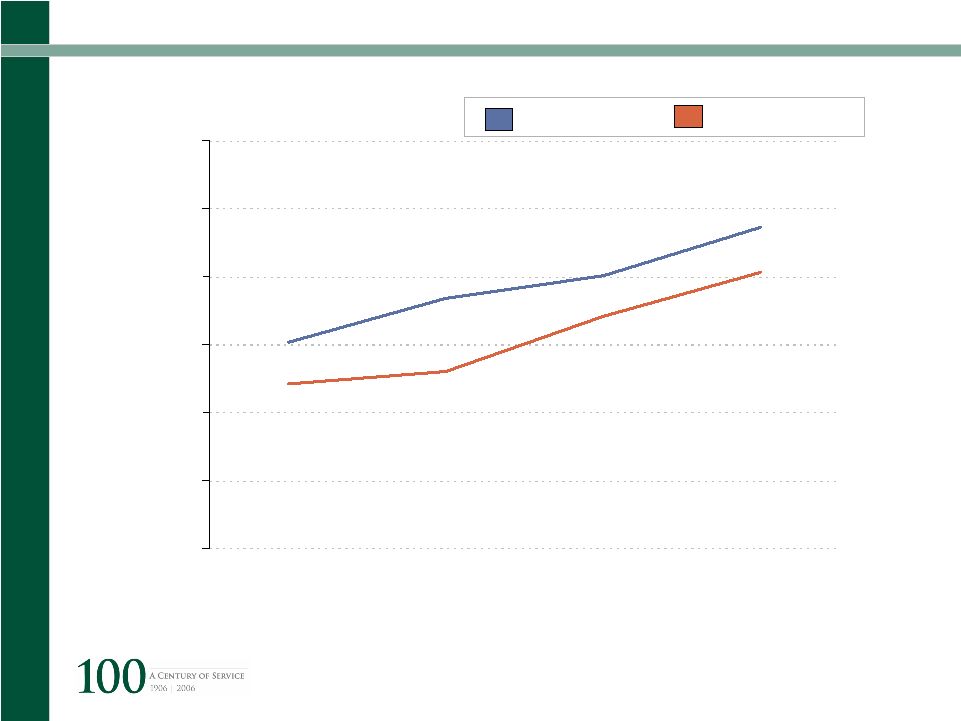
Richard Ellis | Page 39 Investment Sales Average Price Per Square Foot, Class A and B $0 $100 $200 $300 $400 $500 $600 2001 2002 2003 2004 2005 $0 $100 $200 $300 $400 $500 $600 2001 2002 2003 2004 2005 Class “A” Class “B” |
 CB
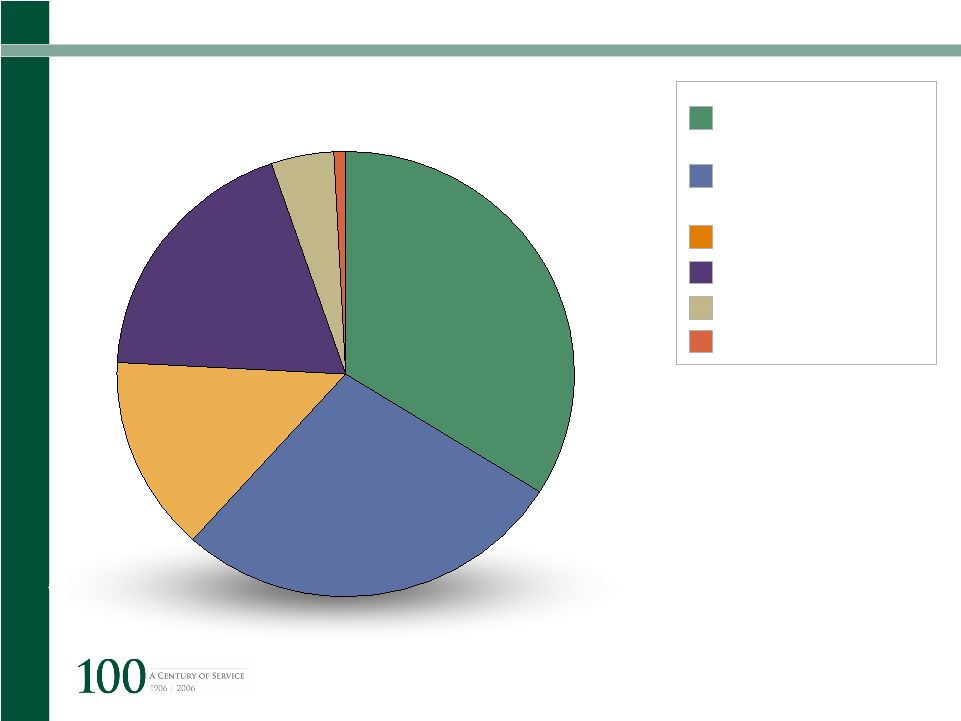
Richard Ellis | Page 40 Investment Sales 2005 Volume (Percentage by Buyer) * Local (individuals & companies) National (public/private companies) Foreign REIT Fund Non Profit 33% 15% 1% 4% 19% 28% * Includes sales $30 mm and greater |
 CB
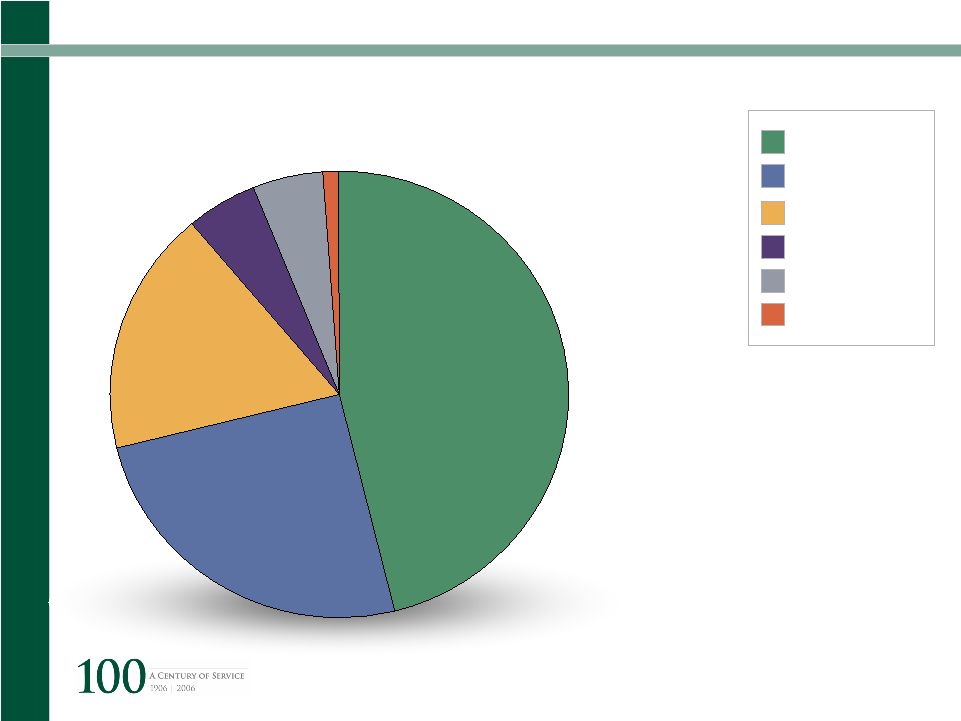
Richard Ellis | Page 41 Investment Sales 2005 Volume (Percentage by Property Type) Office Multi-Family Land Hotel Retail Other 46% 18% 1% 5% 5% 25% 25% Source: CoStar Realty Information, Inc. |
 CB
Richard Ellis | Page 42 OFFICE LEASING Measured Improvement |
 CB
Richard Ellis | Page 43 NYC Office Market Manhattan Vacancy Rates – Last 12 Months 6.0% 6.5% 7.0% 7.5% 8.0% 8.5% 9.0% Mar- 05 Apr-05 May- 05 Jun-05 Jul-05 Aug- 05 Sep- 05 Oct-05 Nov- 05 Dec- 05 Jan-06 Feb- 06 Mar- 06 Apr-06 |
 CB
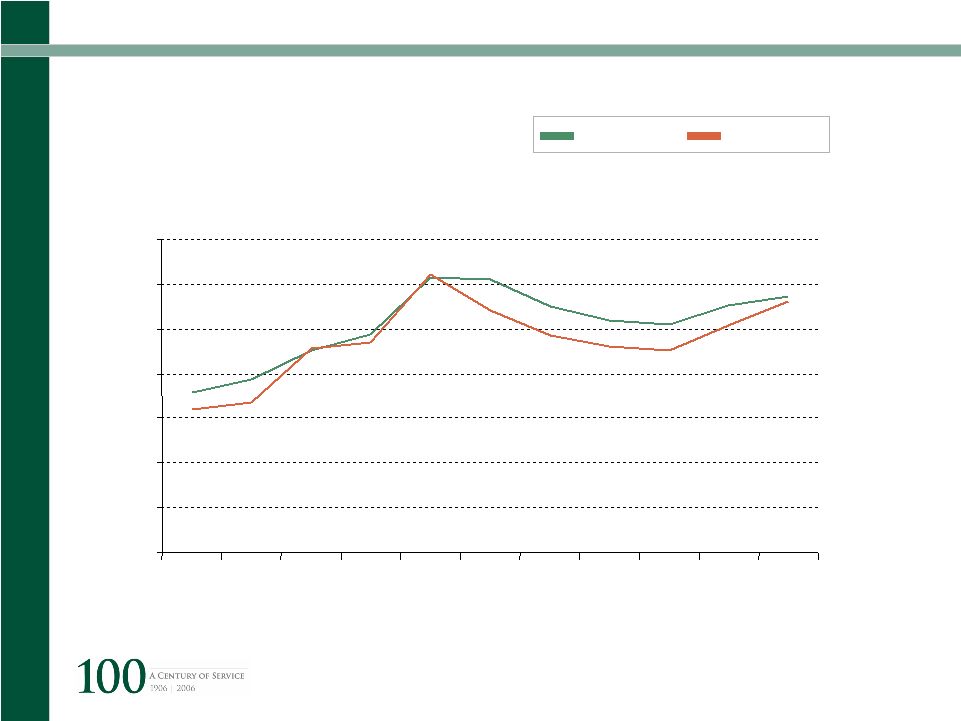
Richard Ellis | Page 44 NYC Office Market Manhattan Average Asking Rents – Last 12 Months $40.00 $41.00 $42.00 $43.00 $44.00 $45.00 $46.00 $47.00 Mar- 05 Apr-05 May- 05 Jun-05 Jul-05 Aug- 05 Sep- 05 Oct-05 Nov- 05 Dec- 05 Jan-06 Feb- 06 Mar- 06 Apr-06 |
 CB
Richard Ellis | Page 45 Annual Leasing Activity 0 2 4 6 8 10 12 14 16 18 20 RSF (mm) Midtown
Midtown South 1998 2000 2002 2004 YTD 1998 2000 2002 2004 YTD |
 CB
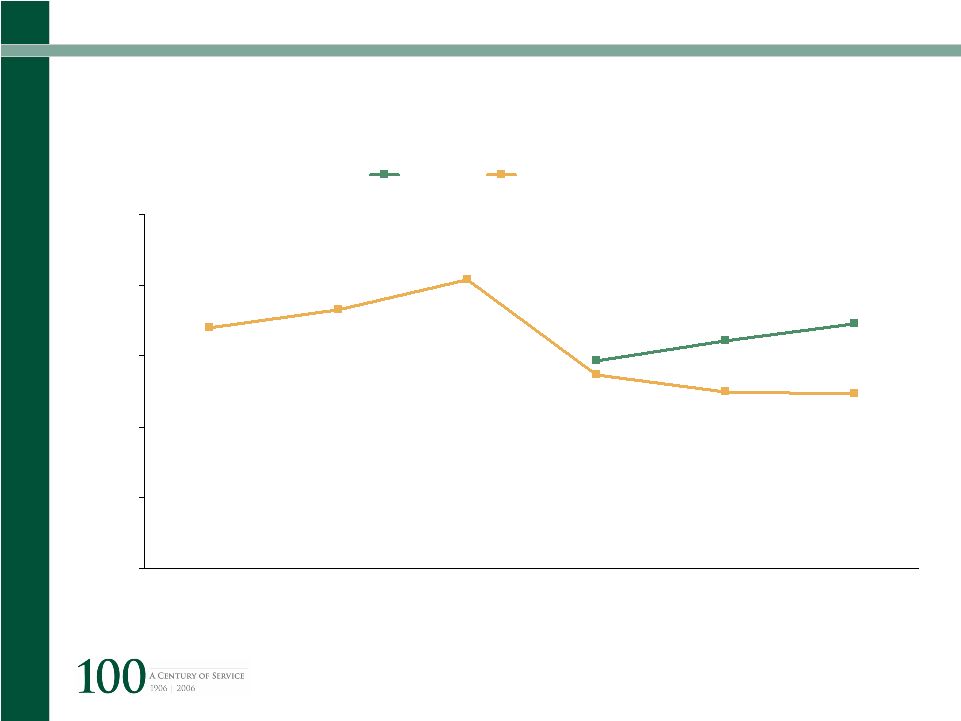
Richard Ellis | Page 46 Office Market 8 Years 3 Years Availability Rates – Market Inflection Points 3+ ? Midtown Midtown South 0% 5% 10% 15% 20% 1990 2000 2006 YTD |
 CB
Richard Ellis | Page 47 Office Market Midtown Asking Rents Direct Sublet $0 $10 $20 $30 $40 $50 $60 $70 1996 1997 1998 1999 2000 2001 2002 2003 2004 2005 YTD |
 CB
Richard Ellis | Page 48 New York City How will the office market react ? |
  CB
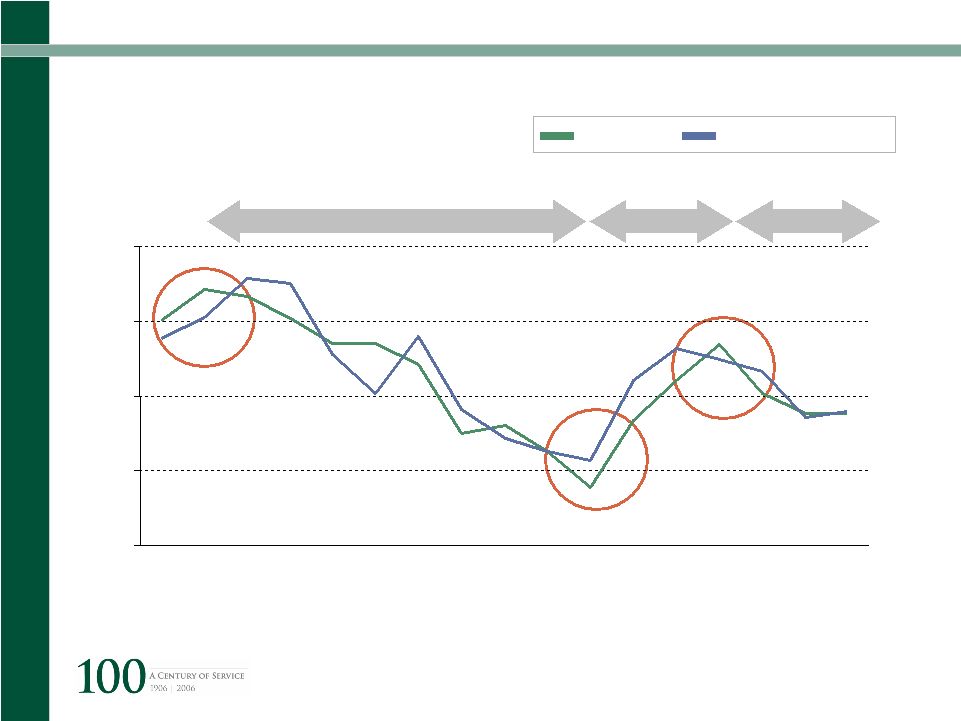
Richard Ellis | Page 49 Still Believe “Build it and They Will Come” $0 $10 $20 $30 $40 $50 $60 $70 1970 1975 1980 1985 1990 1995 2000 2005 0% 2% 4% 6% 8% 10% 12% 14% 16% 18% 20% Historical Asking Rents and Vacancy Rates Overbuilding Overbuying Vacancy Rate Asking Rents Recession |
 CB
Richard Ellis | Page 50 Financial Services RECORD PROFITS |
 Financial Services
|
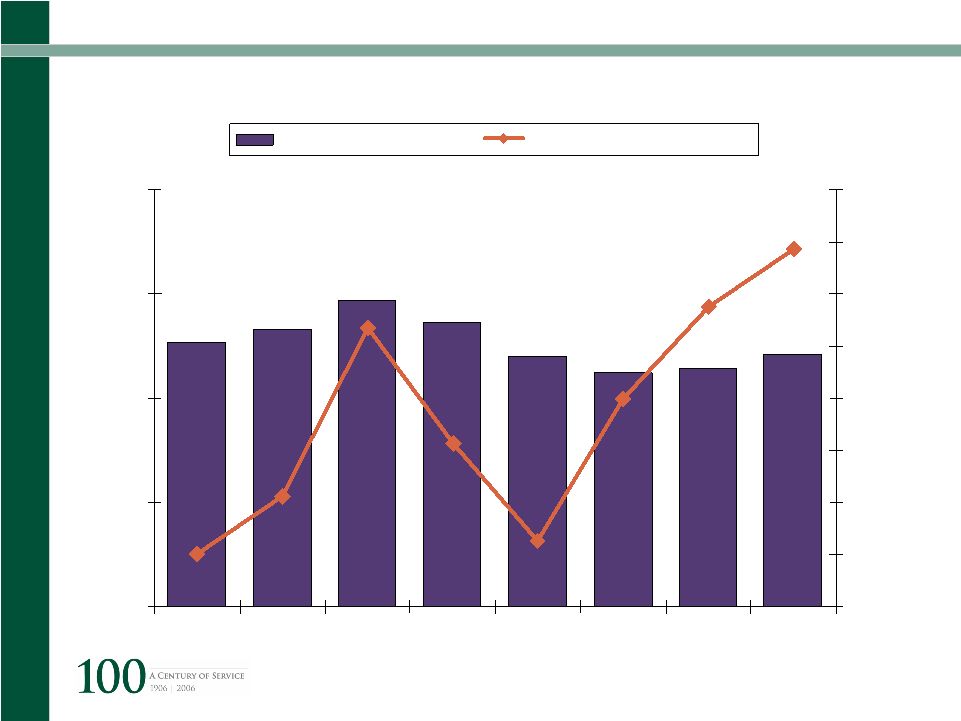 CB
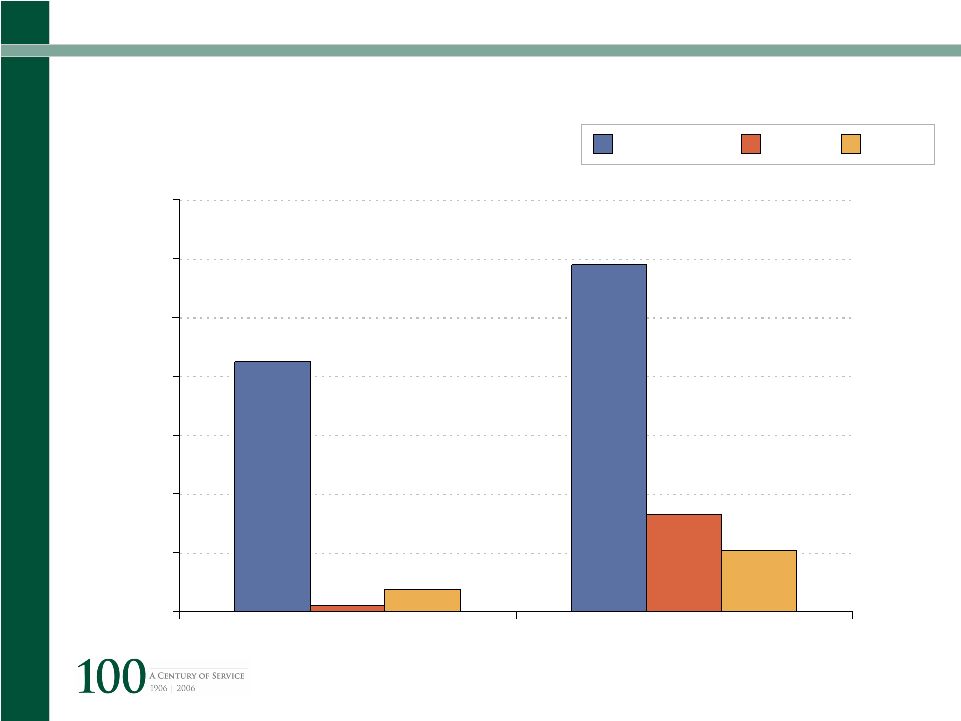
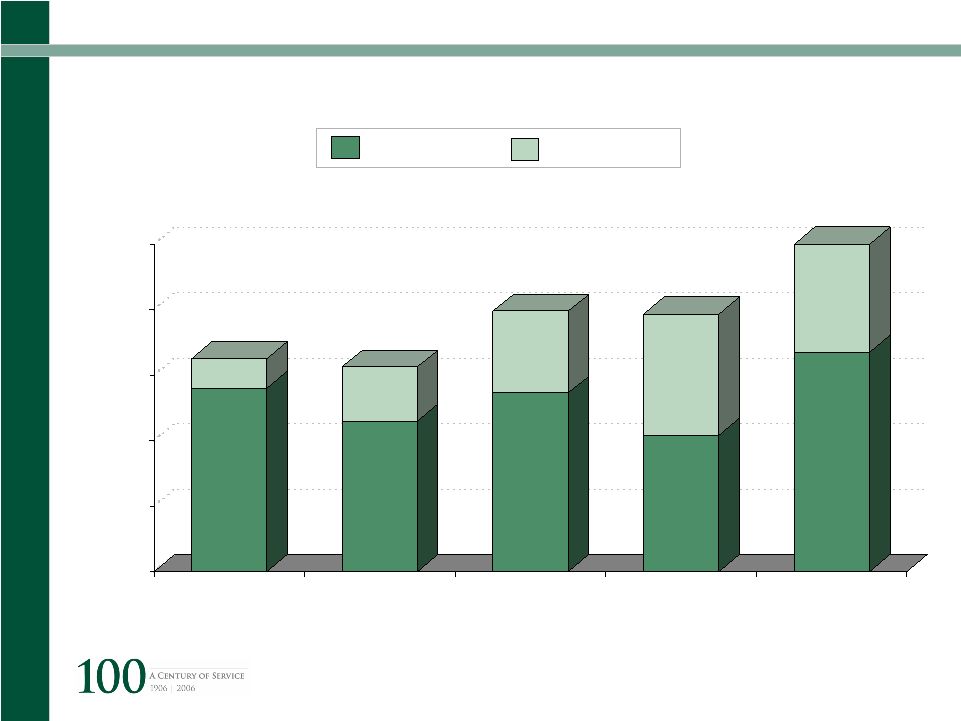
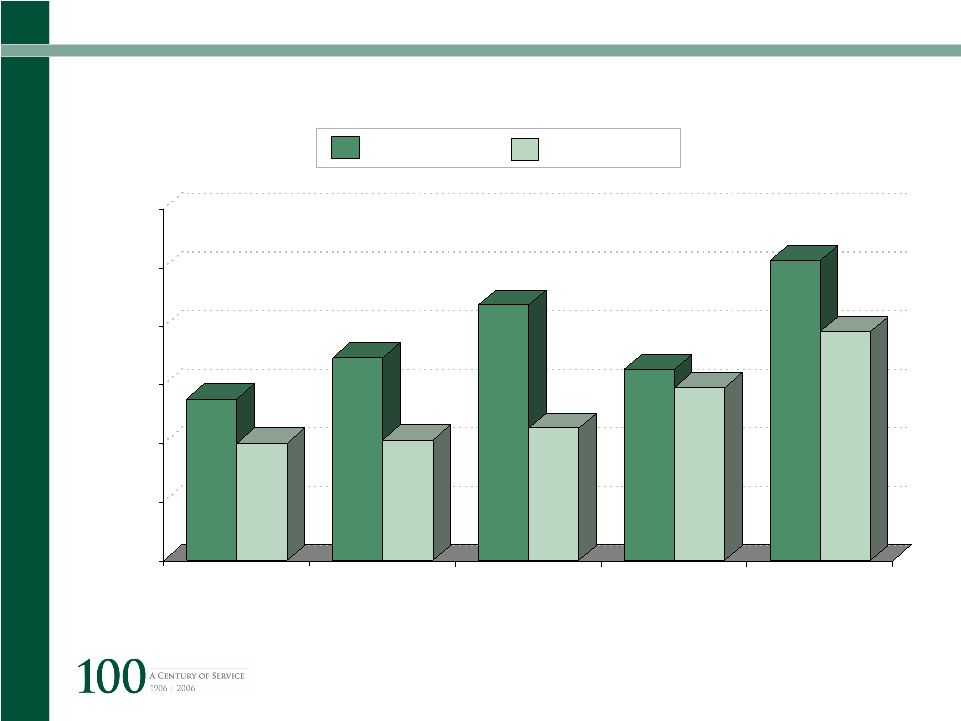
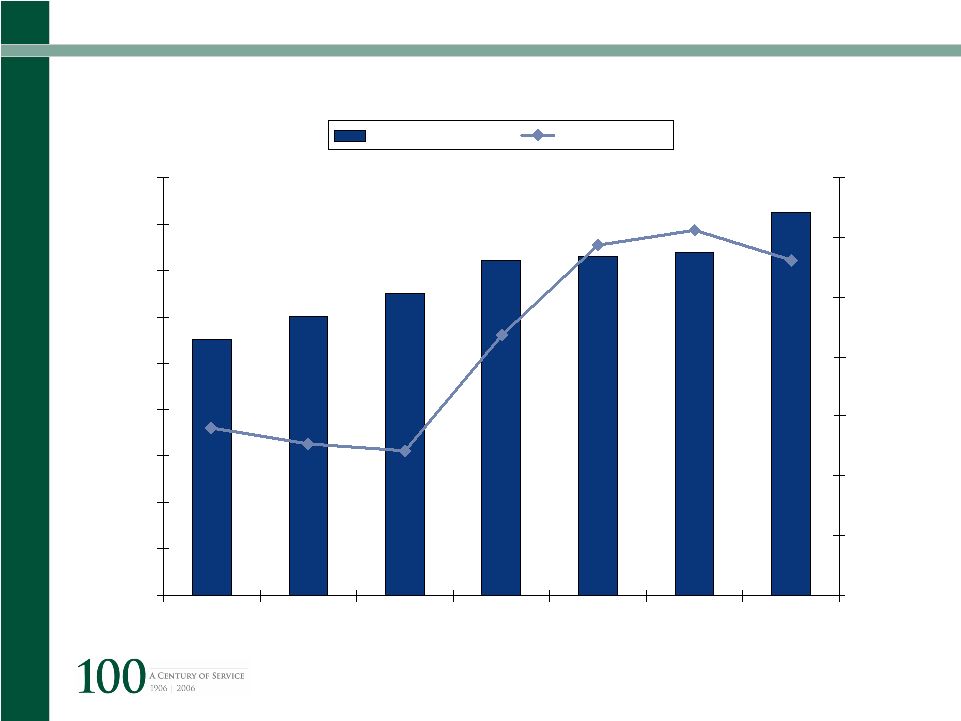
Richard Ellis | Page 52 Financial Services Increasing Wall Street Profits to Increase Hiring 50 100 150 200 250 1998 1999 2000 2001 2002 2003 2004 2005 $8 $10 $12 $14 $16 $18 $20 $22 $24 Employment (000's) Bonus Pool ($ Billions) Source: NY Department of Finance |
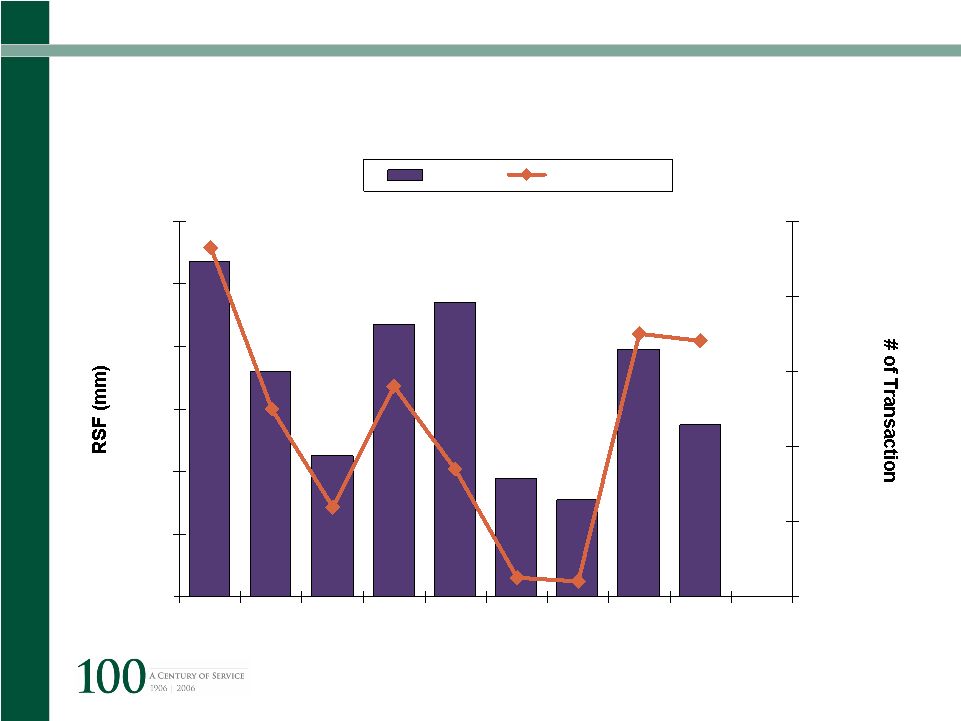 CB
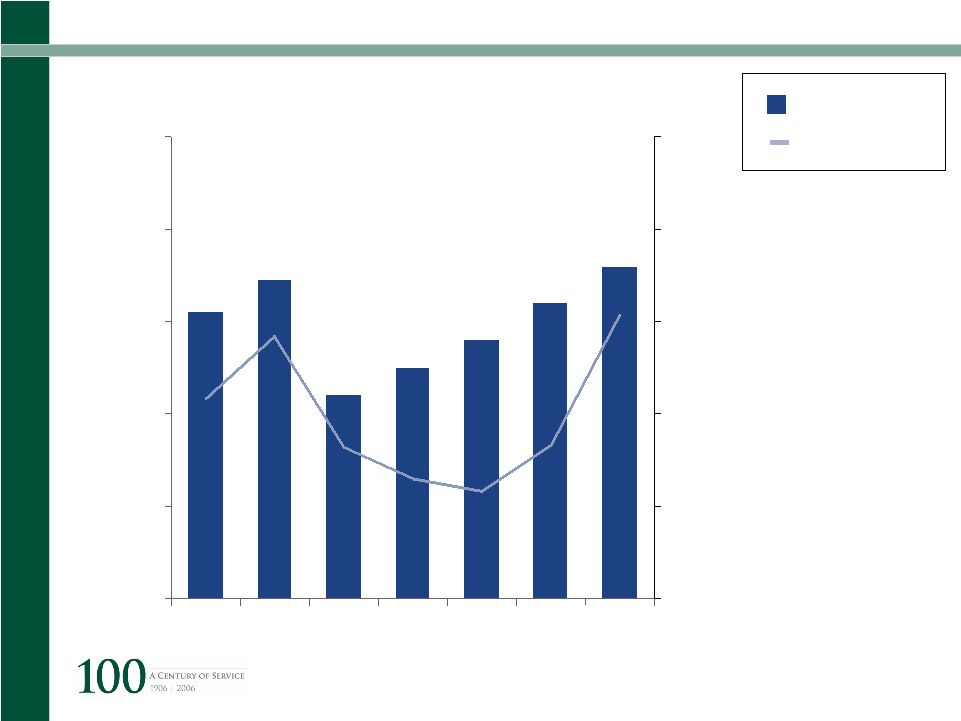
Richard Ellis | Page 53 Financial Services Office Leasing Transactions All Manhattan 0.0 2.0 4.0 6.0 8.0 10.0 12.0 1997 1998 1999 2000 2001 2002 2003 2004 2005 2006 100 120 140 160 180 200 RSF # of Deals ? |
 CB
Richard Ellis | Page 54 Manhattan Office Market – Annual Snapshot Sublet Blocks Direct Blocks Total RSF 15 4 (5) 16 4.7 million 1.2 million (3.0 million) 6.5 million 4 3 (11) 12 April 2006 Blocks + New Blocks - Absorption April 2005 Blocks Largest Midtown Blocks Available (>100,00 RSF) April 2005 vs. April 2006 30% Fewer Blocks in 1 Year |
 CB
Richard Ellis | Page 55 Manhattan Office Market – Annual Snapshot New Space Coming on to Market 350,000 RSF Added Per Quarter through 1st Quarter 2008 350,000 sf 707,540 sf 100,000,000 sf 680,000 sf Bank of America New York Times Verizon Old New York Times 1Q 2008 1Q 2007 4Q 2006 3Q 2007 One Bryant Park 620 Eighth Avenue 1095 Ave/Americas 229 West 43 rd St. |
 CB
Richard Ellis | Page 56 Office Market - Floor Height 0% 10% 20% 30% 40% 50% Floors 1-9 Floors
10-19 Floors 20-29 Floors 30+ Inventory, Direct vs. Sublet Space Leased Inventory Leased Direct Subleased |
 CB
Richard Ellis | Page 57 Office Market – Floor Height 0% 3% 6% 9% 12% 1-9 10-19
20-29 30+ Availability Rates Direct Space Sublet Space |
 CB
Richard Ellis | Page 58 Office Market – Floor Height $20 $30 $40 $50 $60 $70 $80 1-9 10-19
20-29 30+ Average Asking Rents Direct Space Sublet Space |
 CB
Richard Ellis | Page 59 Office Market 0% 5% 10% 15% 20% 2001 2002 2003 2004 2005 YTD Availability Rates Top 40% Secondary Buildings 3.5% |
 CB
Richard Ellis | Page 60 New York City How will the office market react ? |
 CB
Richard Ellis | Page 61 New York City Corporate costs are going up |
 CB
Richard Ellis | Page 62 Manhattan Office Market – Annual Snapshot $0 $200 $400 $600 $800 $1,000 $1,200 $1,400 $1,600 $1,800 2000 2001 2002 2003 2004 2005 2005 8.5% 9.0% 9.5% 10.0% 10.5% 11.0% 11.5% 12.0% Assessed Value RE Tax Rate 25 Midtown Buildings (in $000’s) ($000’s) |
 CB
Richard Ellis | Page 63 Manhattan Office Market – Annual Snapshot $0 $2 $4 $6 $8 $10 $12 $14 99/00 00/01 01/02 02/03 03/04 04/05 05/06 Compounded Annual Growth Rate of 7.8% Midtown Sample Tax Bill – Average Real Estate Tax per RSF |
 CB
Richard Ellis | Page 64 New York City Living costs are going up |
 CB
Richard Ellis | Page 65 Manhattan Office Market – Annual Snapshot $1,500 $1,700 $1,900 $2,100 $2,300 $2,500 $2,700 $2,900 $3,100 2001 2002 2003 2004 2005 Studio 1 Bedroom Average Rental Rates Source: Corcoran |
 CB
Richard Ellis | Page 66 HOW HIGH CAN IT GO? |
 CB
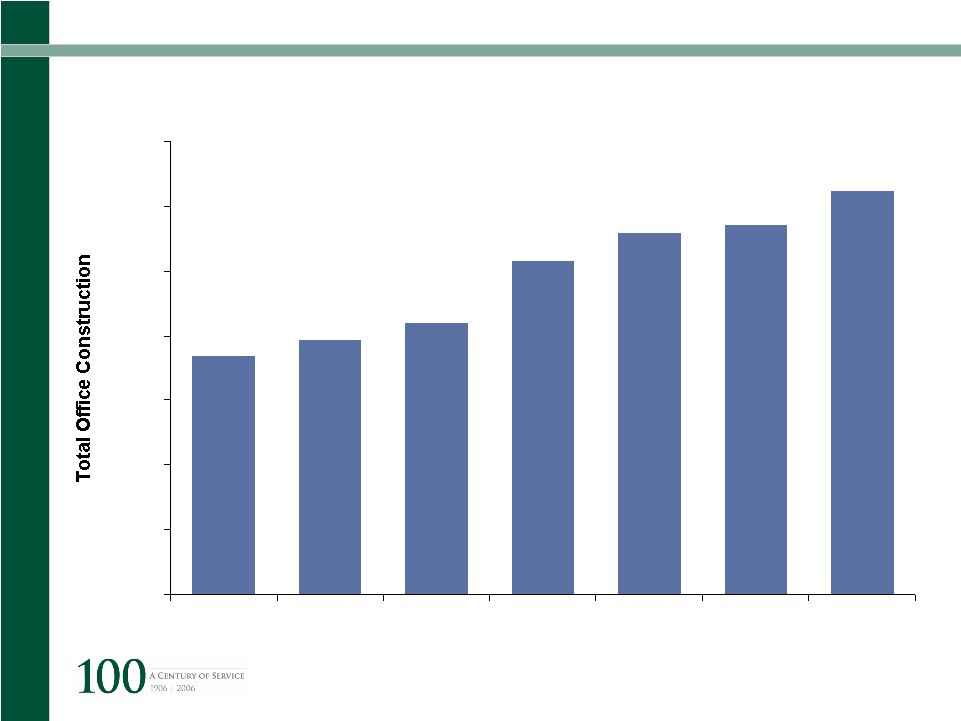
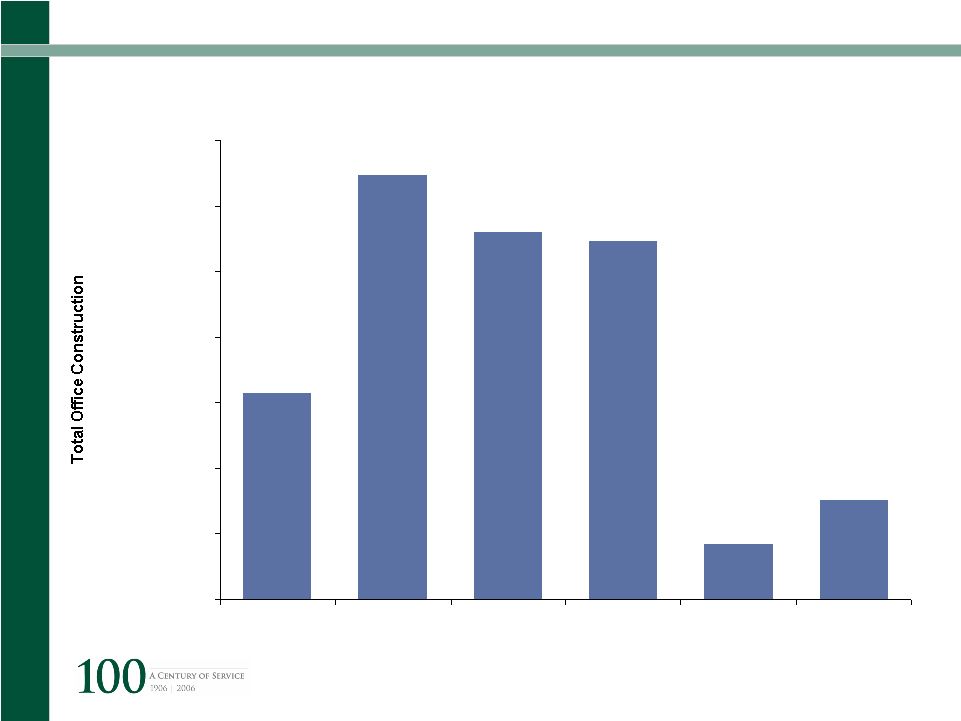
Richard Ellis | Page 67 Still Believe “Build It and They Will Come” 0 10,000,000 20,000,000 30,000,000 40,000,000 50,000,000 60,000,000 70,000,000 1950's 1960's 1970's 1980's 1990's 2000's * Assumes complete office development of the World Trade Center and Hudson Yards sites. Hudson Yards is assumed to deliver 2 million sq. ft. per year beginning Manhattan Office Construction |
 CB
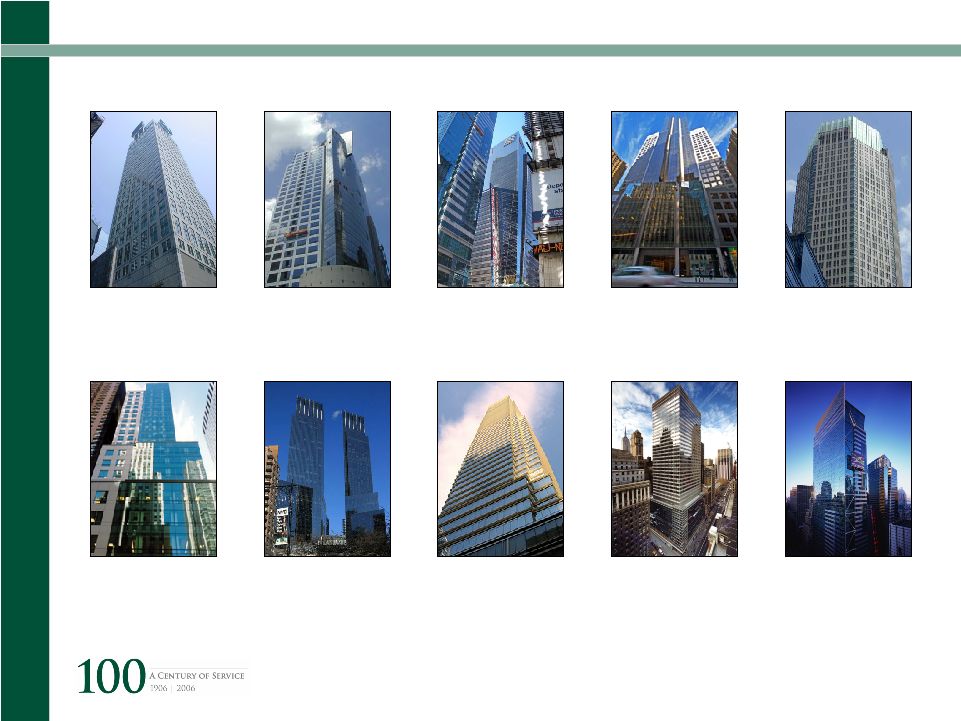
Richard Ellis | Page 68 New Construction 4 Times Square 3 Times Square 5 Times Square 1745 Broadway 383 Madison Ave. 1999 2001 2002 2002 2002 Conde Nast Reuters Ernst & Young Random House Bear Stearns 222 East 41st St. 60 Columbus Circle 731 Lexington Ave. 300 Madison Ave. 7 Times Square 2002 2003 2004 2004 2004 Jones, Day, Time Warner Bloomberg CIBC Ann Taylor Reavis & Pogue 1999 - 2005 |
 CB
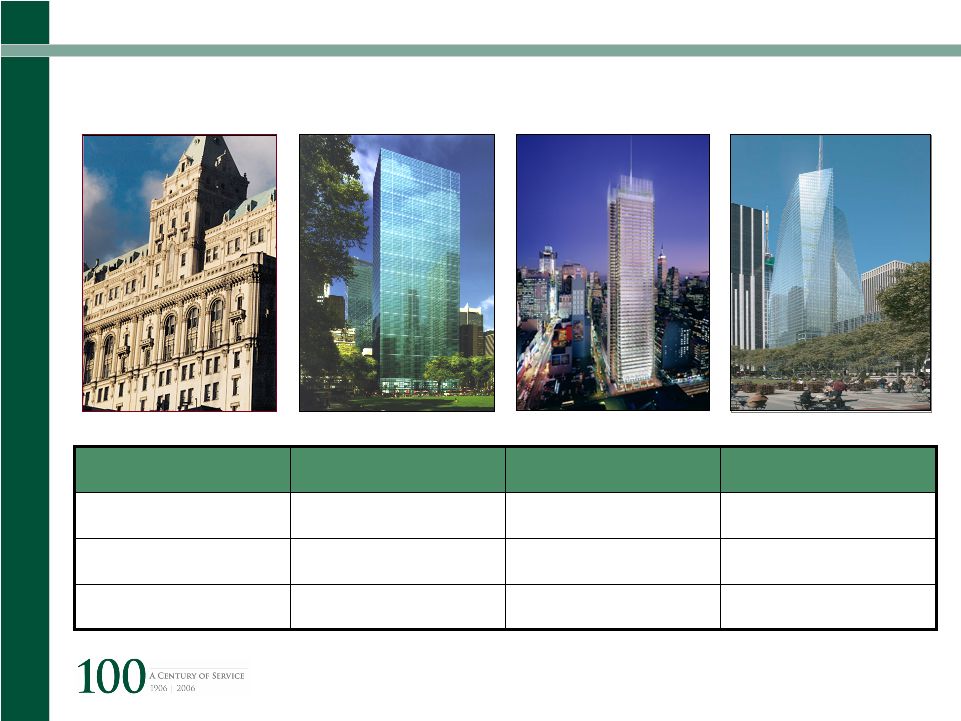
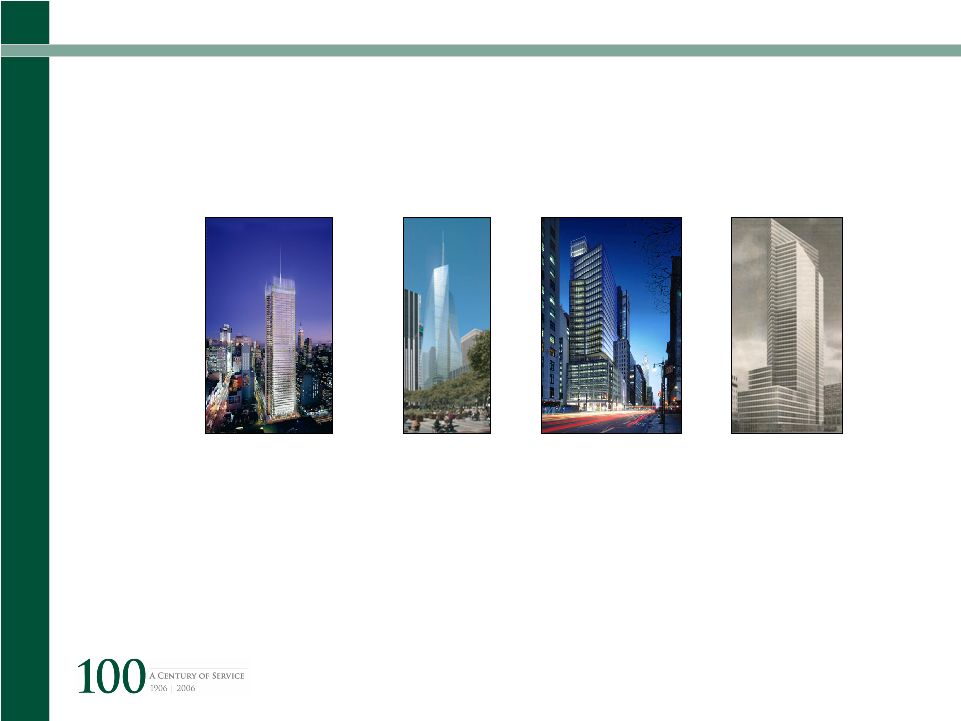
Richard Ellis | Page 69 620 Eighth Ave. One Bryant Park 505 Madison Ave. Site 26 2006 2006 2006 2006 New York Times Bank of America CIT Goldman Sachs New Construction 2006 |
 CB
Richard Ellis | Page 70 New York City Build it and they will come |
 CB
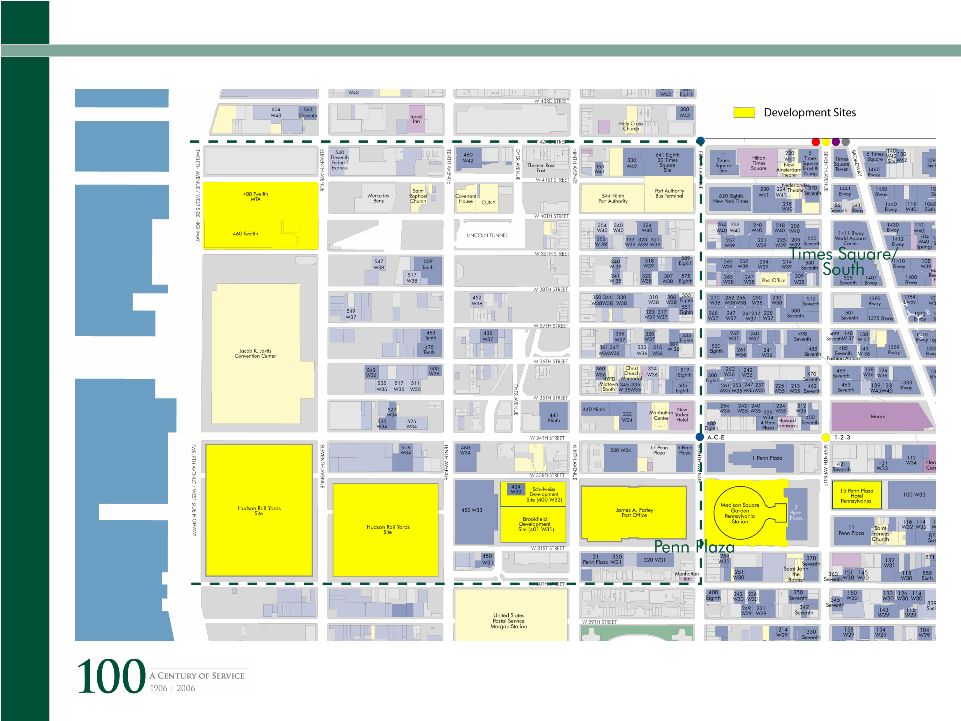
Richard Ellis | Page 71 Select Westside Development Sites |
 CB
Richard Ellis | Page 72 Westside Development |
 CB
Richard Ellis | Page 73 DOWNTOWN MANHATTAN |
 CB
Richard Ellis | Page 74 Downtown Office Market Downtown Availability Rates – Market Inflection Points 6 Years 5 Years 1995 ? 0% 5% 10% 15% 20% 25% 30% 1990 2000 2006 YTD |
 CB
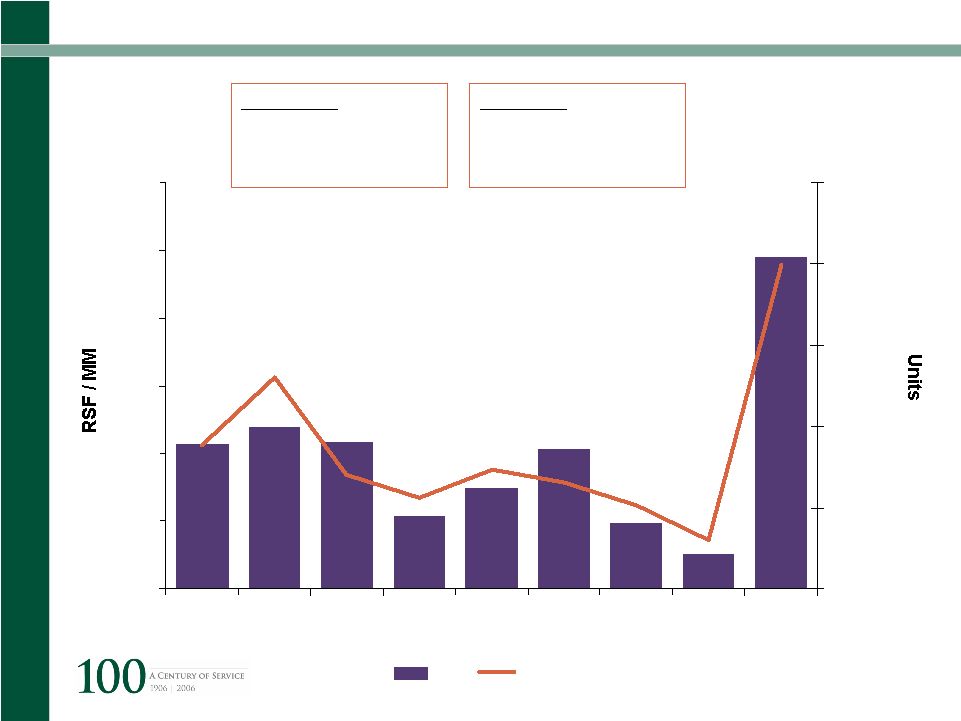
Richard Ellis | Page 75 Downtown Residential Conversions 0.0 0.5 1.0 1.5 2.0 2.5 3.0 1997 1998 1999 2000 2001 2002 2003 2004 04/05 0 500 1000 1500 2000 2500 RSF Units Proposed Units: 3,000 RSF: 3,684,000 Buildings: 11 Completed Units: 5,562 RSF: 6,158,576 Buildings: 20 |
 CB
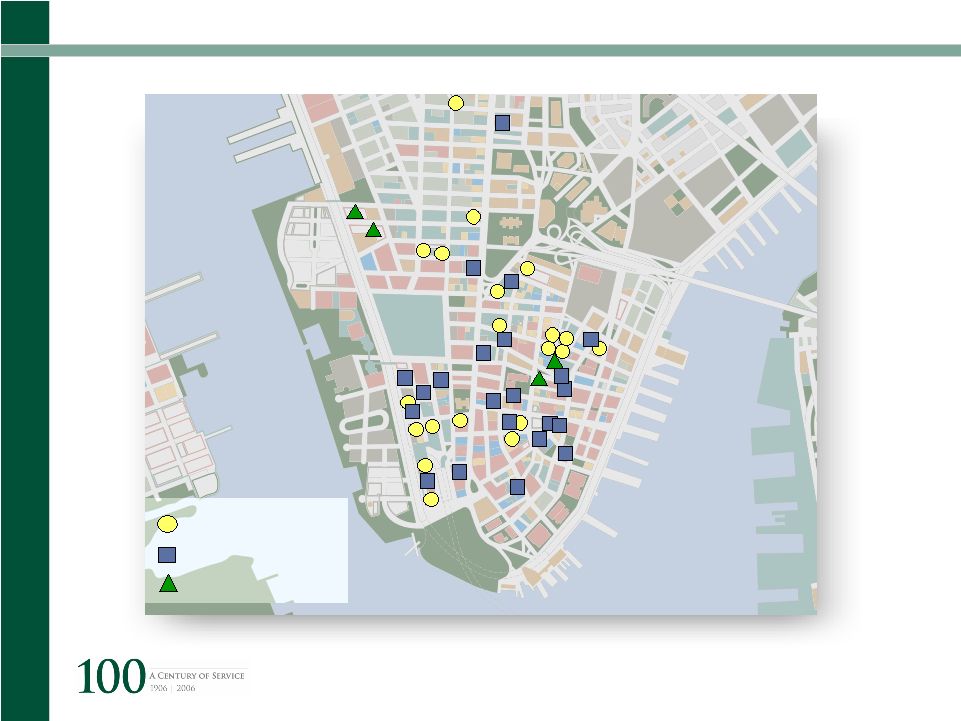
Richard Ellis | Page 76 233 Broadway* 5 Beekman St. 170 Broadway 15 Maiden Lane 90 West St. 40 Rector St. 40 Fulton St. 15 Broad St.* 20 Exchange Place 63 Wall Street 100 Maiden Lane 10 Hanover Sq. 91-99 John St. 85 John St. 127 John St. 271 Church St. 270 Broadway 53 Park Place 110/120 Church St. 150 Nassau St. 15 Park Row 17 John St. 80 John St. 90 John St. 45 Wall St. 25 Broad St. 17 Battery South 21 West St. 90 Washington St. 19 Rector St. 71 Broadway 110 Washington St. 95 Maiden Ln. 67 Wall St. 20 Pine St. 80 Broad St. 5C 5B 10 Liberty St. 2 Gold St. Completed Planned/Potential New Development Planned & Proposed Residential Conversions from Commercial Downtown Manhattan * Partial Building 100 Maiden Lane represents a potential project Source: City of New York Department of City Planning 350 Broadway 133-135 Greenwich 4 Albany St. 14 Wall 25 Broadway 28-32 Washington St. |
 CB
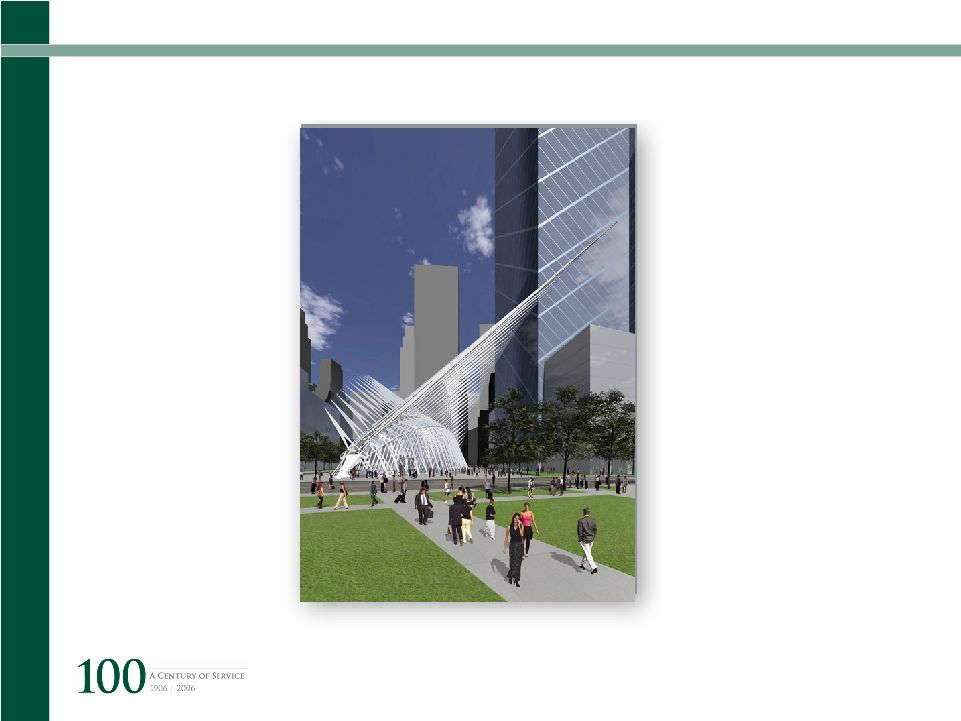
Richard Ellis | Page 77 Downtown World Trade Center Transportation Hub Santiago Calatrava's design |
 CB
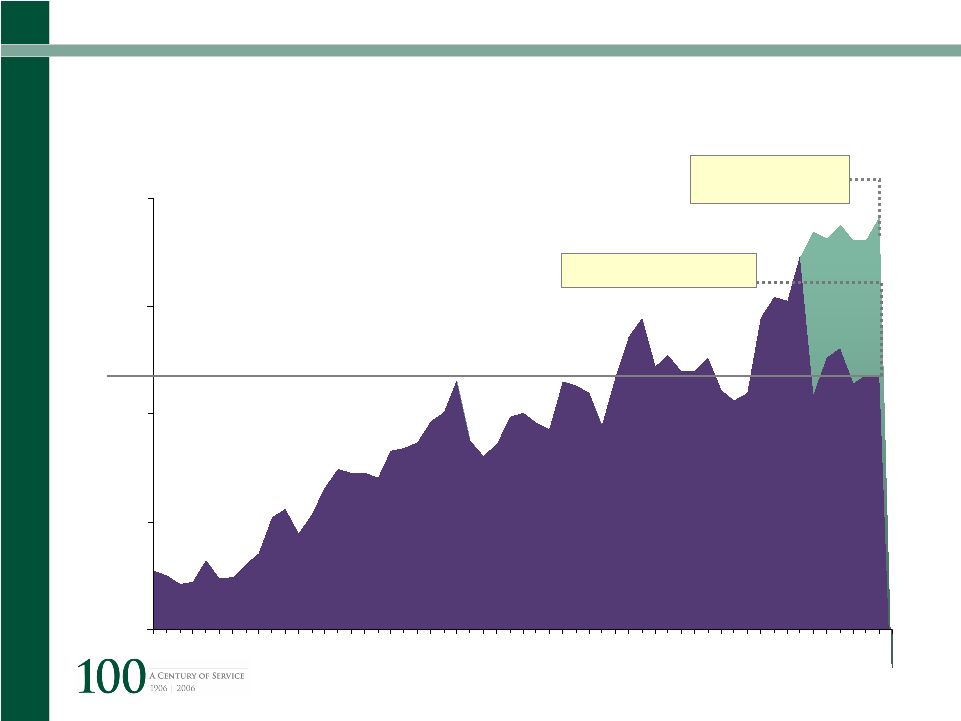
Richard Ellis | Page 78 0 1 2 3 4 5 6 7 8 9 10 11 1996 1998 2000 2002 2004 2006 Downtown Historical Leasing Activity K E Y Full Year Year to Date May 2006 |
 CB
Richard Ellis | Page 79 Manhattan Office Market – Annual Snapshot Sublet Blocks Direct Blocks Total RSF 16 4 (10) 22 4.7 million 2.5 million (3.3 million) 5.5 million 2 2 0 0 April 2006 Blocks + New Blocks - Absorption April 2005 Blocks Largest Downtown Blocks Available (>100,000 RSF) January 2004 vs. April 2006 20% Fewer Blocks in over 2 Years |
 CB
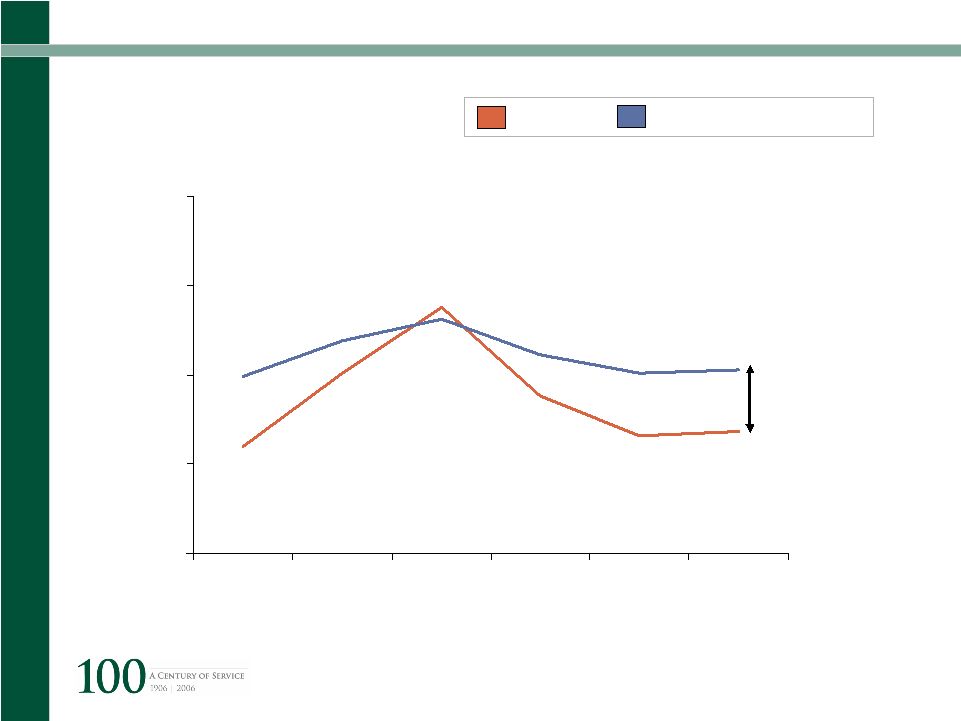
Richard Ellis | Page 80 Asking Rents % Discount of Downtown to Midtown 10% 20% 30% 40% 50% 2Q '92 3Q' '93 4Q '94 1Q'96 2Q '97 3Q '98 4Q '99 1Q '01 2Q '02 3Q '03 4Q '04 1Q '06 Average: 31% Average: 31% Today: 48% 34% W/out 7 WTC |
 CB
Richard Ellis | Page 81 World Trade Center Sites and 7 World Trade Center • Annual rent reduction incentive • Commercial rent tax exemption • Sales tax exemption • PILOT Other Downtown Incentives • REAP • Commercial Rent Tax Exemption • Sales Tax Exemption Pre-1975 Buildings • Real Estate Tax Abatement • Lower Manhattan Energy Program Incentive Programs - Downtown |
 CB
Richard Ellis | Page 82 Downtown Resolution Reached on Demolition 130 Liberty Street |
 CB
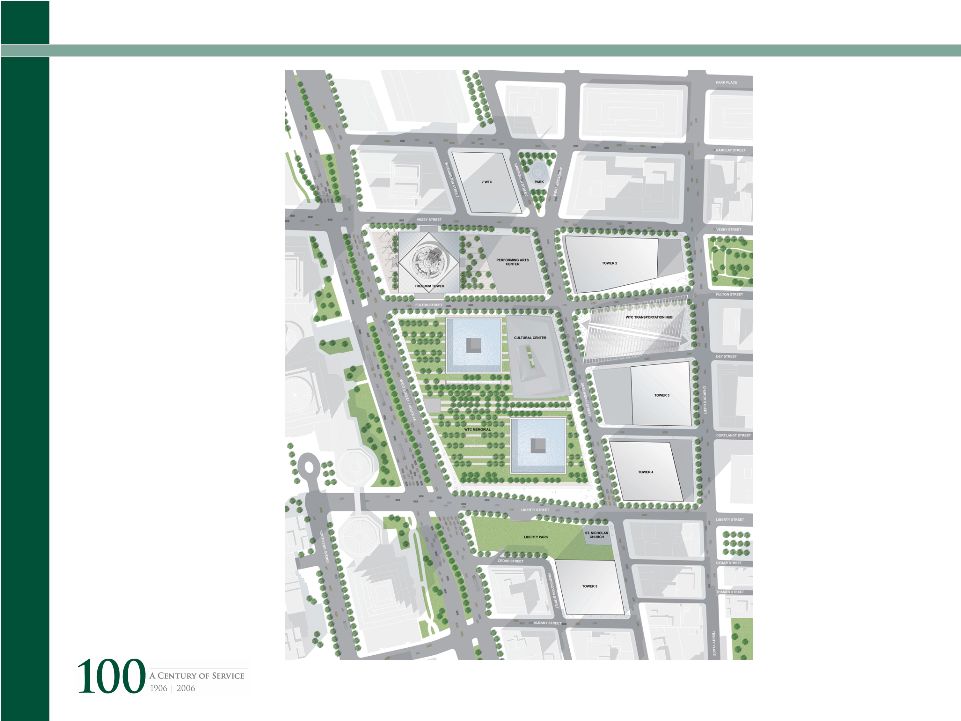
Richard Ellis | Page 83 Lower Manhattan Rebuilding |
 CB
Richard Ellis | Page 84 ACROSS THE RIVERS |
 CB
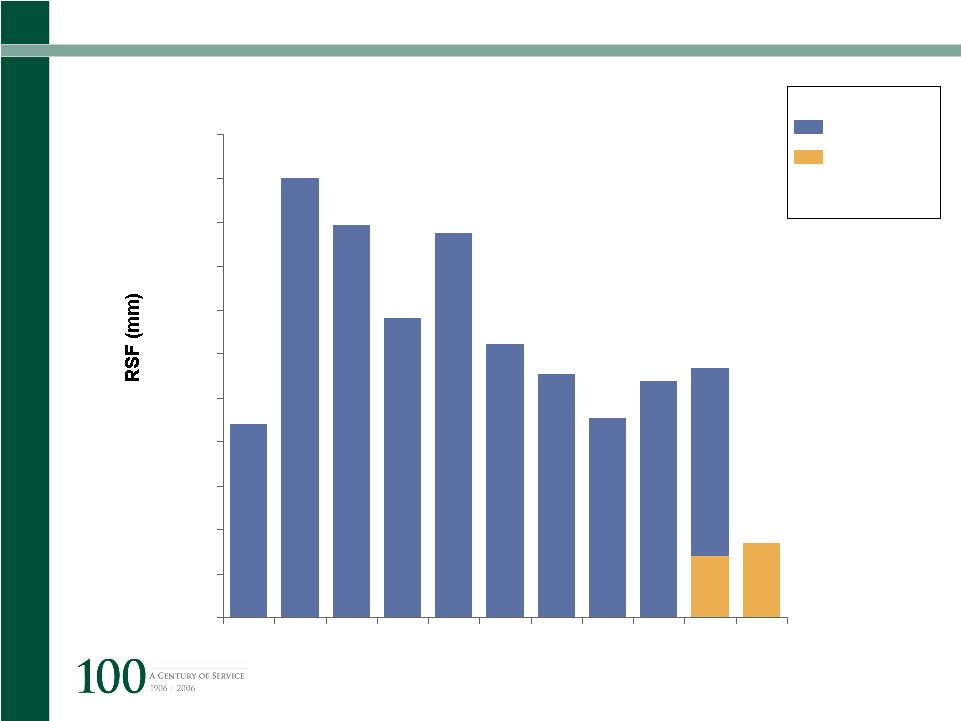
Richard Ellis | Page 85 Alternative Office Markets Size of Markets (Millions RSF) 0.0 2.0 4.0 6.0 8.0 10.0 12.0 14.0 16.0 18.0 20.0 Long Island City Brooklyn NJ Waterfront |
 CB
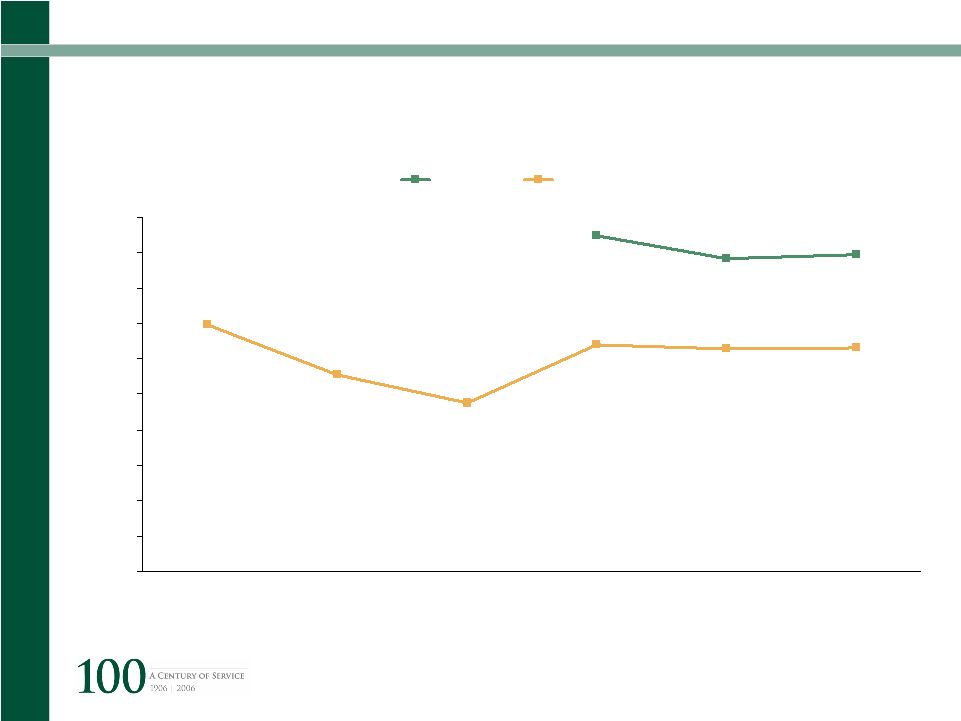
Richard Ellis | Page 86 Alternative Office Market Historical Availability Rates 0% 5% 10% 15% 20% 25% 2001 2002 2003 2004 2005 2006 Brooklyn Waterfront |
 CB
Richard Ellis | Page 87 Alternative Office Market Average Asking Rent $20 $21 $22 $23 $24 $25 $26 $27 $28 $29 $30 2001 2002 2003 2004 2005 2006 Brooklyn Waterfront |
 CB
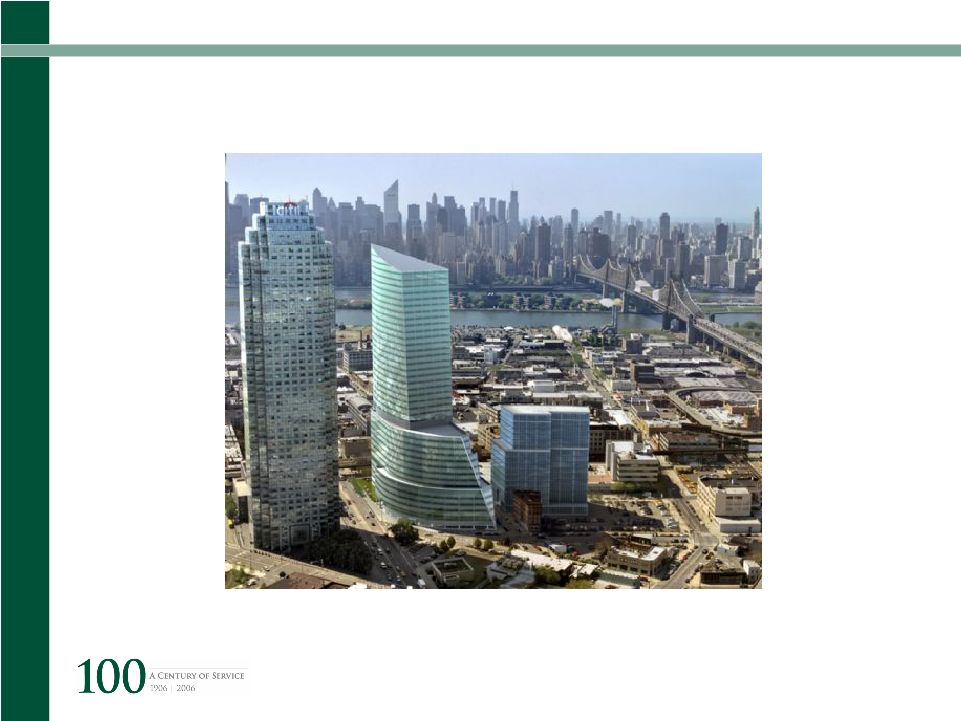
Richard Ellis | Page 88 Alternative Office Market Long Island City |
 CB
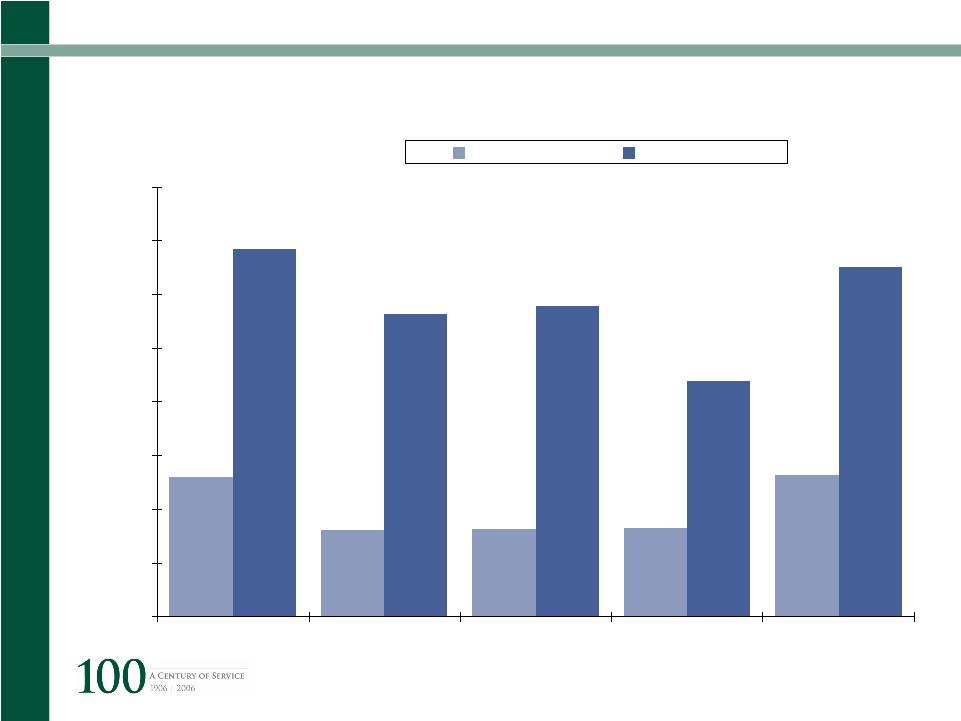
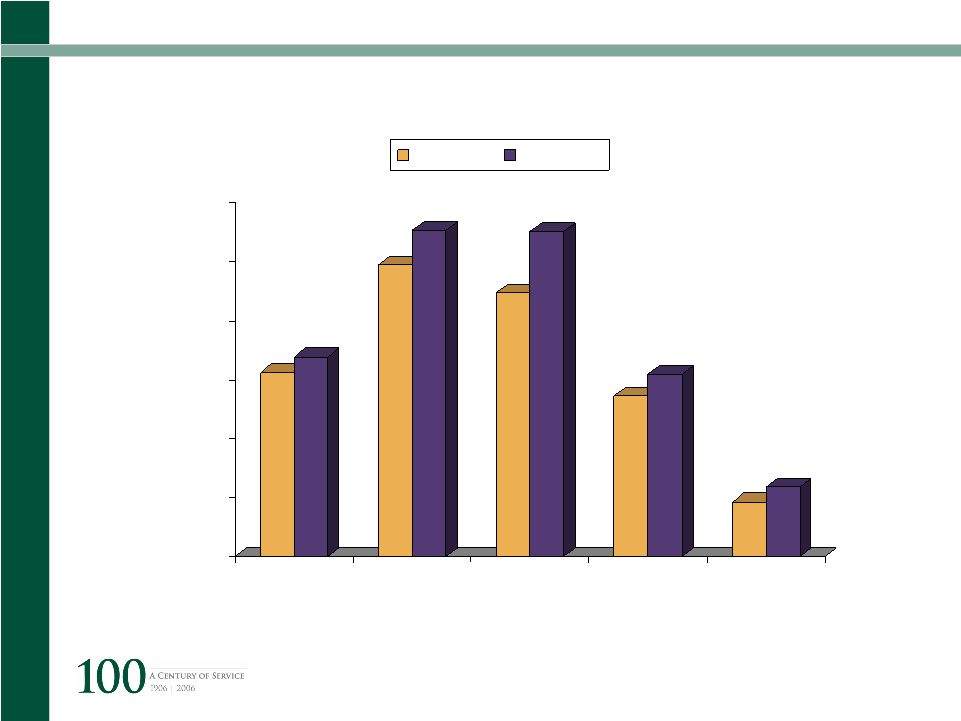
Richard Ellis | Page 89 New York City Economy NYC Population Boom (YR 2005 – vs. 2025 Estimate) 0 500 1,000 1,500 2,000 2,500 3,000 Manhattan Brooklyn Queens Bronx Staten Island YR 2005 YR 2025 Source: NY Times |
 CB
Richard Ellis | Page 90 New York City Economy NYC Population Change (YR 2005 – vs. 2025 Estimate) Source: NY Times 0 500 1,000 1,500 2,000 2,500 3,000 White Black Asian Hispanic YR 2005 YR 2025 |