
Business Review
Day
Capital Markets
May 17, 2006
Brian Stoffers
President, Capital Markets
Exhibit 99.4
 Business Review
Day Capital Markets May 17, 2006 Brian Stoffers President, Capital Markets Exhibit 99.4 |
 CB Richard Ellis |
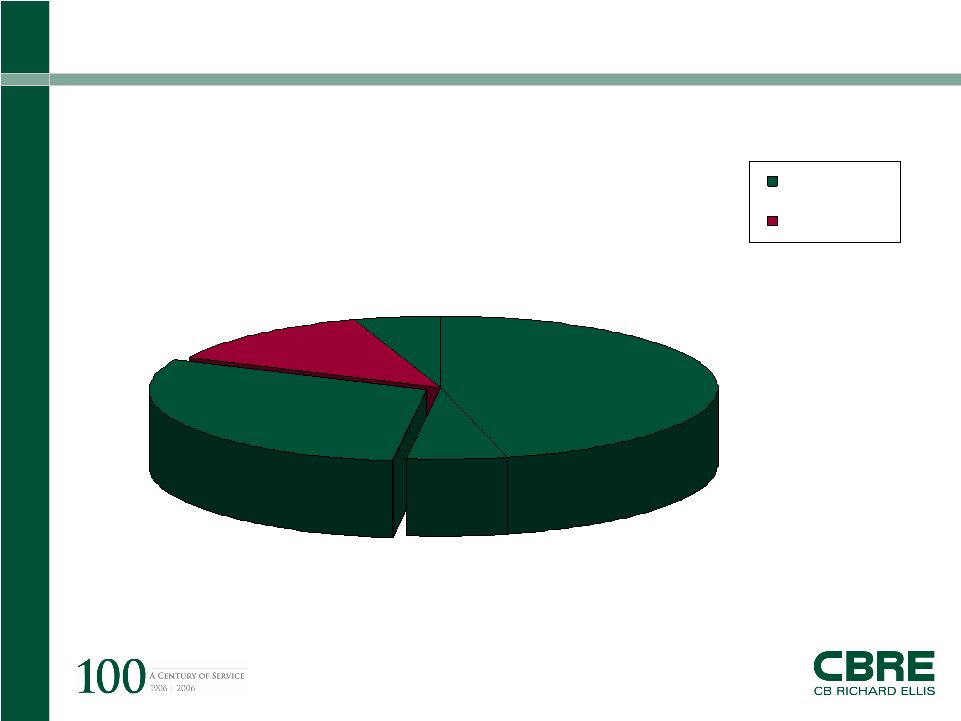
Page 2 CB Richard Ellis | Page 2 2005 Capital Markets % of Americas Revenue 5% 13% 30% 6% 46% Advisory Outsourcing U.S. Brokerage Valuation Capital Markets $590m Outsourcing Canada & Latin America |
 CB Richard Ellis |
Page 3 CB Richard Ellis | Page 3 CBRE Capital Markets Formed in 2005 to offer fully integrated capital markets solutions on a global basis • Investment Properties • CBRE | Melody Formalizes collaboration between investment sales and debt placement professionals Meets clients’ capital requirements efficiently |
 CB Richard Ellis |
Page 4 CB Richard Ellis | Page 4 About Capital Markets Investment Property Sales Capabilities • Valuation • Strategy Development Financing Placement Capabilities • Fixed and Variable • Construction • Bridge • Mezzanine • Tenant-in-Common • Brokerage • Property & Portfolio Recapitalization • Preferred Equity • Structured Equity • Joint Venture Equity • Loan Sale Advisory • Loan Servicing |
 CB Richard Ellis |
Page 5 CB Richard Ellis | Page 5 Annual Volume 56% $70.6B $110.2B Total Capital Markets Activity 44% $28.4B $40.8B Total International Sales (Asia and EMEA) 33% $13.3B $17.8B Americas Debt Volume (Melody) 79% $28.9B $51.6B Americas Sales Volume (CBRE) % Change 2004 2005 |
 CB Richard Ellis |
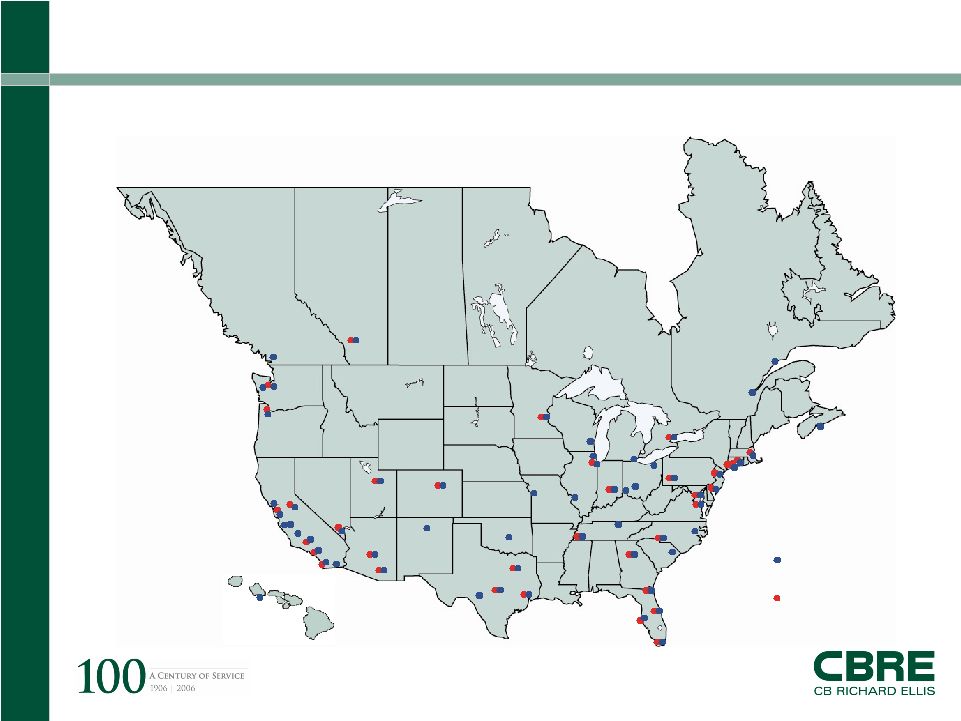
Page 6 CB Richard Ellis | Page 6 About Capital Markets Office Locations WA OR CA AZ UT ID MT WY CO NM TX OK KS NE SD ND MN IA MO MO LA MS AL GA FL SC TN NC CA VA WV KY IN WI MI CA NJ CT MA NH RI VT New Brunswick CA British Columbia Alberta Saskatchewan Manitoba Ontario Quebec NV OH PA NY IL HONOLULU • IP Offices • Melody Offices |
 CB Richard Ellis |
Page 7 CB Richard Ellis | Page 7 Key Business Drivers Abundant capital – both debt and equity Aggressive Buyers/Flexible loan terms “What does it take to win?” underwriting Capital markets efficiencies/inefficiencies CMBS debt, foreign and domestic equity Attractive asset class TIC’s (Section 1031 exchanges) Developing CDO market |
 CB Richard Ellis |
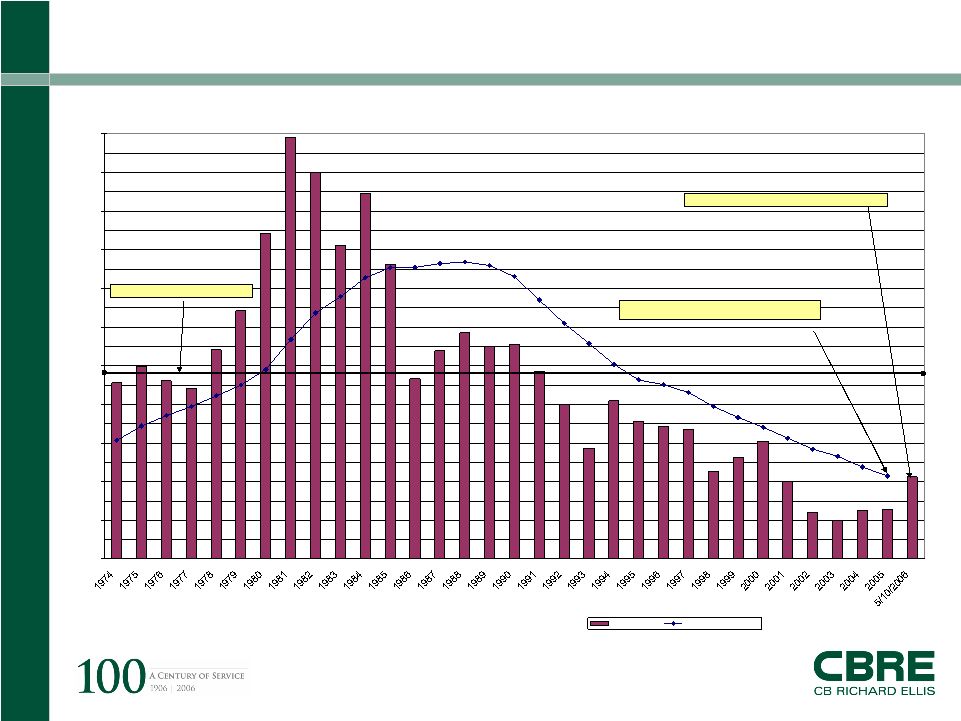
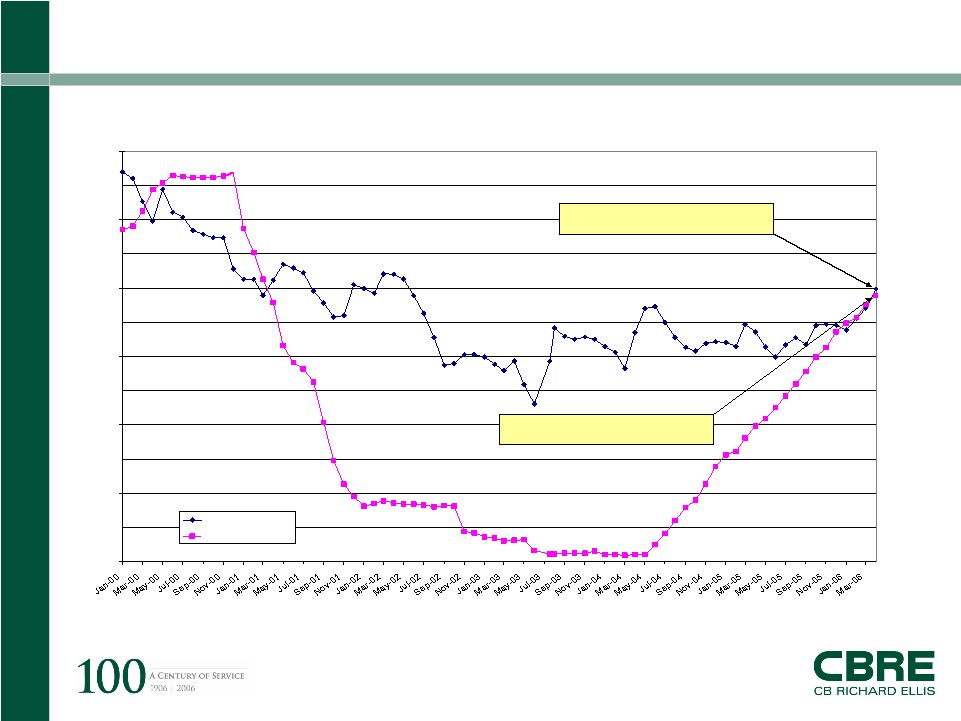
Page 8 CB Richard Ellis | Page 8 Key Business Drivers Historic 10-year Treasury Rates 3% 4% 5% 6% 7% 8% 9% 10% 11% 12% 13% 14% 10-Yr. Treasury Trailing 10-Yr. Average Source: Wall Street Journal May 10, 2006 Close @ 5.13% 30-Year Average = 7.77% 10 yr. Trailing Average 5.15% |
 CB Richard Ellis |
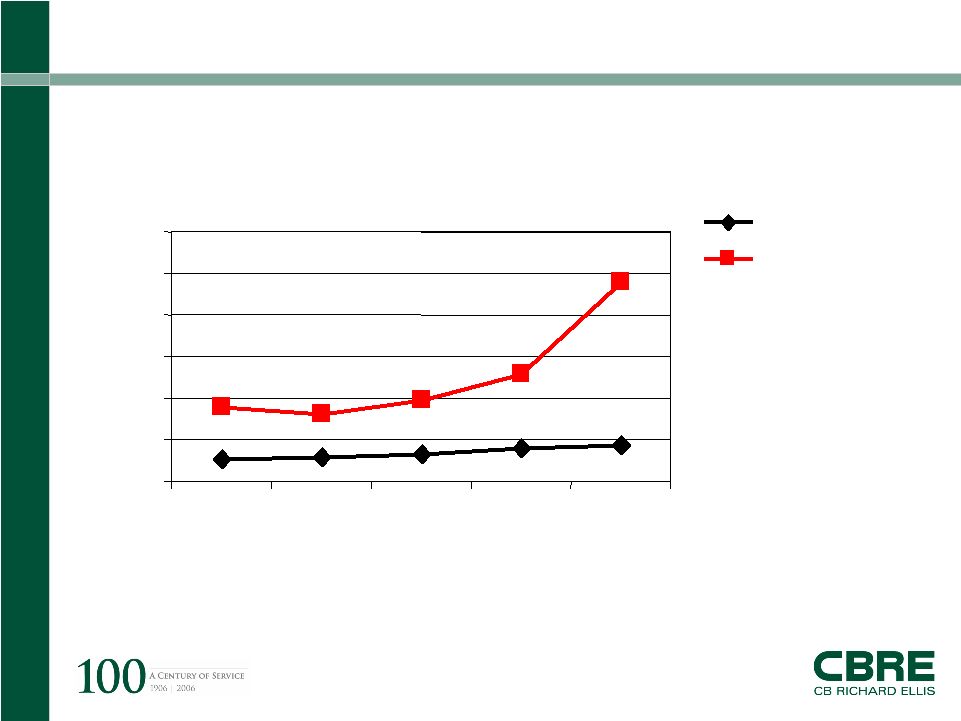
Page 9 CB Richard Ellis | Page 9 Key Business Drivers 10-Yr. Treasury vs. 30-day LIBOR 1.00% 2.00% 3.00% 4.00% 5.00% 6.00% 7.00% Monthly Averages 10 Year Treasury 30-day LIBOR Source: Wall Street May 10, 2006 close @ 5.13% 10-Year Tresury May 10, 2006 close @ 5.17% 30-day LIBOR |
 CB Richard Ellis |
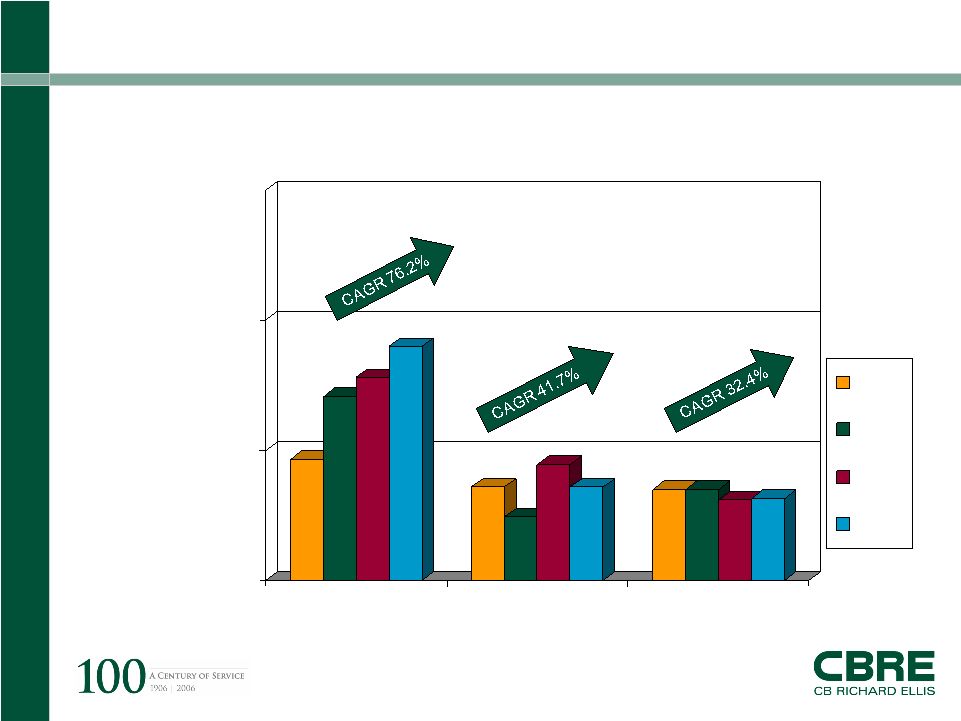
Page 10 CB Richard Ellis | Page 10 $0 $50 $100 $150 $200 $250 $300 2001 2002 2003 2004 2005 Life Companies CMBS Data in billion of dollars Source: MBA Quarterly Data Book, American Council of Life Insurance Companies, and Commercial
Mortgage Alert Life Company vs. CMBS Historical Issuance Key Business Drivers |
 CB Richard Ellis |
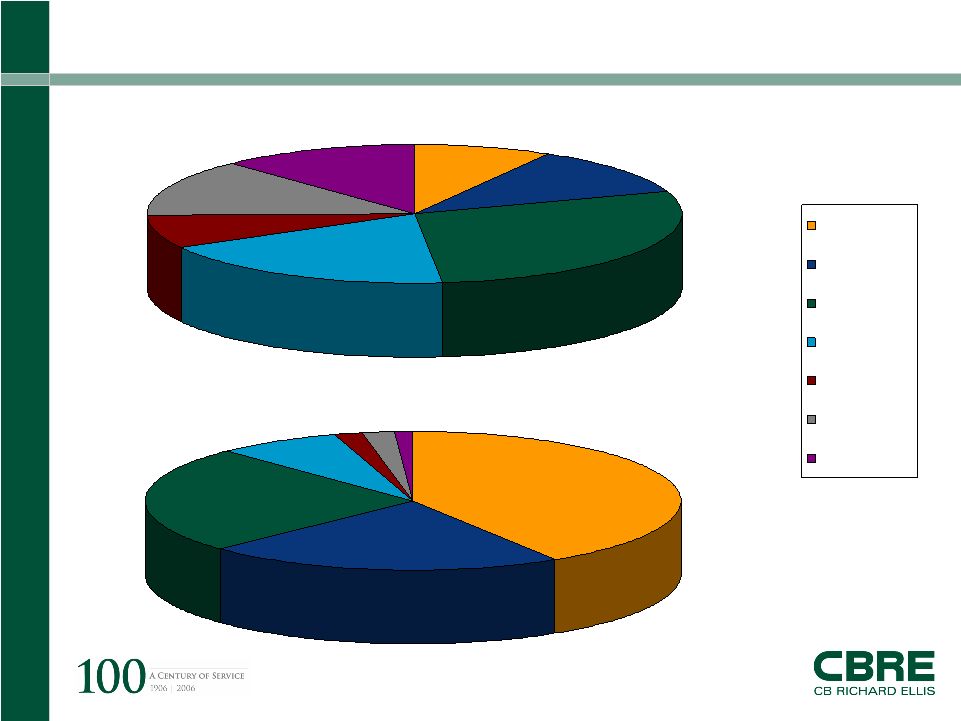
Page 11 CB Richard Ellis | Page 11 0% 10% 20% 30% CBRE C&W Eastdil 2002 2003 2004 2005 Market Share % Competitive Positioning Investment Sales Market CAGR: 41.3% Source: Real Capital Analytics |
 CB Richard Ellis |
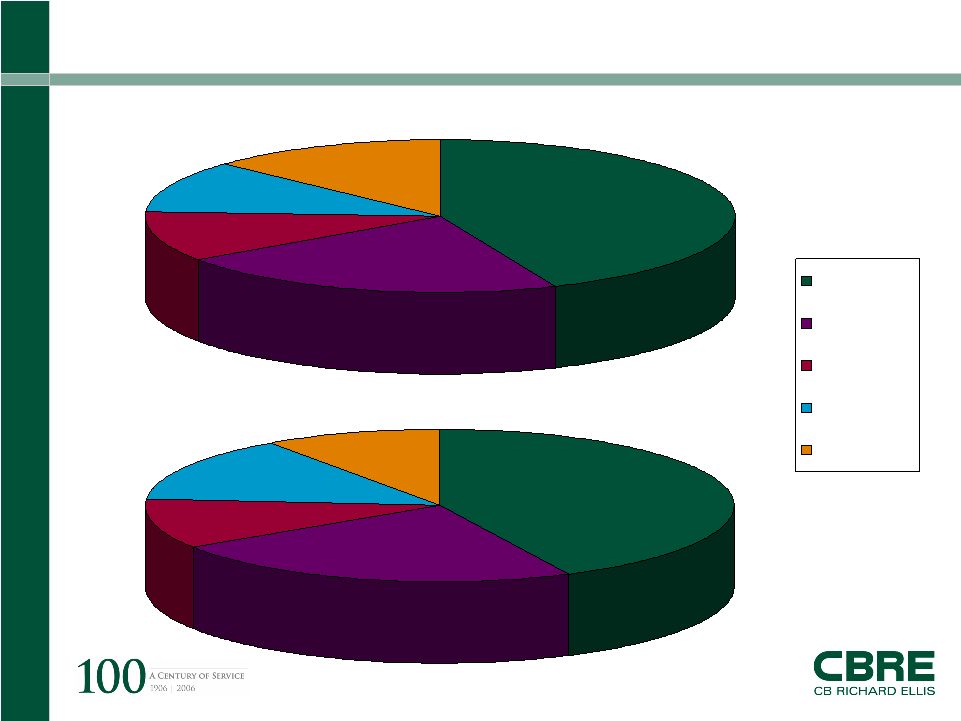
Page 12 CB Richard Ellis | Page 12 12% 13% 8% 19% 29% 11% 8% Up to $5 M $5 to $10 M $10 to $25 M $25 to $50 M $50 to $75 M $75 to $100 M Over $100 M 41% 22% 25% 7% 2% 2% 1% 2005 Originations by Deal Size $17.8 Billion 1,298 Loans |
 CB Richard Ellis |
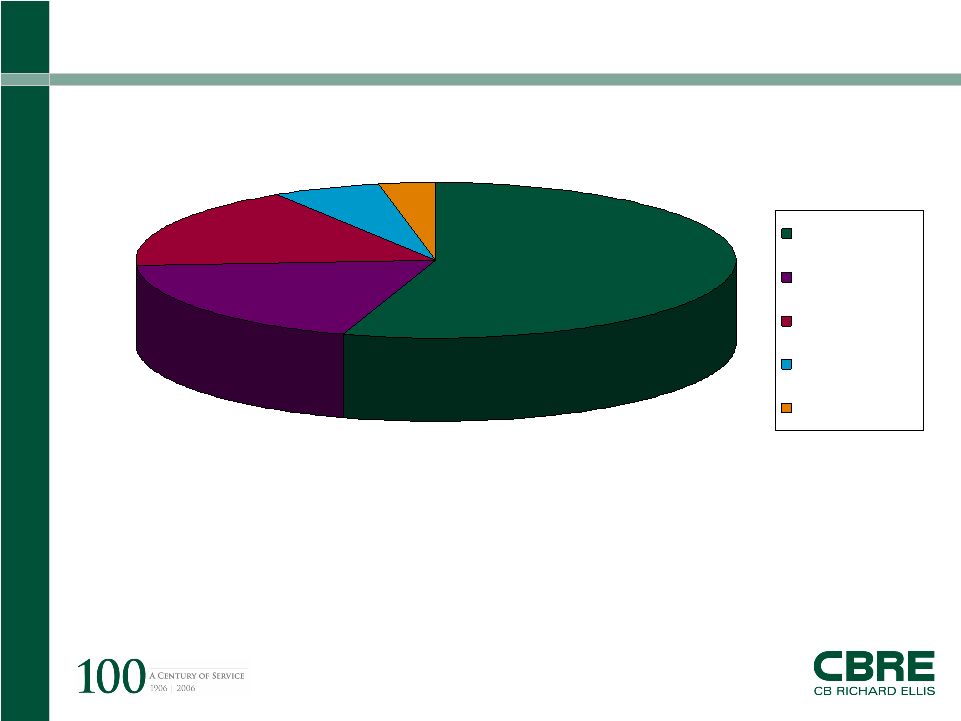
Page 13 CB Richard Ellis | Page 13 2005 Originations by Capital Source 13% 11% 11% 22% 43% Conduits Life Company Agency Bank Other 10% 14% 11% 23% 42% $17.8 Billion 1,298 Loans |
 CB Richard Ellis |
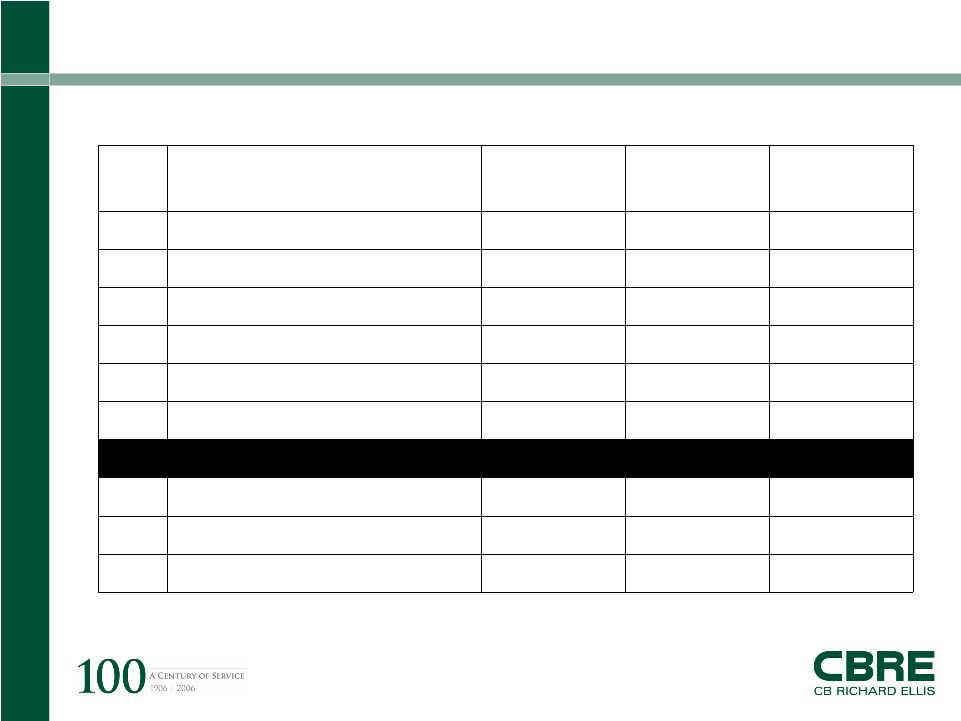
Page 14 CB Richard Ellis | Page 14 Loan Servicing Statistics – 2005 3% 6% 17% 19% 55% Life Company Conduits/CMBS Agency Pension Funds Banks Total Servicing Portfolio: $30 billion* * Reflects only CBRE | Melody portion of the $67.3 billion GEMSA Loan Servicing portfolio
|
 CB Richard Ellis |
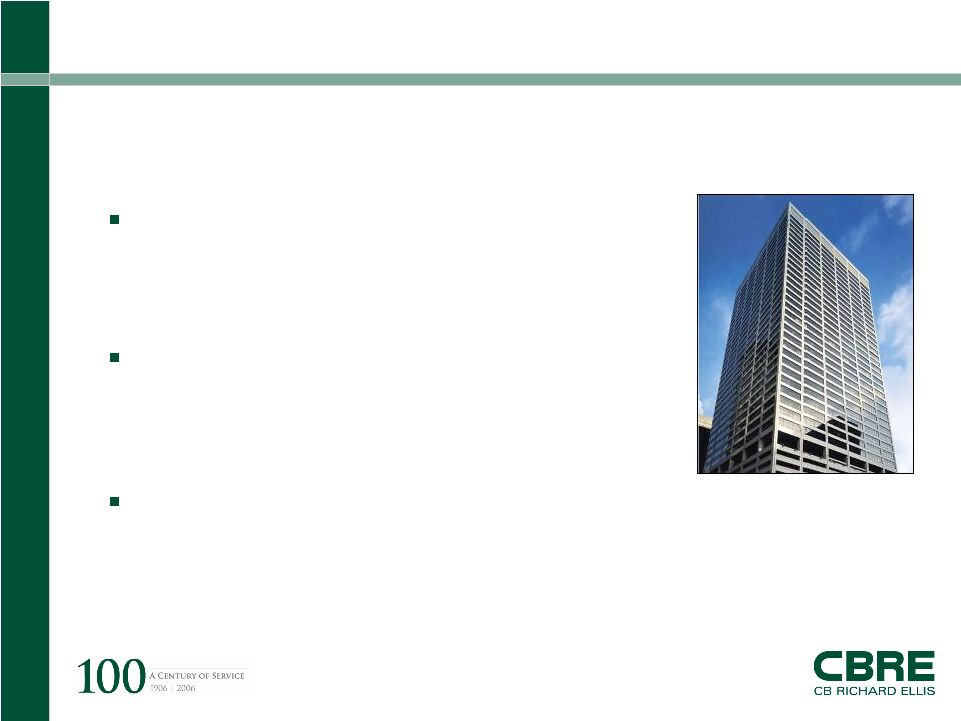
Page 15 CB Richard Ellis | Page 15 Servicing Volume by Rank 2005 Period: Year Ended December 31, 2005 Source: Annual Survey of Commercial Mortgage Servicing Firms – Mortgage Bankers Association 1 Joint venture between CBRE | Melody and GE Real Estate 4,754 35,289 6,153 7,751 10,488 12,947 11,446 18,725 54,020 32,501 # of Loans $6.2 $29.3 NorthMarq Capital, Inc. 10 $1.1 $38.0 Washington Mutual 9 $7.6 $46.5 Prudential Asset Resources 8 $8.7 $67.3 GEMSA Loan Services, L.P.1 7 $7.0 $72.8 Bank of America, N.A. 6 $6.6 $84.9 KeyBank Real Estate Capital 5 $8.3 $95.5 Wells Fargo 4 $8.5 $159.1 Midland Loan Services 3 $4.3 $231.4 GMAC Commercial Holding Corp. 2 $7.2 $233.1 Wachovia 1 Ave Loan Size (in millions) Amount (in billions) Company Rank |
 CB Richard Ellis |
Page 16 CB Richard Ellis | Page 16 Case Study: 1818 Market Street CBRE Capital Markets arranges $152.8 million sale and $132.0 million acquisition financing. CBRE’s Institutional Group (IG) sold the property for the third time (1996, 2001, 2006). CBRE | Melody secured the high-leverage loan for the buyer and enabled the sale to close. Philadelphia |
 CB Richard Ellis |
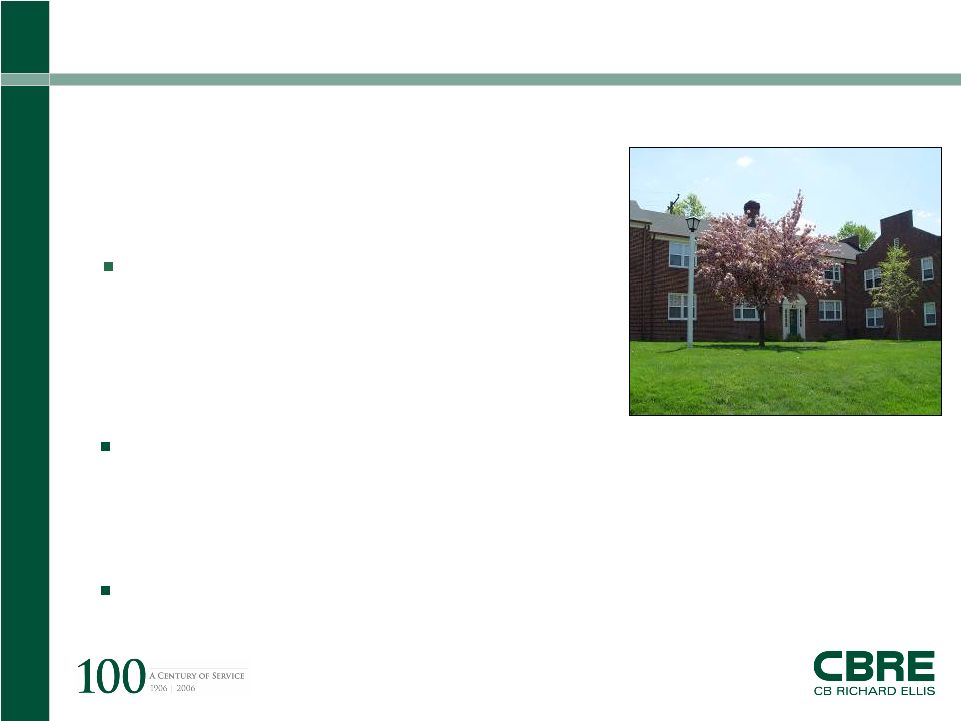
Page 17 CB Richard Ellis | Page 17 Case Study: Loch Raven Village CBRE’s Institutional Group (IG) represented the seller, whom they also represented during the purchase of the property in 2002. The open collaboration between IG and CBRE | Melody enabled the sale to close. CBRE Capital Markets arranges $32.0 million sale and $38.5 million joint venture equity and debt financing. Maryland |
 CB Richard Ellis |
Page 18 CB Richard Ellis | Page 18 2006 Capital Markets Strategic Initiatives Enhance Capital Markets platform – Co-branding/ marketing – Training – Co-location Expand market presence through acquisition and high profile/strategic hires Continued international expansion/ integration Implement technology-based productivity enhancements GEMSA marketing |
 CB Richard Ellis |
Page 19 CB Richard Ellis | Page 19 |