
Business Review
Day
Economic Trends in
Commercial Real Estate
May 17, 2006
Raymond G. Torto, Ph.D., CRE
Exhibit 99.2
 Business Review
Day Economic Trends in Commercial Real Estate May 17, 2006 Raymond G. Torto, Ph.D., CRE Exhibit 99.2 |
 CB Richard Ellis |
Page 2 Recent Returns |
 CB Richard Ellis |
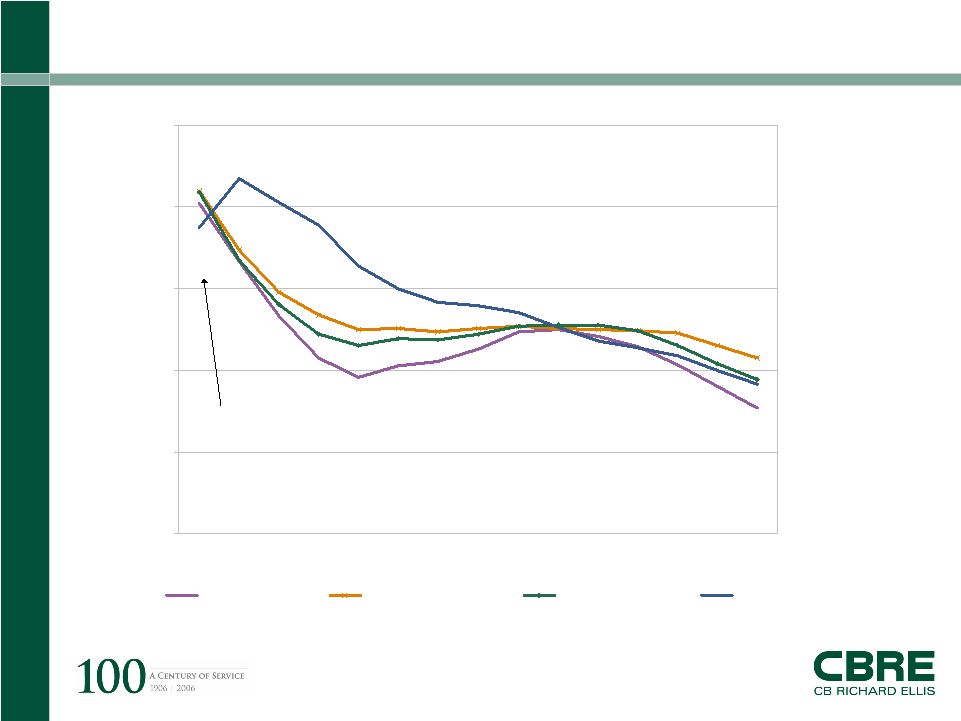
Page 3 0 5 10 15 20 25 1 2 3 4 5 6 7 8 9 10 11 12 13 14 15 Office (20.23) Apartment (20.97) Industrial (20.9) Retail (18.76) One Year Total Return, % Historical Holding Period (Years) NCREIF Holding Period Returns 2006.1 Source: NCREIF and TWR Last Year About 20% Returns for All Types |
 CB Richard Ellis |
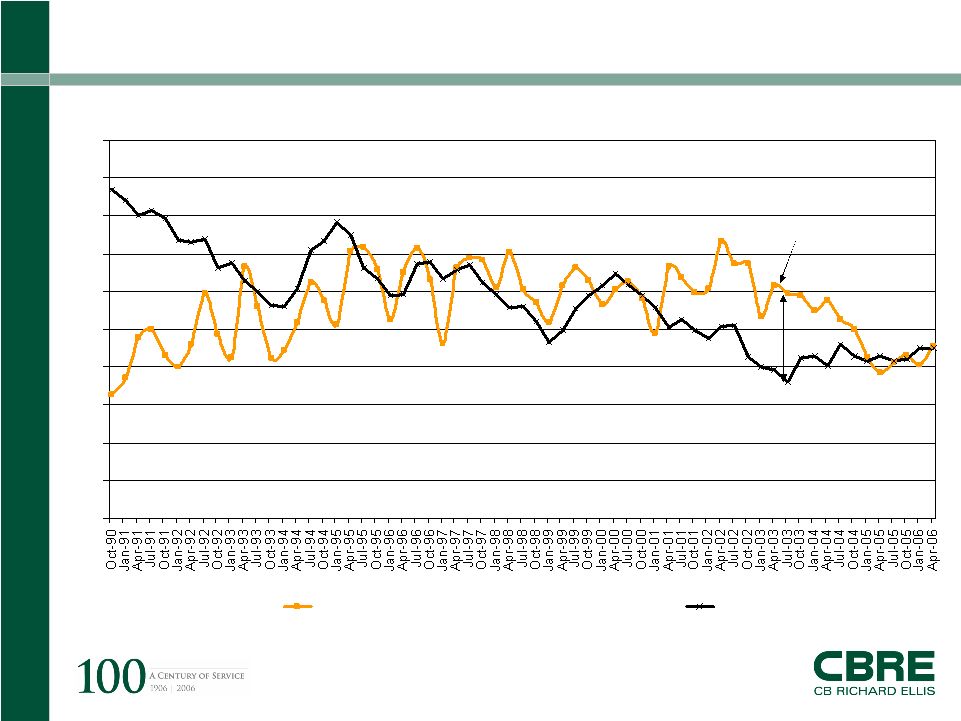
Page 4 0 1 2 3 4 5 6 7 8 9 10 CF return 10 yr The Cash Yield Advantage of Recent Years Has Been Competed Away Source: NCREIF, TWR 1Q, 06, all types Cash Yield Advantage % |
 CB Richard Ellis |
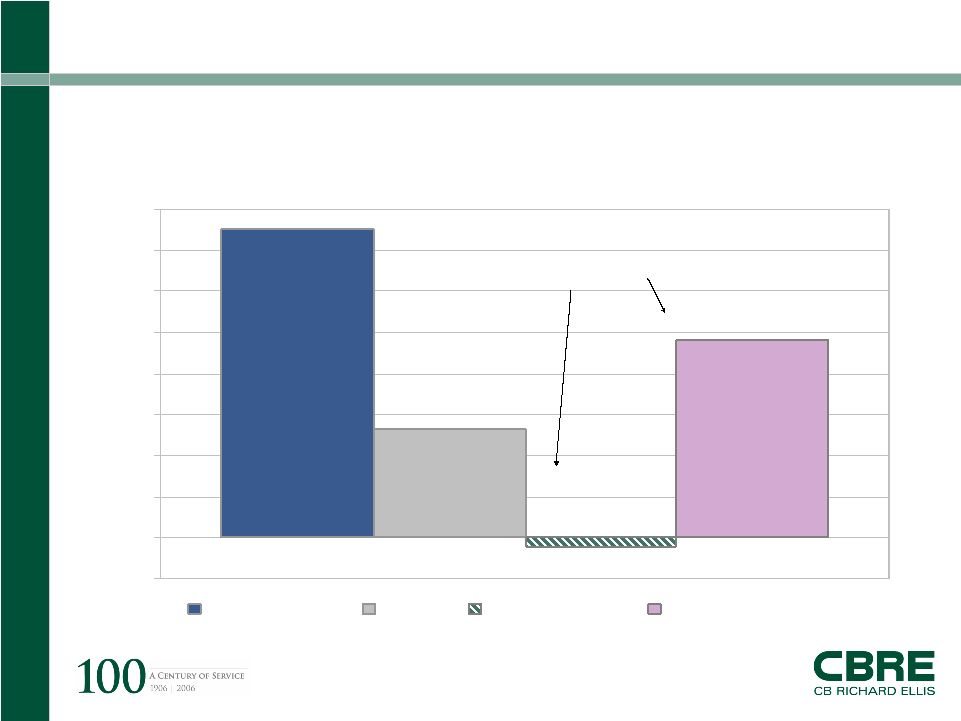
Page 5 Doing It With Smoke & Cap Rates 15.0 5.3 9.6 -0.4 -2 0 2 4 6 8 10 12 14 16 Total Return Yield NOI Growth Cap Rate Contribution 3-Year Average, % Source: TWR Investment Database, Spring 2006 Components of Return (2002.4-2005.4) NCREIF-weighted returns for Office, Industrial, Multi-Housing, and Retail. Yield Appreciation Comes From |
 CB Richard Ellis |
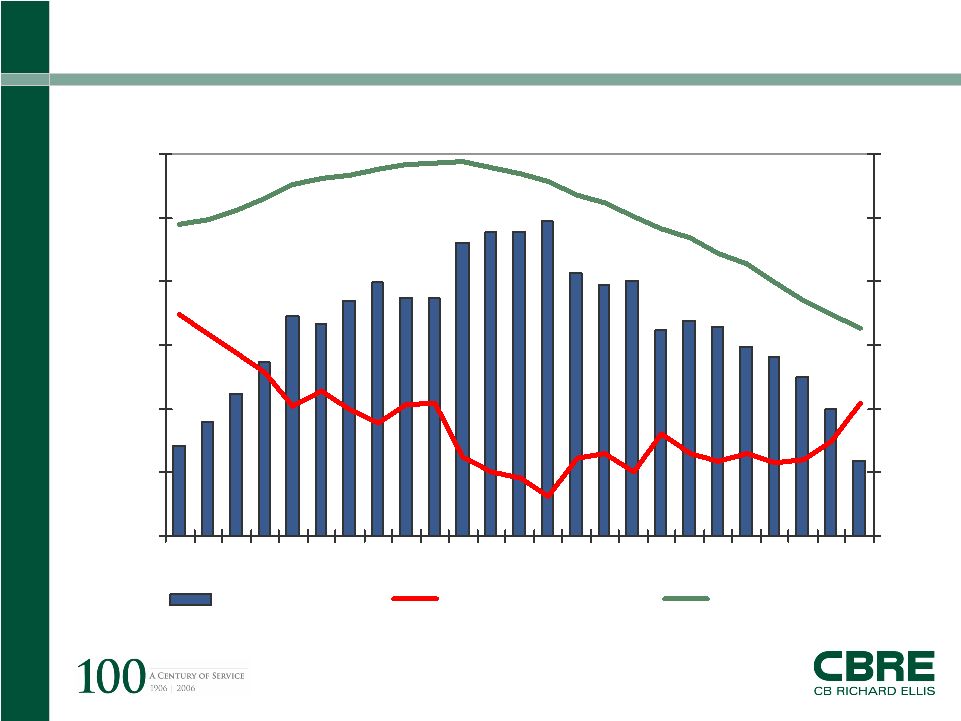
Page 6 0 100 200 300 400 500 600 2000 2001 2002 2003 2004 2005 Today 3 4 5 6 7 8 9 Basis-point spread 10yr. Treasury yield, % Office cap rate, % Basis points % Cap Rates Are Unlikely to Go Lower Source: NCREIF, Federal Reserve |
 CB Richard Ellis |
Page 7 TWR’s View: Property Markets |
 CB Richard Ellis |
Page 8 Nothing Happens In a Vacuum. The Economy Is Moving Forward Industrial capacity utilization at 81.2% Manufacturing capacity utilization at 80.4% Business sales rising by 8.5% year over year Inventories-to-sales ratio extremely low at 1.24 Corporate profits are rising at 21.3% year over year Commercial & Industrial lending up 12.3% year over year Exports are rising at a clip of 13.5% And on and on and on.... We’re doing well. Don’t worry |
 CB Richard Ellis |
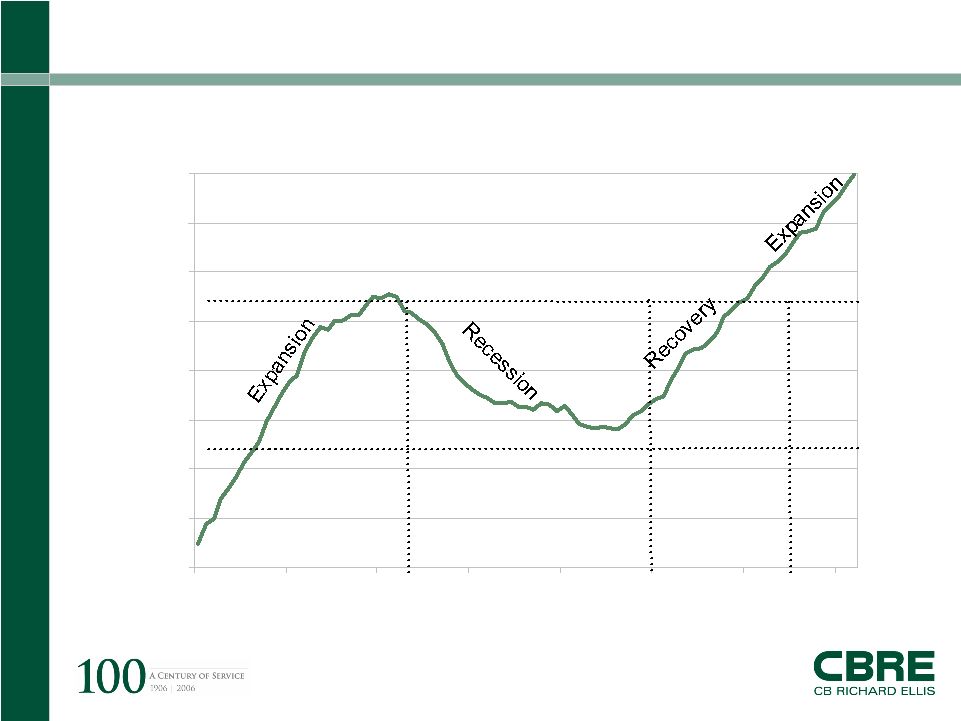
Page 9 Second Year of Expanding Jobs 127 128 129 130 131 132 133 134 135 1999 2000 2001 2002 2003 2004 2005 2006 U.S. Total Employment, Mil. Source: BLS data as of March 2006. |
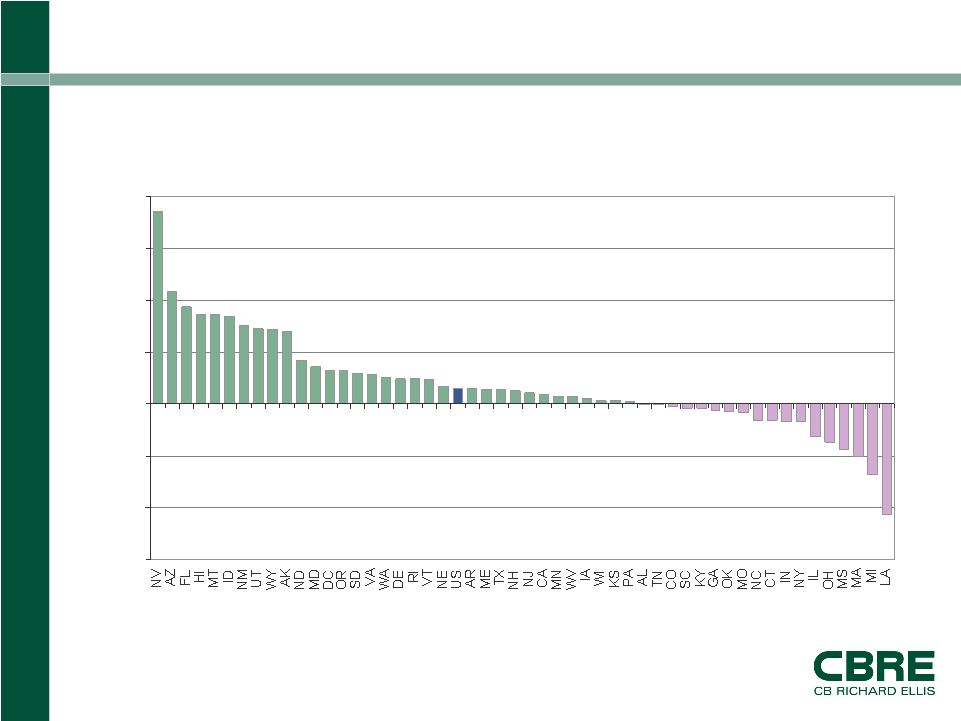 -15 -10 -5 0 5 10 15 20 Percent Above or Below Pre-Recession Peaks U.S. Top 3: Nevada +18.5% Arizona +10.9% Florida +9.4% Michigan -6.8% Mass -5.0% Mississippi -4.4% Ohio -3.7% Illinois -3.1% Wide Job Growth Variance! Source: BLS. Data ending December 2005 Today’s Jobs Relative to Pre-Recession Peak (2001) |
 CB Richard Ellis |
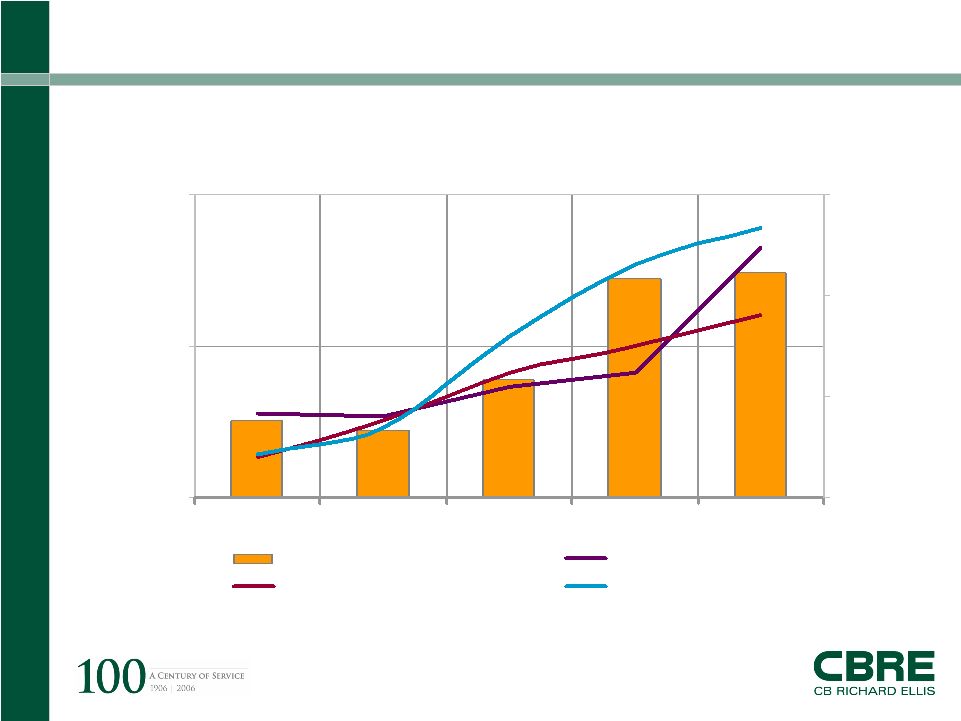
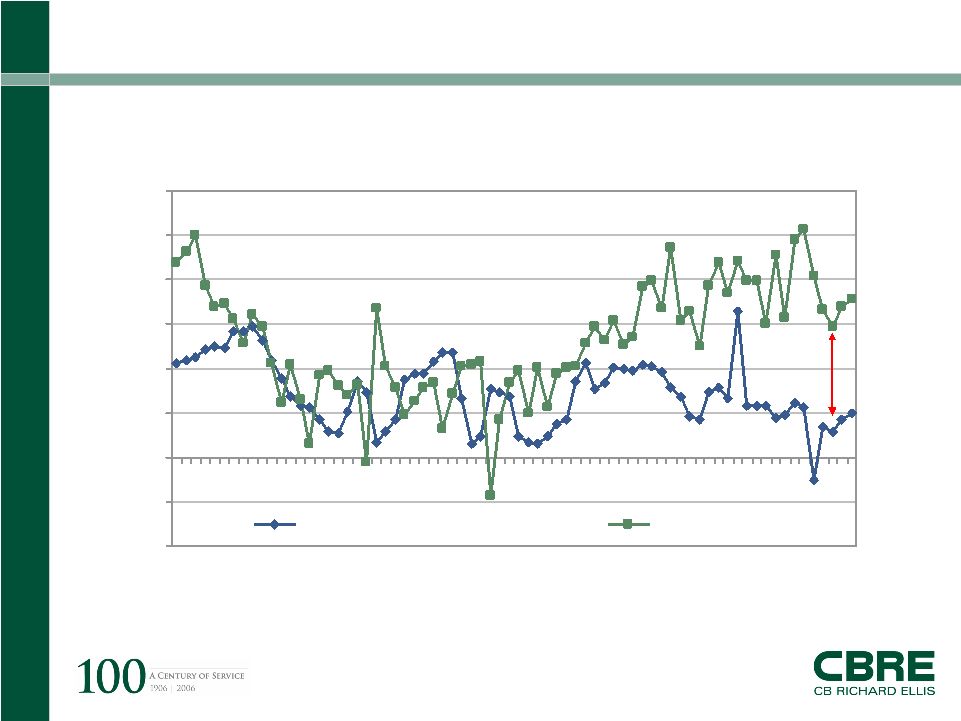
Page 11 Rates Rise and Here’s a Troubling Trend! 5.5 6.0 6.5 2005Q1 2005Q2 2005Q3 2005Q4 2006Q1 3.5 4.5 5.5 6.5 30-Year Mortgage ( L ) New homes Existing single-family Existing condominiums Months of supply on the market 30-Year Mortgage Rate, % Sources: BOC, FRB, NAR. |
 CB Richard Ellis |
Page 12 And, This is Going to Hurt, as Well! -4 -2 0 2 4 6 8 10 12 2000 2001 2002 2003 2004 2005 Disposable personal income Retail sales % change year ago |
 CB Richard Ellis |
Page 13 However…Fundamentals Are Improving for All Types Percentage Increase in Rents by Property Type Rents are a good performance measure because they reflect the balance between supply and demand. Source: TWR Outlook XL, Spring 06 11.0% 6.5% 8.0% Hotel 5.0% 4.0% 2.8% Retail 4.8% 3.6% 2.9% Industrial 13.5% 4.5% 5.2% Office 7.3% 3.2% 3.4% Multi-Housing Last High (2000) 2006F 2005 |
 CB Richard Ellis |
Page 14 TWR’s View: The Capital Markets |
 CB Richard Ellis |
Page 15 Why Real Estate? Why Now? There Are Still Opportunities in Real Estate for: • Cash Flow • Appreciation • Diversification • Alpha • Gamma Past Results Are Not Indicative of Future Performance! |
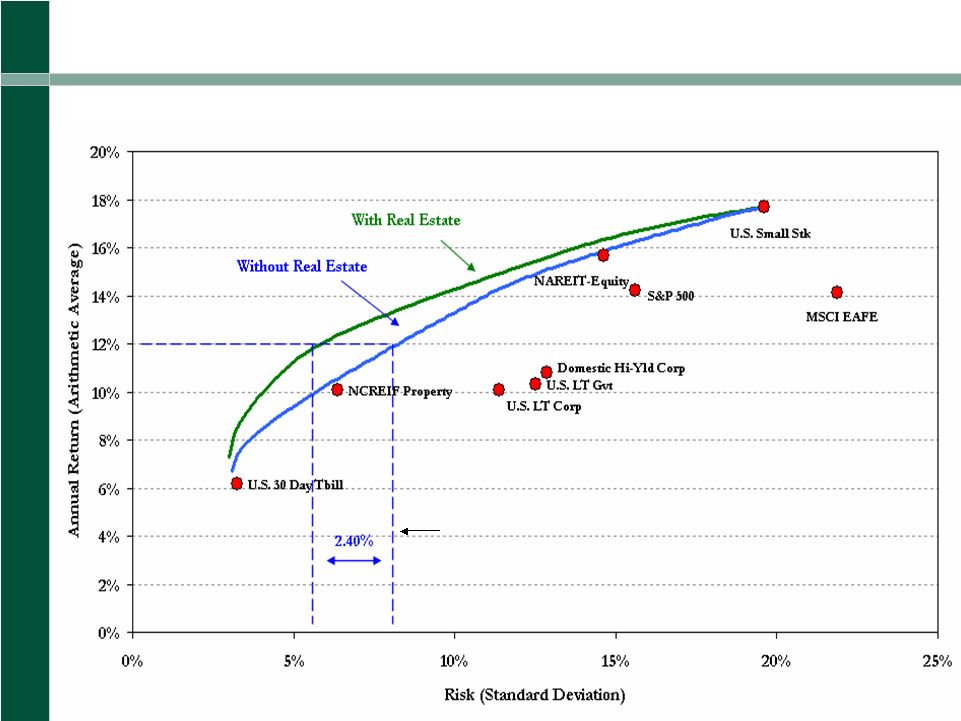 Efficient Frontiers
with and without Real Estate Selected Asset Classes for the Twentyeight-Year Period
1978–2005 2.40% Free Lunch Prior to the last three years the “free lunch” was 1.74% An Ilustration of “Free Lunch” |
 CB Richard Ellis |
Page 17 Cap Rate Composition Cap rate is composed of: • + Risk free rate • + Risk premium • + Cap X • - Expected appreciation |
 CB Richard Ellis |
Page 18 Rule of Thumb Appreciation = • % chg income - % chg in cap rate • Bottom line: fundamentals matter! |
 CB Richard Ellis |
Page 19 Pricing and Fundamentals |
 CB Richard Ellis |
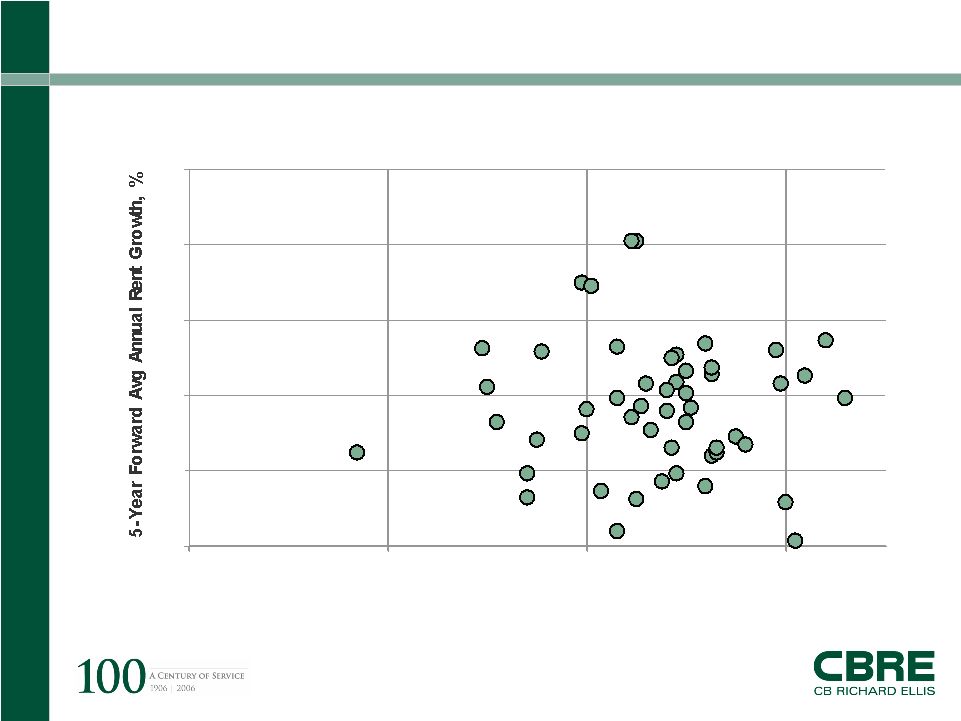
Page 20 0 2 4 6 8 10 3 5 7 9 2005 Transaction-Based Cap Rate, % A Pricing/Fundamentals Disconnect: An Example for the Office Sector Sources: RCA, TWR Investment Database BUY SELL |
 CB Richard Ellis |
Page 21 “Fooled by Randomness: the Hidden Role of Chance in Life and in the Markets” by Nassim N. Taleb Book’s Thesis: – It’s plain dumb luck, or randomness, not skills, hard work, etc, etc, Book’s Implication: – Forecast don’t work: Big events not known » e.g., 9/11. Long Term Capital, 1987 market crash » “Even a broken clock right twice a day” Book’s Shortcoming – If didn’t anticipate future, how can we function? – Role of econometrics: what is known vs. what is unexplained! |