
Business Review
Day
Corporate Overview
May 17, 2006
Brett White, President & Chief Executive Officer
Ken Kay, Senior Executive Vice President &
Chief Financial Officer
Exhibit 99.1
| Business Review
Day Corporate Overview May 17, 2006 Brett White, President & Chief Executive Officer Ken Kay, Senior Executive Vice President & Chief Financial Officer Exhibit 99.1 |
 CB Richard Ellis |
Page 2 CB Richard Ellis | Page 2 This presentation contains statements that are forward looking within the meaning of the Private Securities Litigation Reform Act of 1995, including statements regarding our growth momentum in 2006, future operations and future financial performance. These statements should be considered as estimates only and actual results may ultimately differ from these estimates. Except to the extent required by applicable securities laws, we undertake no obligation to update or publicly revise any of the forward-looking statements that you may hear today. Please refer to our current annual report on Form 10-K (in particular, “Item 1-A, Risk Factors”) and our current quarterly report on Form 10-
Q which are filed with the SEC and available at the SEC’s website (http://www.sec.gov), for a full discussion of the risks and other factors
that may impact any estimates that you may hear today. We may make certain statements during the course of this presentation which include references to “non-GAAP financial measures”, as defined by SEC regulations. As required by
these regulations, we have provided reconciliations of these measures to what we believe are the most directly comparable GAAP measures, which are attached hereto within the appendix. Forward Looking Statements |
 CB Richard Ellis |
Page 3 CB Richard Ellis | Page 3 Industry Overview |
 CB Richard Ellis |
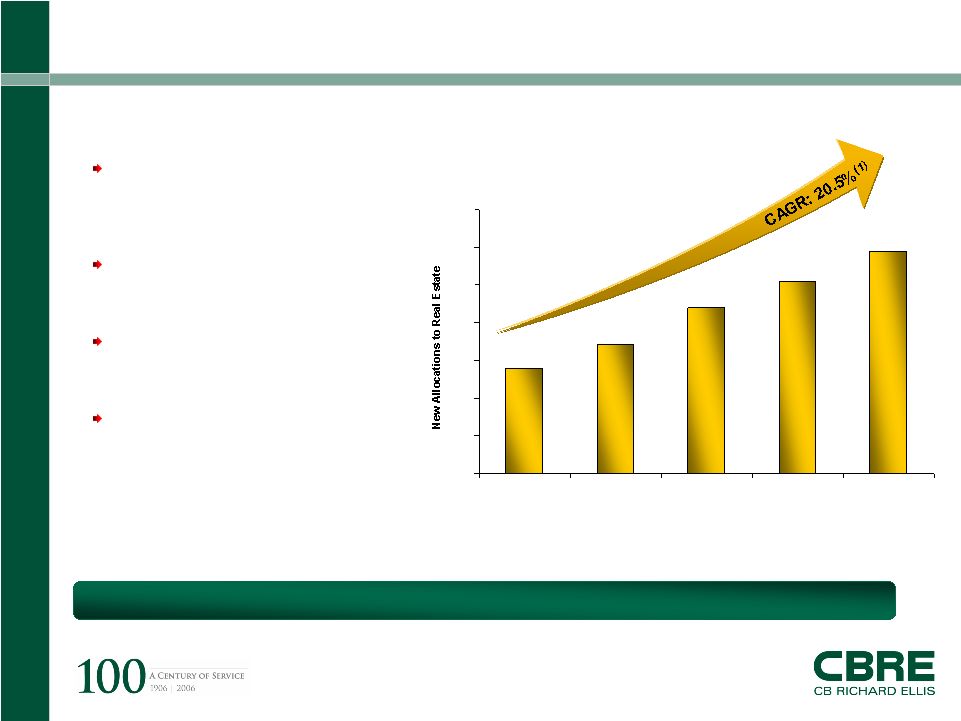
Page 4 CB Richard Ellis | Page 4 ($ in billions) Favorable Trends – Investment Sales $28 $34 $44 $51 $59 $0 $10 $20 $30 $40 $50 $60 $70 2002 2003 2004 2005 2006P 1) Source: Institutional Real Estate, Inc. 2006 Plan Sponsor Survey conducted by Kingsley
Associates 2) Source: Real Capital Analytics Expected capital flows to real estate continue to increase • Investment Sales Strong capital flows and improving property income continue to underpin a strong environment for investment sales Properties are being purchased with more equity capital, lower leverage and higher cash yield expectations Record levels of investment activity seen across Europe last year continued into the first quarter of 2006 Investment activity across Asia Pacific remains healthy |
 CB Richard Ellis |
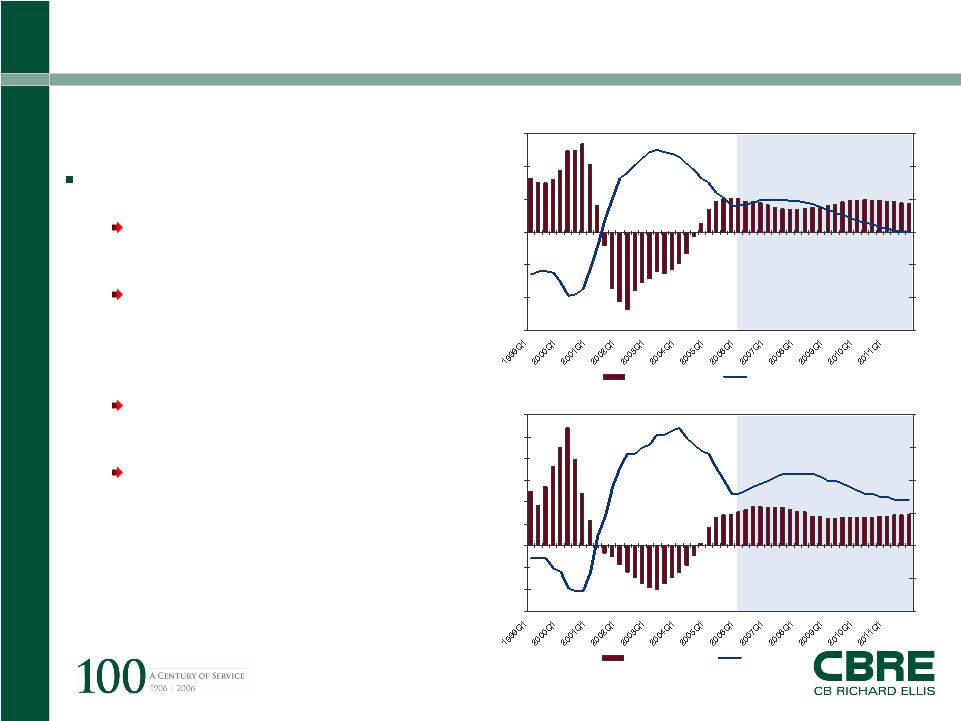
Page 5 CB Richard Ellis | Page 5 Leasing Markets Strong net absorption of U.S. commercial real estate Metropolitan areas dominated by trade linkages, tourism, technology and banking showed the strongest pace of improvement Recovery in office leasing is now evident across much of Europe In Asia, improving leasing market fundamentals support increased investor activity, especially foreign institutions, private funds and REITs Source: Torto Wheaton Research, Spring 2006 Forecast -6 -4 -2 0 2 4 6 8 10 12 6 7 8 9 10 11 12 TWR Rent Index Availability TWR Rent Index, % change year ago - Industrial Sector Availability rate, % Forecast -15 -10 -5 0 5 10 15 6 8 10 12 14 16 18 TWR Rent Index Vacancy TWR Rent Index, % change year ago - Office Sector Vacancy rate, % Favorable Trends – Leasing |
 CB Richard Ellis |
Page 6 CB Richard Ellis | Page 6 Company Overview |
 CB Richard Ellis |
Page 7 CB Richard Ellis | Page 7 2x 2x nearest competitor Thousands of clients, more than 70% of Fortune 100 Q1 2006 TTM Revenue of $3.1 billion Q1 2006 TTM Normalized EBITDA of $492.6 million (1) Strong organic revenue and earnings growth #1 #1 commercial real estate brokerage #1 #1 appraisal and valuation #1 #1 property and facilities management #2 #2 commercial mortgage brokerage $17.3 $17.3 billion in investment assets under management Leading Global Brand Leading Global Brand Broad Capabilities Broad Capabilities Scale, Diversity and Earnings Power Scale, Diversity and Earnings Power 100 100 years 50 50 countries #1 #1 in key cities in U.S., Europe and Asia (1) Excludes integration related charges. The World Class Commercial Real Estate Services Provider |
 CB Richard Ellis |
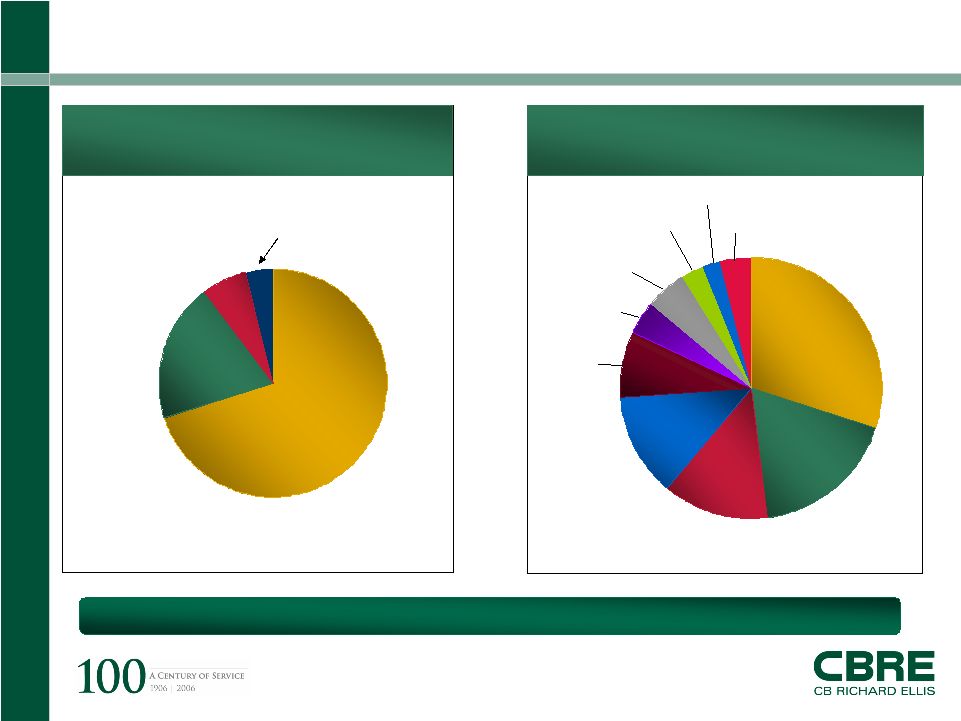
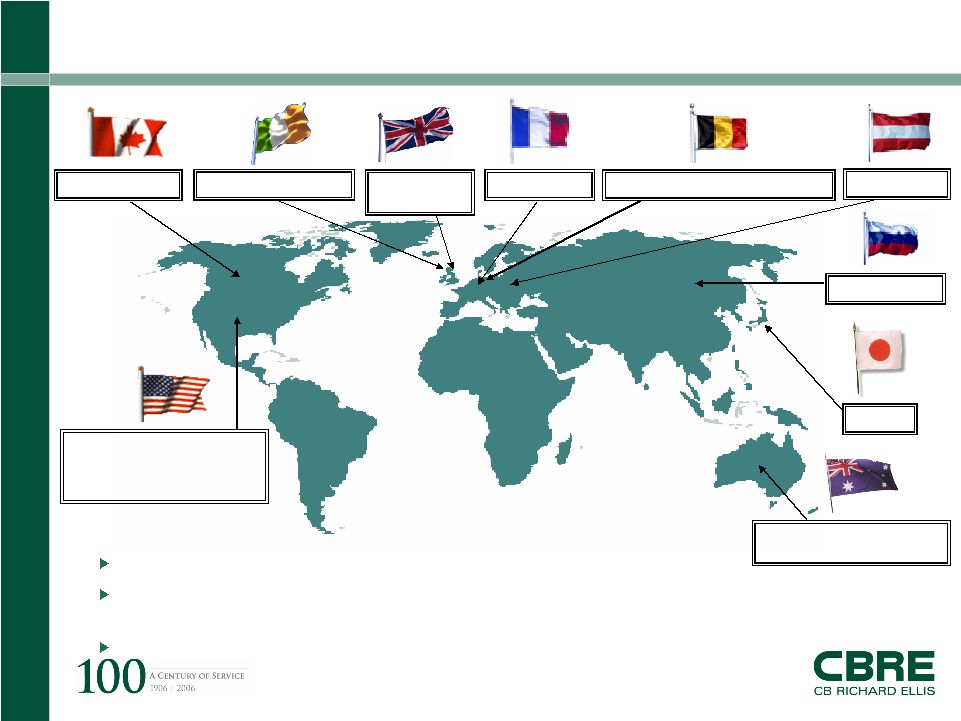
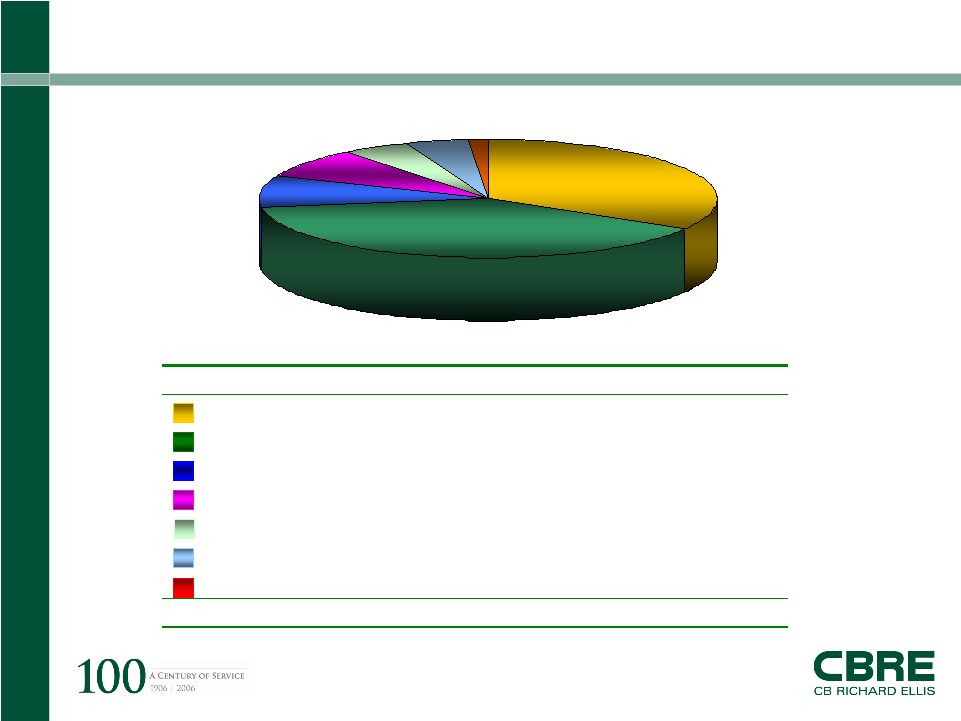
Page 8 CB Richard Ellis | Page 8 69% 21% EMEA Asia Pacific Americas Global Investment Management 6% 4% Global Reach & Diversified Client Base 4% 2% 3% 13% 8% 4% 5% 30% 18% 13% Individuals/ Partnerships 2005 Revenue by Client Type Corporate REITS Insurance Companies/ Banks Pension Funds Government Other Conduits/ Wall St. Firms Equity/ Opportunity Funds Offshore Investors 2005 Revenue by Region Top 20 customers are less than 9% of total revenue. |
 CB Richard Ellis |
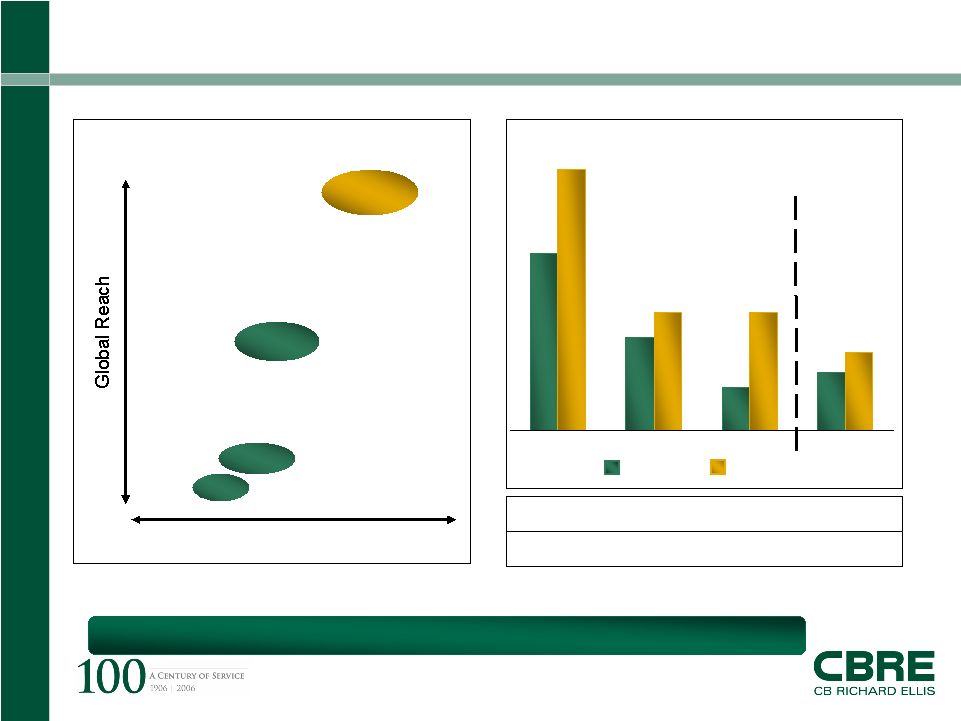
Page 9 CB Richard Ellis | Page 9 Our full-service, global platform has allowed us to outperform competitors. Competitive Landscape Services Platform CBRE JLL C&W TCC Q1 2003 TTM - Q1 2006 TTM CAGR 36% 19% 9% 12% 24% 24% 16% 53% (1) Excluding merger-related charges, integration expenses and IPO-related compensation
expense. (2) Average based on ABM, ACN, ADP, CEN, FDC, KELYA, MAN, PAYX, RHI, and RMK. TCC JLL CBRE (1) Revenue EBITDA Best In Class Business Services (2) CBG JLL TCC Business Services (2) FY06 P/E (as of 5/16/06) 21.3x 22.5x 19.3x 21.4x Superior Platform Drives Outperformance |
 CB Richard Ellis |
Page 10 CB Richard Ellis | Page 10 Key Growth Strategies |
 CB Richard Ellis |
Page 11 CB Richard Ellis | Page 11 Growth Drivers Growth Drivers INDUSTRY TRENDS RELATED STRATEGY Customer Relationship Management initiative Expanded “dash-board” for landlord/agency and tenant rep specialists Foster cross-market referrals and multi-market business development fundamentals Improving leasing Match risk/return profiles Develop innovative investment vehicles Grow assets under management Capitalize on “feet on the ground” global platform Institutional ownership of real estate Increased capital allocations to real estate Leverage demographic-driven investment trends and globalization of capital flows Leverage expertise across all property types Aggregate the fragmented private client market |
 CB Richard Ellis |
Page 12 CB Richard Ellis | Page 12 Growth Drivers (continued) Growth Drivers (continued) INDUSTRY TRENDS RELATED STRATEGY Corporate outsourcing Capitalize on cross-selling opportunities Leverage geographic diversity of platform Capitalize on breadth of service offerings Increased vendor consolidation Single point-of-contact management Emphasize multi-market/cross-border capabilities Focus on Fortune 500 penetration Invest in enabling IT platforms Capital markets solutions Single-brand and single-source debt and equity offerings Increase mortgage origination referrals from other CBRE businesses (up 56% in 2005) More joint debt-equity business development initiatives Continued industry consolidation Selective in-fill acquisitions to round out service-delivery platform Buy-in partner/affiliate companies |
 CB Richard Ellis |
Page 13 CB Richard Ellis | Page 13 CB Richard Ellis Gunne Easyburo SAS Austin Adams Dalgleish DTZ Queensland McCann Property and Planning Advocate Consulting Group, Inc. CB Richard Ellis Charlotte, LLC Columbus Commercial Realty Project Advantage, Inc. Rutter & Strutz Purchase price for these acquisitions was approximately $124 million Associated annual revenue estimated to be approximately $208 million, which includes consolidation of
revenue resulting from the now majority owned IKOMA and Noble Gibbons EBITDA margins expected to be consistent with CBRE margins upon full integration 2005 & 2006 In-Fill Acquisitions 2005 & 2006 In-Fill Acquisitions Groupe Axival, Inc. Immobiliere Developpement & Gestion Noble Gibbons IKOMA |
 CB Richard Ellis |
Page 14 CB Richard Ellis | Page 14 Financial Overview |
 CB Richard Ellis |
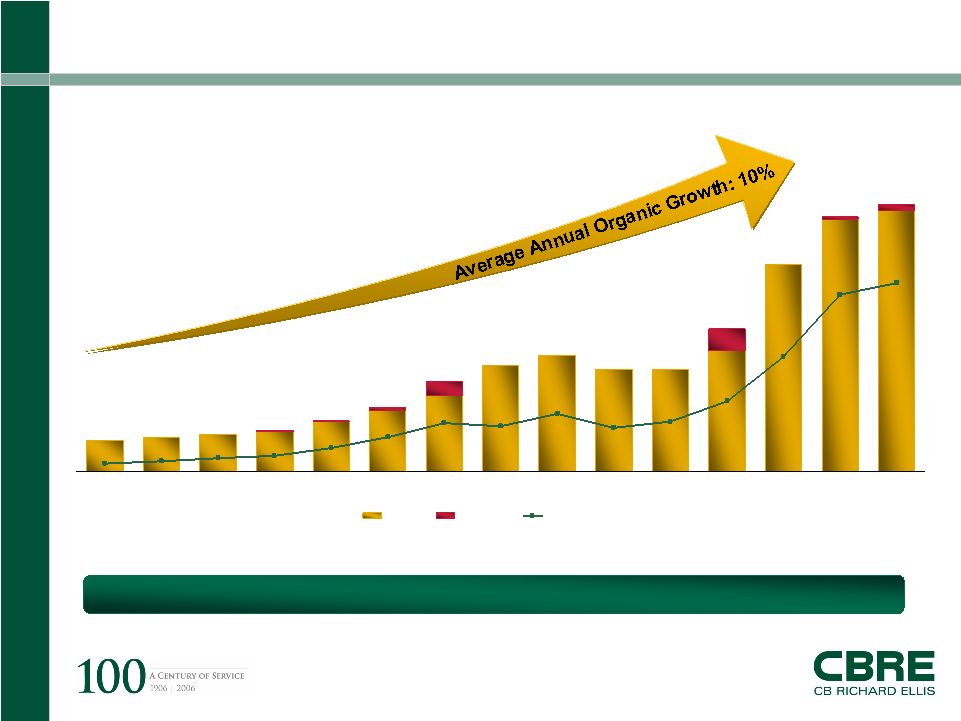
Page 15 CB Richard Ellis | Page 15 $117.4 $492.6 $183.2 $62.0 $41.5 $33.7 $25.9 $20.2 $127.2 $150.5 $115.0 $130.7 $300.3 $461.3 $90.1 Organic Acquisition Normalized EBITDA 1992 1993 1994 1995 1996 1997 1998 1999 2000 2001 2002 2003 TTM Q1 2006 $360 $429 $468 $583 $730 $1,035 $1,213 $1,324 $1,171 $1,170 $1,630 $2,365 $392 2004 $2,911 $3,052 2005 CBRE has consistently outpaced industry growth. (1) Normalized EBITDA excludes merger-related and other non-recurring costs, integration costs related
to acquisitions and one-time IPO-related compensation expense. ($ in millions)
Consistent Long Term Growth Consistent Long Term Growth (1) |
 CB Richard Ellis |
Page 16 CB Richard Ellis | Page 16 Q1 2005 Record Q1 2006 Performance Q1 2006 $538.3 $680.1 26% (In millions, except EPS) $52.7 $84.0 59% Revenue Normalized EBITDA¹ $19.0 $40.1 111% $0.25 $0.52 108% Net Income, as adjusted¹ EPS, as adjusted 1,2 1. Normalized EBITDA, net income, as adjusted and earnings per share, as adjusted exclude one-time items, including integration costs related to acquisitions and certain costs of extinguishment of debt. 2. Diluted earnings per share. Q1 2006 Business Performance Highlights Q1 2006 Business Performance Highlights |
 CB Richard Ellis |
Page 17 CB Richard Ellis | Page 17 34% 39% 9% 8% 5% 4% 1% ($ in millions) 2006 2005 % Change Sales 229.5 182.1 26 Leasing 265.4 205.5 29 Property and Facilities Management 59.4 50.2 18 Appraisal and Valuation 54.8 41.1 33 Investment Management 31.7 21.1 50 Commercial Mortgage Brokerage 30.6 31.1 (2) Other 8.7 7.2 21 Total 680.1 538.3 26 Q1 2006 Revenue Breakdown Q1 2006 Revenue Breakdown |
 CB Richard Ellis |
Page 18 CB Richard Ellis | Page 18 Notes: Normalized EBITDA margins exclude one-time merger-related and other non-recurring costs, integration costs related to acquisitions and one-time IPO-related compensation expense.
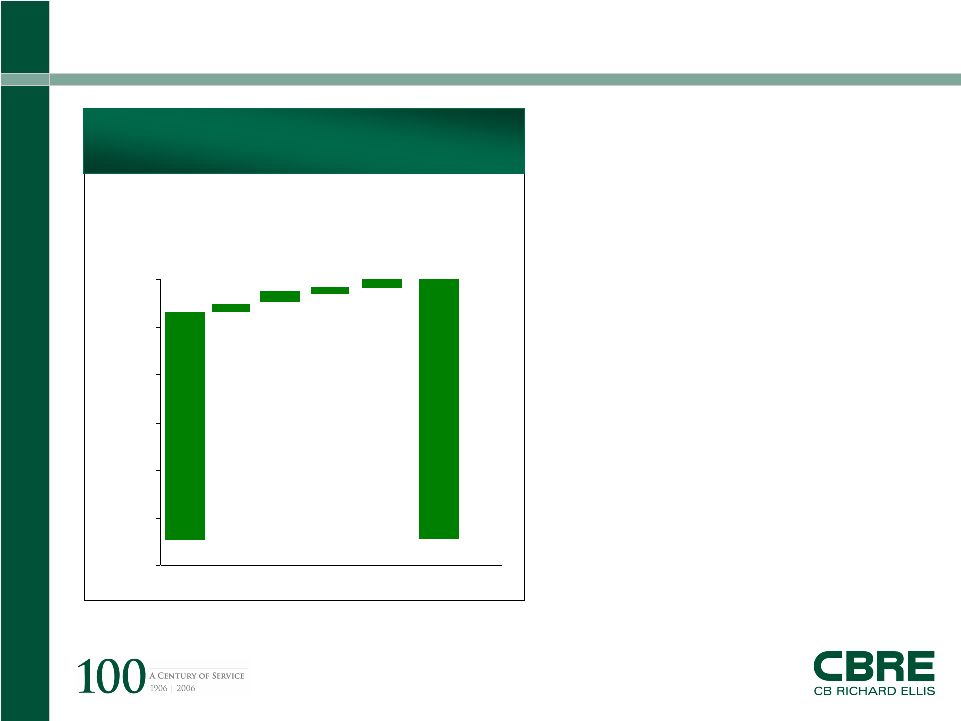
9.8% 11.2% 11.2% 12.7% 15.8% 16.1% 0.0% 5.0% 10.0% 15.0% 20.0% 2001 2002 2003 2004 2005 TTM Q1 2006 9.8% 11.2% 11.2% 12.7% 15.8% 16.1% 0.0% 5.0% 10.0% 15.0% 20.0% 2001 2002 2003 2004 2005 TTM Q1 2006 CBRE has consistently improved its EBITDA margin. Normalized EBITDA Margins Normalized EBITDA Margins |
 CB Richard Ellis |
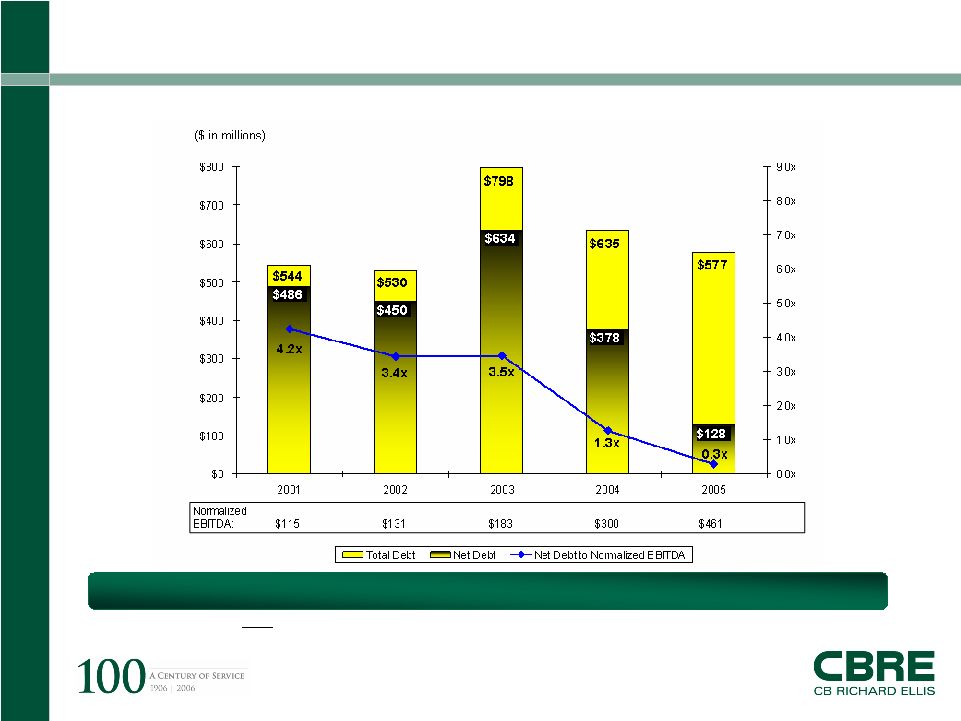
Page 19 CB Richard Ellis | Page 19 ($ in millions) Notes: - Normalized EBITDA excludes merger-related and other non-recurring costs,
Insignia integration costs and one-time IPO- related compensation
expense. - Total debt excludes non-recourse debt. Future debt reduction through redemption of $293 million of high coupon bonds Debt Highlights Debt Highlights |
 CB Richard Ellis |
Page 20 CB Richard Ellis | Page 20 1. Excludes $82.6 million and $256.0 million of warehouse facility at March 31, 2006 and December 31, 2005,
respectively. ($ in millions) 3/31/2006 12/31/2005 Variance Cash 253.1 449.3 (196.2) Senior secured term loan tranche B 262.3 265.2 (2.9) 11 1/4 % senior subordinated notes 163.1 163.0 0.1 9 3/4 % senior notes 130.0 130.0 - Other debt¹ 30.1 19.0 11.1 Total debt 585.5 577.2 8.3 Stockholders' equity 844.8 793.7 51.1 Total capitalization 1,430.3 1,370.9 59.4 Total net debt 332.4 127.9 204.5 As of Capitalization Capitalization |
 CB Richard Ellis |
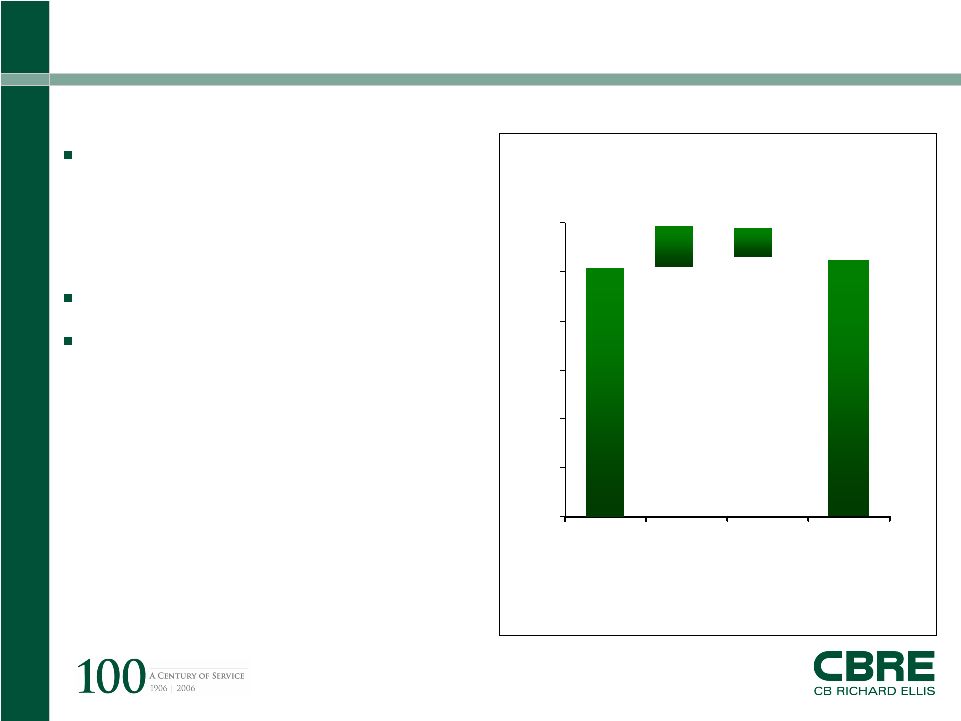
Page 21 CB Richard Ellis | Page 21 Strong cash flow generator • $99 million, or 63% improvement from same period last year Low capital intensity Utilization of internal cash flow • Debt reduction – full redemption of the 11¼% senior subordinated notes of $163 million scheduled for June 15, 2006 • Co-investment activities • In-fill acquisitions 1. Represents capital expenditures, net of concessions. - 50 100 150 200 250 300 ($ millions) 47 251 Net Income, as adjusted D&A Cap Ex (41) 257 1 Internal Cash Flow TTM Q1 2006 Normalized Internal Cash Flow TTM Q1 2006 Normalized Internal Cash Flow |
 CB Richard Ellis |
Page 22 CB Richard Ellis | Page 22 Appendix |
 CB Richard Ellis |
Page 23 CB Richard Ellis | Page 23 Trailing Twelve Months ($ in millions) Q1 2006 Q1 2005 Normalized EBITDA 492.6 327.6 Less: Merger-related charges related to the Insignia acquisition - 15.6 Integration costs related to acquisitions 5.9 11.6 One-time compensation expense related to the initial public offering - 15.0 EBITDA 486.7 285.4 Add: Interest income 10.4 5.5 Less: Depreciation and amortization 50.0 48.5 Interest expense 54.8 59.3 Loss on extinguishment of debt 2.5 26.0 Provision for income taxes 150.2 61.2 Net income 239.6 95.9 Revenue 3,052.5 2,462.4 Normalized EBITDA Margin 16.1% 13.3% Reconciliation of Normalized EBITDA to EBITDA to Net Income |
 CB Richard Ellis |
Page 24 CB Richard Ellis | Page 24 Year Ended December 31, ($ in millions) 2005 2004 2003 2002 2001 (1) Normalized EBITDA 461.3 300.3 183.2 130.7 115.0 Less: Merger-related and other non- recurring charges - 25.6 36.8 - 28.6 Integration costs related to the Insignia acquisition 7.1 14.4 13.6 - - IPO-related compensation expense - 15.0 - - - EBITDA 454.2 245.3 132.8 130.7 86.4 Add: Interest income 9.3 6.9 3.6 3.2 4.0 Less: Depreciation and amortization 45.5 54.8 92.6 24.6 37.9 Interest expense 54.4 68.1 71.3 60.5 50.0 Loss on extinguishment of debt 7.4 21.1 13.5 - - Provision (benefit) for income taxes 138.9 43.5 (6.3) 30.1 19.1 Net income (loss) 217.3 64.7 (34.7) 18.7 (16.6) Revenue 2,910.6 2,365.1 1,630.1 1,170.3 1,170.8 Normalized EBITDA Margin 15.8% 12.7% 11.2% 11.2% 9.8% (1) The results of operations for the year ended December 31, 2001 have been derived by combining the results of operations of the company for the period from February 20, 2001 (inception) to December 31, 2001, with the results of operations of CB Richard Ellis Services, Inc. prior to the
MBO merger of the two, from January 1, 2001 to July 20, 2001, the date of the merger. Reconciliation of Normalized EBITDA to EBITDA to Net Income (Loss) Reconciliation of Normalized EBITDA to EBITDA to Net Income (Loss) |
 CB Richard Ellis |
Page 25 CB Richard Ellis | Page 25 Three Months Ended March 31, ($ in millions) 2006 2005 Normalized EBITDA 84.0 52.7 Less: Integration costs related to acquisitions 1.3 2.5 EBITDA 82.7 50.2 Add: Interest income 3.6 2.5 Less: Depreciation and amortization 14.9 10.4 Interest expense 14.0 13.6 Loss on extinguishment of debt - 4.9 Provision for income taxes 20.5 9.2 Net income 36.9 14.6 Reconciliation of Normalized EBITDA to EBITDA to Net Income Reconciliation of Normalized EBITDA to EBITDA to Net Income |
 CB Richard Ellis |
Page 26 CB Richard Ellis | Page 26 ($ in millions, except share data) 2006 2005 Net income 36.9 14.6 Amortization expense related to net revenue backlog acquired in acquisitions, net of tax 2.3 - Integration costs related to acquisitions, net of tax 0.9 1.5 Loss on extinguishment of debt, net of tax - 2.9 Net income, as adjusted 40.1 19.0 Diluted income per share, as adjusted 0.52 $ 0.25 $ Weighted average shares outstanding for diluted income per share, as adjusted 77,649,588 76,184,725 Three Months Ended March 31, Reconciliation of Net Income to Net Income, As Adjusted Reconciliation of Net Income to Net Income, As Adjusted |
 CB Richard Ellis |
Page 27 CB Richard Ellis | Page 27 - 50 100 150 200 250 300 a) Amortization expense related to net revenue backlog acquired in acquisitions¹ b) Integration costs related to acquisitions¹ c) Costs of extinguishment of debt¹ d) Tax expense related to the repatriation of foreign earnings under the American Jobs Creation Act of 2004 Net Income, As Adjusted TTM 1st Quarter 2006 Results ($ millions) 240 251 2 4 Reported Net Income (a) (b) (c) 1. Net of tax. 2 3 (d) Reconciliation of Net Income to Net Income, As Adjusted Reconciliation of Net Income to Net Income, As Adjusted |