
Exhibit 99.2
Second Quarter 2005
Earnings Conference Call August 3, 2005
Forward Looking Statements
This presentation contains statements that are forward looking within the meaning of the Private Securities Litigation Reform Act of 1995. These statements should be considered as estimates only and actual results may ultimately differ from these estimates. Except to the extent required by applicable securities laws, CB Richard Ellis Group, Inc. undertakes no obligation to update or publicly revise any of the forward-looking statements that you may hear today. Please refer to our annual report on Form 10-K and our quarterly reports on Form 10-Q, which are filed with the SEC and available at the SEC’s website (http://www.sec.gov), for a full discussion of the risks and other factors, that may impact any estimates that you may hear today. We may make certain statements during the course of this presentation which include references to “non-GAAP financial measures,” as defined by SEC regulations. As required by these regulations, we have provided reconciliations of these measures to what we believe are the most directly comparable GAAP measures, which are attached hereto within the appendix.
1

Conference Call Participants
Brett White, President and Chief Executive Officer
Ken Kay, Senior Executive Vice President & Chief Financial Officer
Mike Strong, President, EMEA
Shelley Young, Director of Investor Relations
2
Q2 2005 Summary
Market dominance
Strong top and bottom line results
Industry profit/margin leadership
3
Q2 2005 Performance Highlights
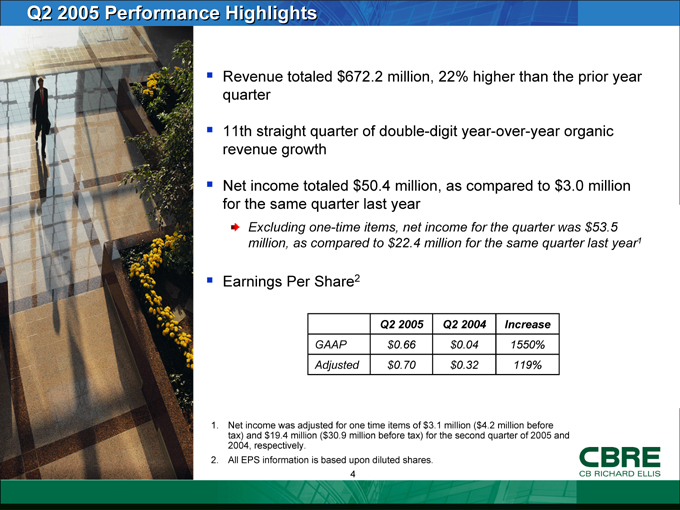
Revenue totaled $672.2 million, 22% higher than the prior year quarter
11th straight quarter of double-digit year-over-year organic revenue growth
Net income totaled $50.4 million, as compared to $3.0 million for the same quarter last year
Excluding one-time items, net income for the quarter was $53.5 million, as compared to $22.4 million for the same quarter last year1
Earnings Per Share2
Q2 2005 Q2 2004 Increase
GAAP $0.66 $0.04 1550%
Adjusted $0.70 $0.32 119%
1. Net income was adjusted for one time items of $3.1 million ($4.2 million before tax) and $19.4 million ($30.9 million before tax) for the second quarter of 2005 and 2004, respectively.
2. All EPS information is based upon diluted shares.
4
Q2 2005 Performance Highlights (continued)
Operating Income
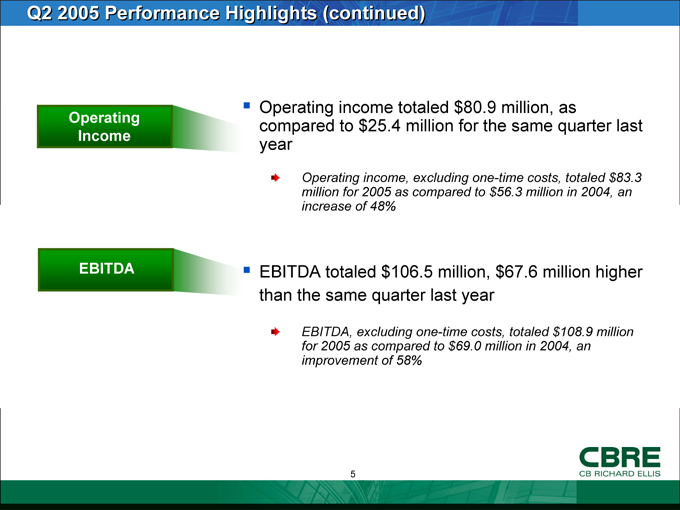
Operating income totaled $80.9 million, as compared to $25.4 million for the same quarter last year
Operating income, excluding one-time costs, totaled $83.3 million for 2005 as compared to $56.3 million in 2004, an increase of 48%
EBITDA
EBITDA totaled $106.5 million, $67.6 million higher than the same quarter last year
EBITDA, excluding one-time costs, totaled $108.9 million for 2005 as compared to $69.0 million in 2004, an improvement of 58%
5
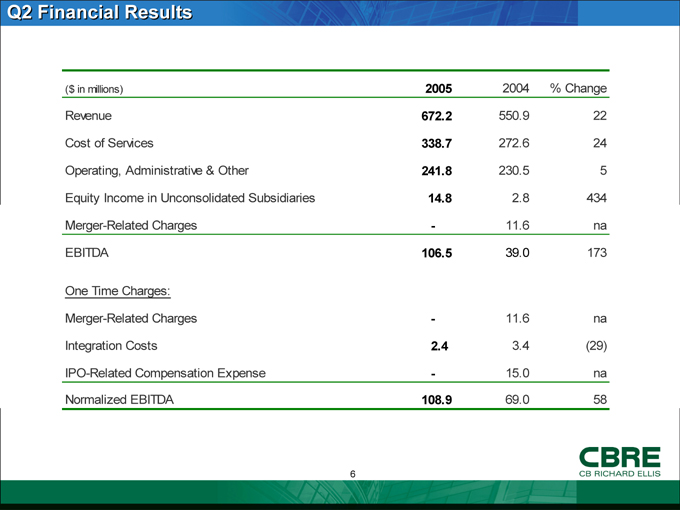
Q2 Financial Results
($ in millions) 2005 2004 % Change
Revenue 672.2 550.9 22
Cost of Services 338.7 272.6 24
Operating, Administrative & Other 241.8 230.5 5
Equity Income in Unconsolidated Subsidiaries 14.8 2.8 434
Merger-Related Charges - 11.6 na
EBITDA 106.5 39.0 173
One Time Charges:
Merger-Related Charges - 11.6 na
Integration Costs 2.4 3.4 (29)
IPO-Related Compensation Expense - 15.0 na
Normalized EBITDA 108.9 69.0 58
6
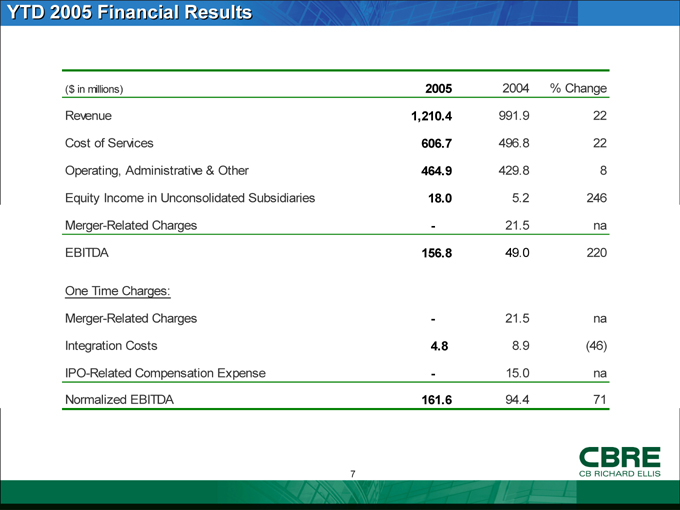
YTD 2005 Financial Results
($ in millions) 2005 2004 % Change
Revenue 1,210.4 991.9 22
Cost of Services 606.7 496.8 22
Operating, Administrative & Other 464.9 429.8 8
Equity Income in Unconsolidated Subsidiaries 18.0 5.2 246
Merger-Related Charges - 21.5 na
EBITDA 156.8 49.0 220
One Time Charges:
Merger-Related Charges - 21.5 na
Integration Costs 4.8 8.9 (46)
IPO-Related Compensation Expense - 15.0 na
Normalized EBITDA 161.6 94.4 71
7
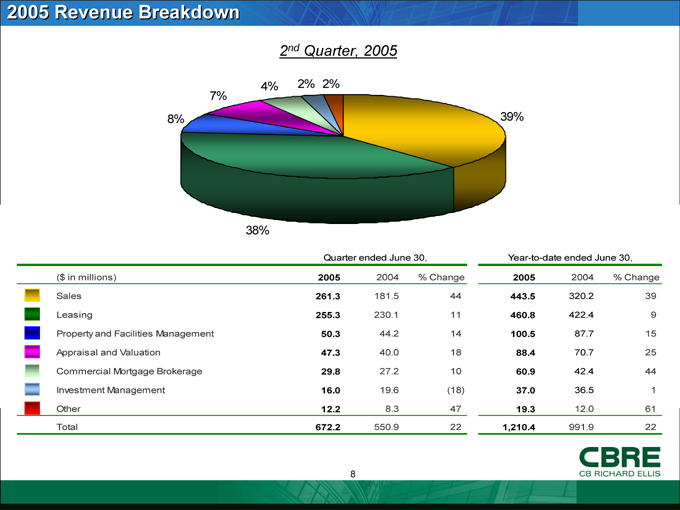
2005 Revenue Breakdown
2nd Quarter, 2005
8%
7%
4%
2%
2%
39%
38%
Quarter ended June 30, Year-to-date ended June 30,
($ in millions) 2005 2004 % Change 2005 2004 % Change
Sales 261.3 181.5 44 443.5 320.2 39
Leasing 255.3 230.1 11 460.8 422.4 9
Property and Facilities Management 50.3 44.2 14 100.5 87.7 15
Appraisal and Valuation 47.3 40.0 18 88.4 70.7 25
Commercial Mortgage Brokerage 29.8 27.2 10 60.9 42.4 44
Investment Management 16.0 19.6 (18) 37.0 36.5 1
Other 12.2 8.3 47 19.3 12.0 61
Total 672.2 550.9 22 1,210.4 991.9 22
8
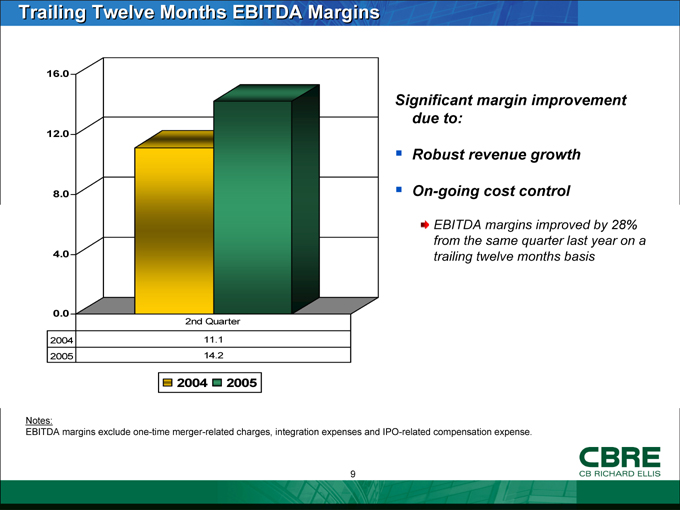
Trailing Twelve Months EBITDA Margins
16.0 . 12.0 . 8.0 . 4.0 . 0.0 .
2nd Quarter
2004 11.1 .
2005 14.2 .
2004
2005
Significant margin improvement due to:
Robust revenue growth
On-going cost control
EBITDA margins improved by 28% from the same quarter last year on a trailing twelve months basis
Notes:
EBITDA margins exclude one-time merger-related charges, integration expenses and IPO-related compensation expense.
9
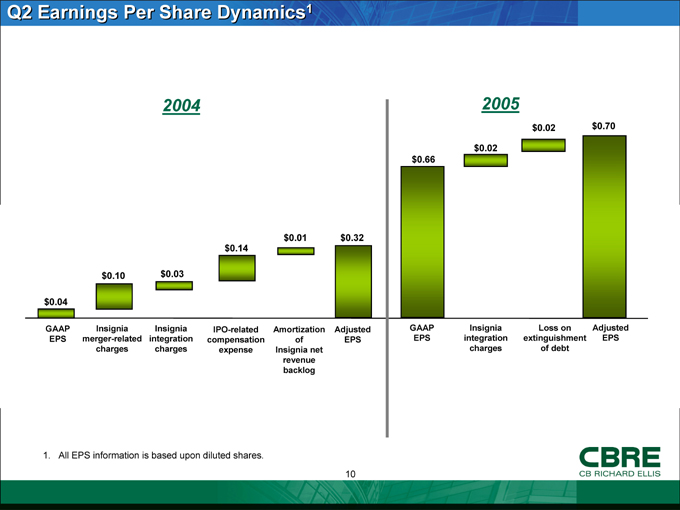
Q2 Earnings Per Share Dynamics1
2004 $0.04 $0.10 $0.03 $0.14 $0.01 $0.32
GAAP EPS
Insignia merger-related charges
Insignia integration charges
IPO-related compensation expense
Amortization of Insignia net revenue backlog
Adjusted EPS
2005 $0.66 $0.02 $0.02 $0.70
GAAP EPS
Insignia integration charges
Loss on extinguishment of debt
Adjusted EPS
1. All EPS information is based upon diluted shares.
10
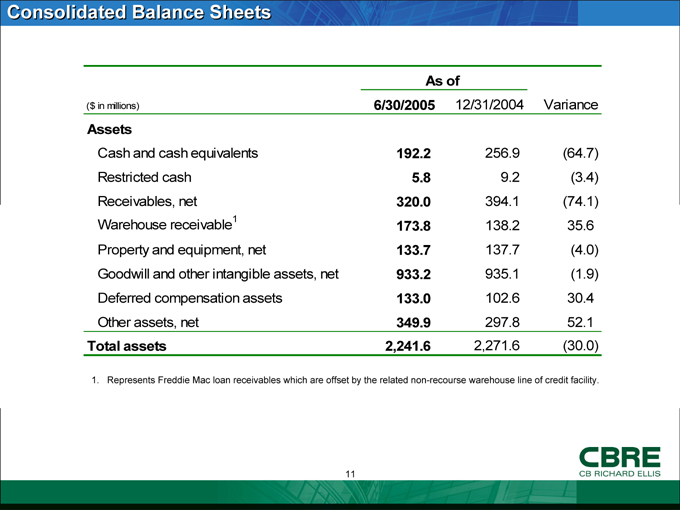
Consolidated Balance Sheets
As of
($ in millions) 6/30/2005 12/31/2004 Variance
Assets
Cash and cash equivalents 192.2 256.9 (64.7)
Restricted cash 5.8 9.2 (3.4)
Receivables, net 320.0 394.1 (74.1)
Warehouse receivable1 173.8 138.2 35.6
Property and equipment, net 133.7 137.7 (4.0)
Goodwill and other intangible assets, net 933.2 935.1 (1.9)
Deferred compensation assets 133.0 102.6 30.4
Other assets, net 349.9 297.8 52.1
Total assets 2,241.6 2,271.6 (30.0)
1. Represents Freddie Mac loan receivables which are offset by the related non-recourse warehouse line of credit facility.
11
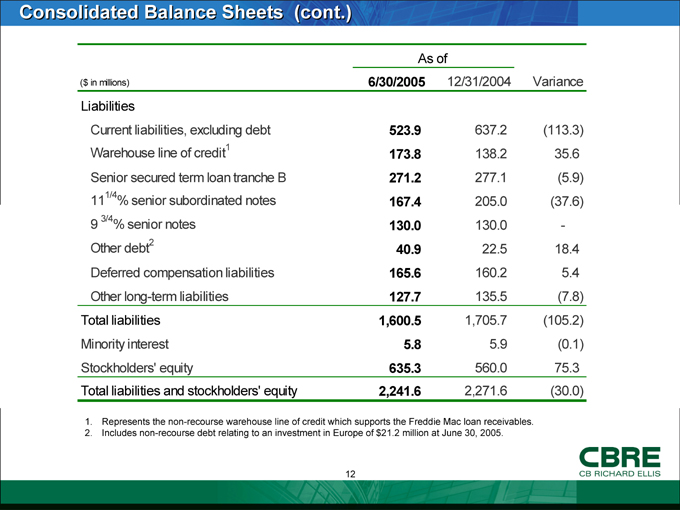
Consolidated Balance Sheets (cont.)
As of
($ in millions) 6/30/2005 12/31/2004 Variance
Liabilities
Current liabilities, excluding debt 523.9 637.2 (113.3)
Warehouse line of credit1 173.8 138.2 35.6
Senior secured term loan tranche B 271.2 277.1 (5.9)
111/4% senior subordinated notes 167.4 205.0 (37.6)
9 3/4% senior notes 130.0 130.0 -
Other debt2 40.9 22.5 18.4
Deferred compensation liabilities 165.6 160.2 5.4
Other long-term liabilities 127.7 135.5 (7.8)
Total liabilities 1,600.5 1,705.7 (105.2)
Minority interest 5.8 5.9 (0.1)
Stockholders’ equity 635.3 560.0 75.3
Total liabilities and stockholders’ equity 2,241.6 2,271.6 (30.0)
1. Represents the non-recourse warehouse line of credit which supports the Freddie Mac loan receivables.
2. Includes non-recourse debt relating to an investment in Europe of $21.2 million at June 30, 2005.
12
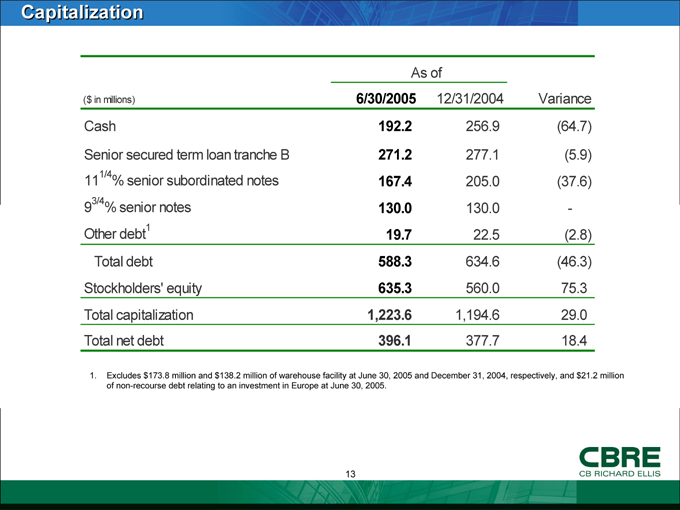
Capitalization
As of
($ in millions) 6/30/2005 12/31/2004 Variance
Cash 192.2 256.9 (64.7)
Senior secured term loan tranche B 271.2 277.1 (5.9)
111/4% senior subordinated notes 167.4 205.0 (37.6)
93/4% senior notes 130.0 130.0 -
Other debt1 19.7 22.5 (2.8)
Total debt 588.3 634.6 (46.3)
Stockholders’ equity 635.3 560.0 75.3
Total capitalization 1,223.6 1,194.6 29.0
Total net debt 396.1 377.7 18.4
1. Excludes $173.8 million and $138.2 million of warehouse facility at June 30, 2005 and December 31, 2004, respectively, and $21.2 million of non-recourse debt relating to an investment in Europe at June 30, 2005.
13
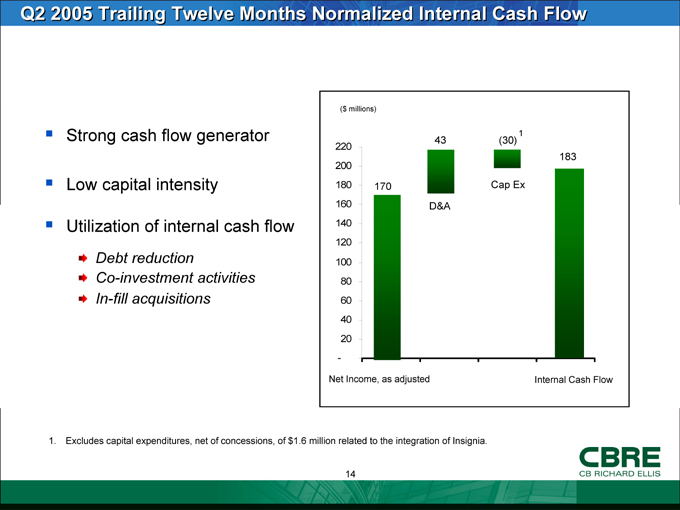
Q2 2005 Trailing Twelve Months Normalized Internal Cash Flow
Strong cash flow generator
Low capital intensity
Utilization of internal cash flow
Debt reduction
Co-investment activities In-fill acquisitions
($millions)
220 200 180 160 140 120 100 80 60 40 20 -
170
43
D&A
(30)1
Cap Ex
183
Net Income, as adjusted
Internal Cash Flow
1. Excludes capital expenditures, net of concessions, of $1.6 million related to the integration of Insignia.
14
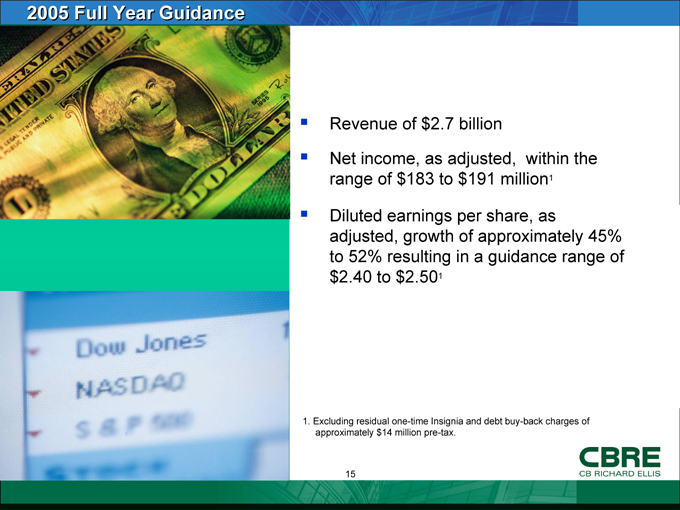
2005 Full Year Guidance
Revenue of $2.7 billion
Net income, as adjusted, within the range of $183 to $191 million1
Diluted earnings per share, as adjusted, growth of approximately 45% to 52% resulting in a guidance range of $2.40 to $2.501
1. Excluding residual one-time Insignia and debt buy-back charges of approximately $14 million pre-tax.
15
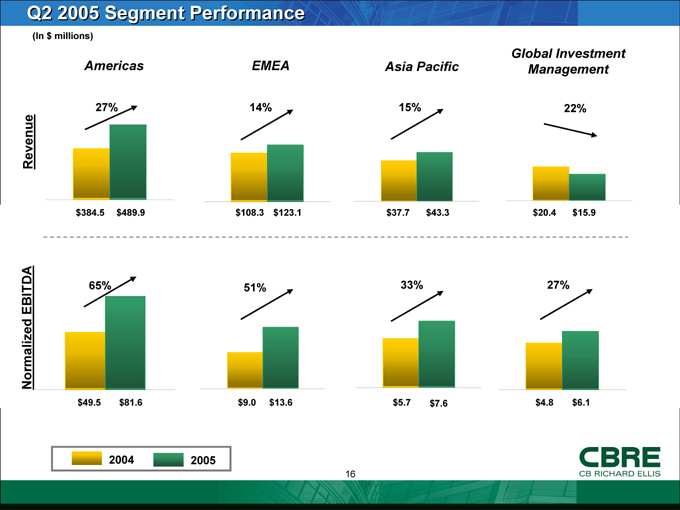
Q2 2005 Segment Performance
(In $ millions)
Revenue
Americas
27% $384.5 $489.9
EMEA
14% $108.3 $123.1
Asia Pacific
15% $37.7 $43.3
Global Investment Management
22% $20.4 $15.9
Normalized EBITDA
65% $49.5 $81.6
51% $9.0 $13.6
33% $5.7 $7.6
27% $4.8 $6.1
2004
2005
16
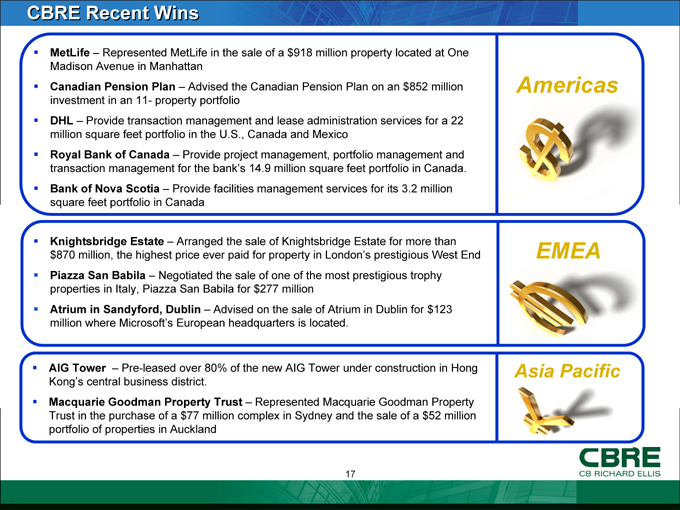
CBRE Recent Wins
MetLife – Represented MetLife in the sale of a $918 million property located at One Madison Avenue in Manhattan Canadian Pension Plan – Advised the Canadian Pension Plan on an $852 million investment in an 11- property portfolio DHL – Provide transaction management and lease administration services for a 22 million square feet portfolio in the U.S., Canada and Mexico Royal Bank of Canada – Provide project management, portfolio management and transaction management for the bank’s 14.9 million square feet portfolio in Canada. Bank of Nova Scotia – Provide facilities management services for its 3.2 million square feet portfolio in Canada
Americas
Knightsbridge Estate – Arranged the sale of Knightsbridge Estate for more than $870 million, the highest price ever paid for property in London’s prestigious West End Piazza San Babila – Negotiated the sale of one of the most prestigious trophy properties in Italy, Piazza San Babila for $277 million Atrium in Sandyford, Dublin – Advised on the sale of Atrium in Dublin for $123 million where Microsoft’s European headquarters is located.
EMEA
AIG Tower – Pre-leased over 80% of the new AIG Tower under construction in Hong Kong’s central business district.
Macquarie Goodman Property Trust – Represented Macquarie Goodman Property Trust in the purchase of a $77 million complex in Sydney and the sale of a $52 million portfolio of properties in Auckland
Asia Pacific
17
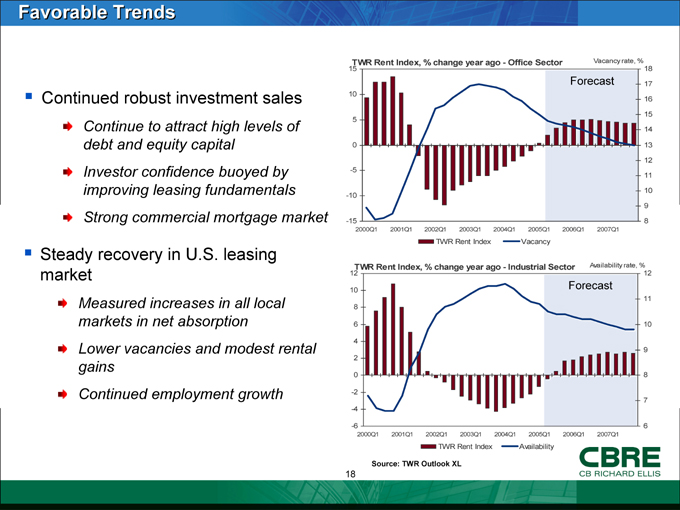
Favorable Trends
Continued robust investment sales
Continue to attract high levels of debt and equity capital Investor confidence buoyed by improving leasing fundamentals Strong commercial mortgage market
Steady recovery in U.S. leasing market
Measured increases in all local markets in net absorption Lower vacancies and modest rental gains Continued employment growth
TWR Rent Index, % change year ago - Office Sector
Vacancy rate, %
15 10 5 0 -5 -10 -15
2000Q1 2001Q1 2002Q1 2003Q1 2004Q1 2005Q1 2006Q1 2007Q1
Forecast
18 17 16 15 14 13 12 11 10 9 8
TWR Rent Index
Vacancy
TWR Rent Index, % change year ago - Industrial Sector
Availability rate, %
12 10 8 6 4 2 0 -2 -4 -6
2000Q1 2001Q1 2002Q1 2003Q1 2004Q1 2005Q1 2006Q1 2007Q1
Forecast
12 11 10 9 8 7 6
TWR Rent Index
Availability
Source: TWR Outlook XL
18
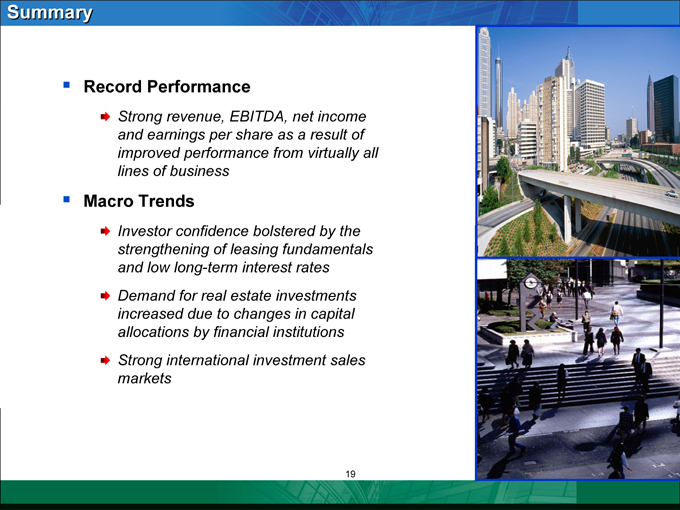
Summary
Record Performance
Strong revenue, EBITDA, net income and earnings per share as a result of improved performance from virtually all lines of business
Macro Trends
Investor confidence bolstered by the strengthening of leasing fundamentals and low long-term interest rates Demand for real estate investments increased due to changes in capital allocations by financial institutions Strong international investment sales markets
19
20
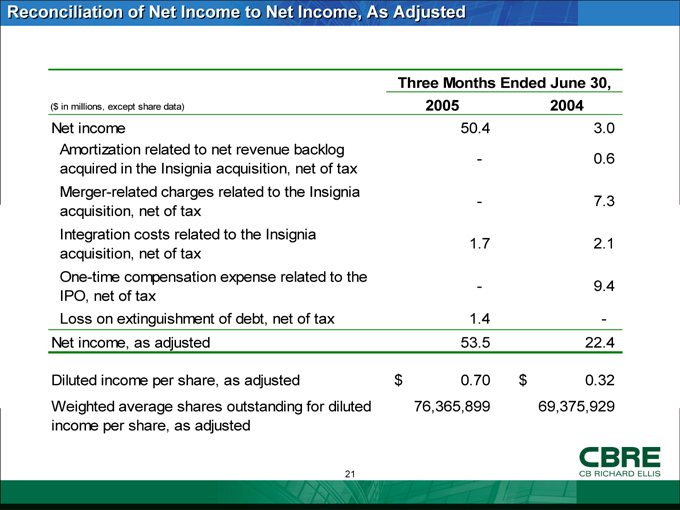
Reconciliation of Net Income to Net Income, As Adjusted
Three Months Ended June 30,
($ in millions, except share data) 2005 2004
Net income 50.4 3.0
Amortization related to net revenue backlog acquired in the Insignia acquisition, net of tax - 0.6
Merger-related charges related to the Insignia acquisition, net of tax - 7.3
Integration costs related to the Insignia acquisition, net of tax 1.7 2.1
One-time compensation expense related to the IPO, net of tax - 9.4
Loss on extinguishment of debt, net of tax 1.4 -
Net income, as adjusted 53.5 22.4
Diluted income per share, as adjusted $0.70 $0.32
Weighted average shares outstanding for diluted income per share, as adjusted 76,365,899 69,375,929
21
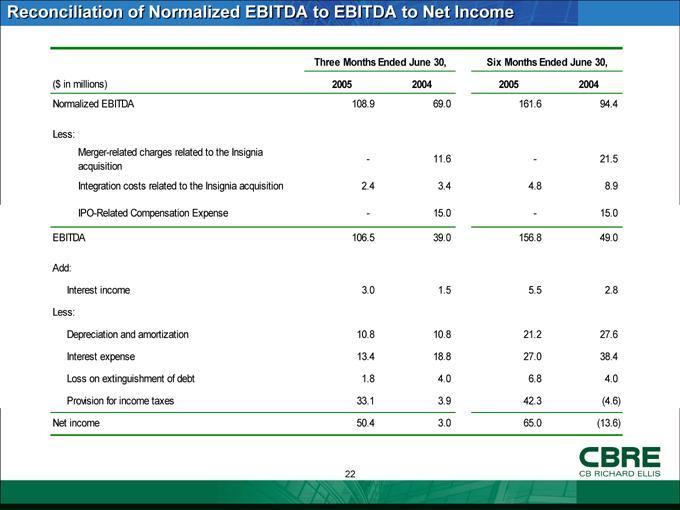
Reconciliation of Normalized EBITDA to EBITDA to Net Income
Three Months Ended June 30, Six Months Ended June 30,
($ in millions) 2005 2004 2005 2004
Normalized EBITDA 108.9 69.0 161.6 94.4
Less:
Merger-related charges related to the Insignia acquisition - 11.6 - 21.5
Integration costs related to the Insignia acquisition 2.4 3.4 4.8 8.9
IPO-Related Compensation Expense - 15.0 - 15.0
EBITDA 106.5 39.0 156.8 49.0
Add:
Interest income 3.0 1.5 5.5 2.8
Less:
Depreciation and amortization 10.8 10.8 21.2 27.6
Interest expense 13.4 18.8 27.0 38.4
Loss on extinguishment of debt 1.8 4.0 6.8 4.0
Provision for income taxes 33.1 3.9 42.3 (4.6)
Net income 50.4 3.0 65.0 (13.6)
22
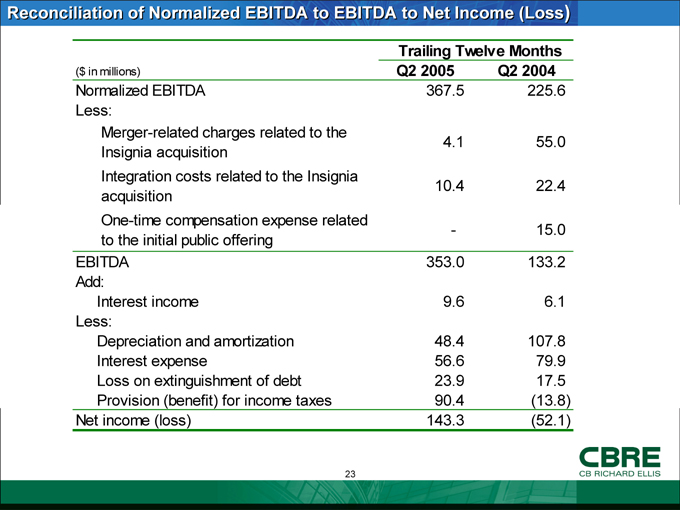
Reconciliation of Normalized EBITDA to EBITDA to Net Income (Loss)
Trailing Twelve Months
($ in millions) Q2 2005 Q2 2004
Normalized EBITDA 367.5 225.6
Less:
Merger-related charges related to the Insignia acquisition 4.1 55.0
Integration costs related to the Insignia acquisition 10.4 22.4
One-time compensation expense related to the initial public offering - 15.0
EBITDA 353.0 133.2
Add:
Interest income 9.6 6.1
Less:
Depreciation and amortization 48.4 107.8
Interest expense 56.6 79.9
Loss on extinguishment of debt 23.9 17.5
Provision (benefit) for income taxes 90.4 (13.8)
Net income (loss) 143.3 (52.1)
23
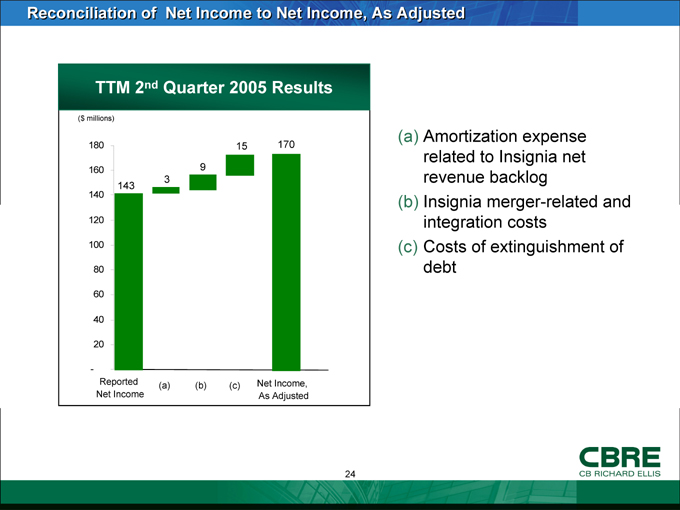
Reconciliation of Net Income to Net Income, As Adjusted
TTM 2nd Quarter 2005 Results
($ millions)
180 160 140 120 100 80 60 40 20 -
143
3
9
15
170
Reported Net Income
(a)
(b)
(c)
Net Income, As Adjusted
(a) Amortization expense related to Insignia net revenue backlog (b) Insignia merger-related and integration costs (c) Costs of extinguishment of debt
24
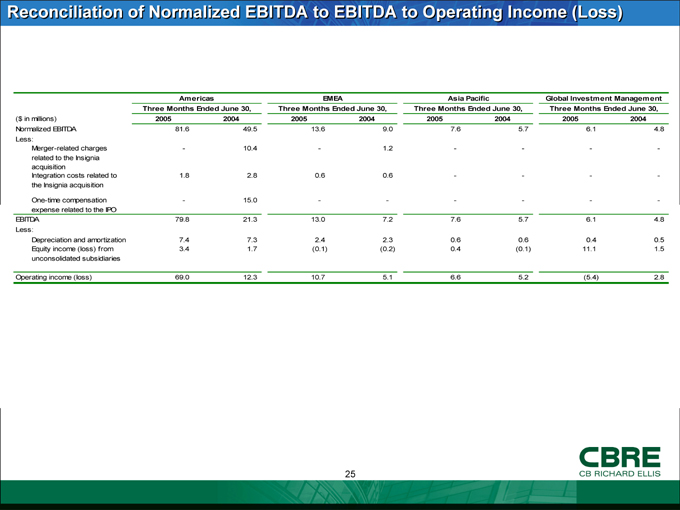
Reconciliation of Normalized EBITDA to EBITDA to Operating Income (Loss)
Americas EMEA Asia Pacific Global Investment Management
Three Months Ended June 30, Three Months Ended June 30, Three Months Ended June 30, Three Months Ended June 30,
($ in millions) 2005 2004 2005 2004 2005 2004 2005 2004
Normalized EBITDA 81.6 49.5 13.6 9.0 7.6 5.7 6.1 4.8
Less:
Merger-related charges related to the Insignia acquisition - 10.4 - 1.2 - - - -
Integration costs related to the Insignia acquisition 1.8 2.8 0.6 0.6 - - - -
One-time compensation expense related to the IPO - 15.0 - - - - - -
EBITDA 79.8 21.3 13.0 7.2 7.6 5.7 6.1 4.8
Less:
Depreciation and amortization 7.4 7.3 2.4 2.3 0.6 0.6 0.4 0.5
Equity income (loss) from 3.4 1.7 (0.1) (0.2) 0.4 (0.1) 11.1 1.5
unconsolidated subsidiaries
Operating income (loss) 69.0 12.3 10.7 5.1 6.6 5.2 (5.4) 2.8
25
26