Exhibit 99.2
|
|
CBRE GROUP, INC. Second Quarter 2014: Earnings Conference Call July 29, 2014 |

Exhibit 99.2
|
|
CBRE GROUP, INC. Second Quarter 2014: Earnings Conference Call July 29, 2014 |
|
|
This presentation contains statements that are forward looking within the meaning of the Private Securities Litigation Reform Act of 1995, including statements regarding our future growth momentum, operations, financial performance and business outlook. These statements should be considered as estimates only and actual results may ultimately differ from these estimates. Except to the extent required by applicable securities laws, we undertake no obligation to update or publicly revise any of the forward-looking statements that you may hear today. Please refer to our second quarter earnings report, filed on Form 8-K, our current annual report on Form 10-K and our most recent quarterly report on Form 10-Q, in particular any discussion of risk factors or forward-looking statements, which are filed with the SEC and available at the SEC’s website (www.sec.gov), for a full discussion of the risks and other factors that may impact any estimates that you may hear today. We may make certain statements during the course of this presentation, which include references to “non-GAAP financial measures,” as defined by SEC regulations. Where required by these regulations, we have provided reconciliations of these measures to what we believe are the most directly comparable GAAP measures, which are attached hereto within the appendix. FORWARD-LOOKING STATEMENTS |
|
|
CONFERENCE CALL PARTICIPANTS Bob Sulentic PRESIDENT AND CHIEF EXECUTIVE OFFICER Gil Borok DEPUTY CHIEF FINANCIAL OFFICER AND CHIEF ACCOUNTING OFFICER Jim Groch CHIEF FINANCIAL OFFICER AND GLOBAL DIRECTOR OF CORPORATE DEVELOPMENT Steve Iaco INVESTOR RELATIONS AND CORPORATE COMMUNICATIONS |
|
|
Q2 2014 Region Highlights BUSINESS OVERVIEW Americas EMEA Asia Pacific Revenue 11% (12% local currency) Revenue 89% (82% local currency) Ex. Norland Revenue 16% (9% local currency) Revenue 3% (9% local currency) |
|
|
Revenue ($ in millions) Contractual Revenue Sources Capital Markets Global Corporate Services and Asset Services2 Investment Management Appraisal & Valuation Leasing Sales Commercial Mortgage Services Development Services Other Total Q2 2014 $ 892.9 $ 126.3 $ 103.5 $ 559.3 $ 335.1 $ 78.6 $ 10.7 $ 20.4 $ 2,126.8 % of Q2 2014 Total 42% 6% 5% 26% 15% 4% 1% 1% 100% Q2 20131 $ 606.6 $ 115.9 $ 104.7 $ 492.5 $ 317.8 $ 83.0 $ 12.6 $ 13.9 $ 1,747.0 Growth Rate (Change Q2 2014-over-Q2 2013) USD 47% 9% -1% 14% 5% -5% -15% 47% 22% Local Currency 47% 6% -1% 14% 6% -5% -15% 41% 22% Q2 2014 BUSINESS LINE REVENUE 1. Includes revenue from discontinued operations. See slide 20 for details. 2. Global Corporate Services (GCS) and Asset Services revenue excludes all associated leasing and sales revenue, most of which is contractual. 79% of total revenue Contractual revenue plus leasing, which is largely recurring, is 79% of total revenue |
|
|
Q2 2014 PERFORMANCE OVERVIEW Includes discontinued operations. See slide 20 for details. Normalized EBITDA excludes certain carried interest incentive compensation expense. Adjusted net income and adjusted EPS exclude amortization expense related to certain intangible assets attributable to acquisitions, certain carried interest incentive compensation expense and the write-off of financing costs. All EPS information is based upon diluted shares. Based on adjusted results. Revenue EBITDA Normalized EBITDA2 Net Income3 EPS3,4 Q2 2014 $ 2,126.8 M $ 260.2 M $ 262.8 M GAAP $ 105.5 M Adjusted $ 118.7 M GAAP $ 0.32 Adjusted $ 0.36 Q2 20131 $ 1,747.0 M $ 240.5 M $ 243.1 M GAAP $69.9 M Adjusted $ 101.8 M GAAP $ 0.21 Adjusted $ 0.31 Change from Q2 2013 22% 8% 8% 17%5 16%5 |
|
|
($ in millions) Global Corporate Services and Asset Services1 Leasing Sales Q2 2014 $ 490.2 $ 405.8 $ 214.3 USD2 13% 18% 3% Local Currency2 14% 19% 4% YTD Q2 2014 $ 954.4 $ 684.2 $ 373.4 USD3 11% 15% 9% Local Currency3 12% 15% 10% 1. Global Corporate Services (GCS) and Asset Services revenue excludes all associated leasing and sales revenue, most of which is contractual. 2. Growth rate for Q2 2014 versus Q2 2013. 3. Growth rate for YTD Q2 2014 versus YTD Q2 2013. AMERICAS REVENUE: MAJOR COMPONENTS Total Q2 2014 revenue up 11% in USD or 12% in local currency |
|
|
($ in millions) Global Corporate Services and Asset Services1 Leasing Sales Q2 2014 $ 322.1 $ 125.8 ex. Norland $ 83.3 $ 62.3 USD2 226% 27% ex. Norland 1% 22% Local Currency2 218% 20% ex. Norland -5% 14% YTD Q2 2014 $ 653.3 $ 240.1 ex. Norland $ 163.6 $ 126.4 USD3 249% 28% ex. Norland 8% 39% Local Currency3 243% 22% ex. Norland 2% 32% EMEA REVENUE: MAJOR COMPONENTS Total Q2 2014 revenue up 89% in USD or 82% in local currency 1. Global Corporate Services (GCS) and Asset Services revenue excludes all associated leasing and sales revenue, most of which is contractual. 2. Growth rate for Q2 2014 versus Q2 2013. 3. Growth rate for YTD Q2 2014 versus YTD Q2 2013. |
|
|
($ in millions) Global Corporate Services and Asset Services1 Leasing Sales Q2 2014 $ 79.0 $ 69.9 $ 58.5 USD2 6% 5% 0% Local Currency2 12% 9% 6% YTD Q2 2014 $ 151.1 $ 122.3 $ 102.5 USD3 4% 5% 10% Local Currency3 12% 10% 18% ASIA PACIFIC REVENUE: MAJOR COMPONENTS Total Q2 2014 revenue up 3% in USD or 9% in local currency 1. Global Corporate Services (GCS) and Asset Services revenue excludes all associated leasing and sales revenue, most of which is contractual. 2. Growth rate for Q2 2014 versus Q2 2013. 3. Growth rate for YTD Q2 2014 versus YTD Q2 2013. |
|
|
Q2 YTD Q2 New 19 44 Expansions 15 39 Renewals 13 27 GLOBAL CORPORATE SERVICES 32 total contracts in EMEA and Asia Pacific YTD Q2 2014 8 total contracts in U.S. healthcare sector YTD Q2 2014 Norland materially strengthens European platform 2014 TOTAL CONTRACTS Facilities Management Transaction Services Project Management HIGHLIGHTS |
|
|
YTD Q2 Q2 GLOBAL INVESTMENT MANAGEMENT Excludes securities business. Normalized EBITDA excludes certain carried interest compensation expense. Includes discontinued operations. See slide 20 for details. In 2011, CBRE acquired the real estate investment management operations of ING Group in Europe, Asia and its global securities business. As of June 30, 2014. YTD Q2 4 CAPITAL RAISED1 ASSETS UNDER MANAGEMENT (AUM) ($ in billions) ($ in billions) FINANCIAL RESULTS Revenue Normalized EBITDA2 Rental Carried Interest Asset Management Acquisition, Disposition & Incentive Capital to deploy: $6.6 billion5 Co-Investment: $167.2 million5 3 3 ($ in millions) 3 3 |
|
|
YTD Q2 Q2 DEVELOPMENT SERVICES 1 $96.0 million of co-investments at the end of Q2 2014 $13.0 million in recourse debt to CBRE and repayment guarantees at the end of Q2 2014 1. In Process figures include Long-Term Operating Assets (LTOA) of $0.3 billion for 2Q 14, $0.9 billion for 4Q 13, $1.2 billion for 4Q 12, $1.5 billion for 4Q 11, $1.6 billion for 4Q 10, and $1.4 billion for 4Q 09. LTOA are projects that have achieved a stabilized level of occupancy or have been held 18-24 months following shell completion or acquisition. 2. Includes discontinued operations. See slide 20 for details. 3. Pro-forma revenue includes gains on sales of assets and equity in unconsolidated subsidiaries net of non-controlling interest. Revenue Pro-forma Revenue3 2 2 FINANCIAL RESULTS PROJECTS IN PROCESS/PIPELINE ($ in billions) 2 2 Revenue Normalized EBITDA ($ in millions) |
|
|
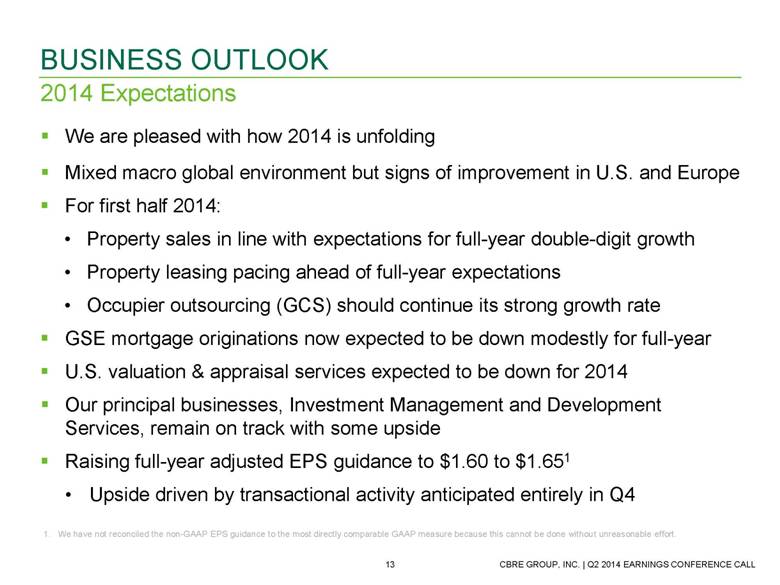
We are pleased with how 2014 is unfolding Mixed macro global environment but signs of improvement in U.S. and Europe For first half 2014: Property sales in line with expectations for full-year double-digit growth Property leasing pacing ahead of full-year expectations Occupier outsourcing (GCS) should continue its strong growth rate GSE mortgage originations now expected to be down modestly for full-year U.S. valuation & appraisal services expected to be down for 2014 Our principal businesses, Investment Management and Development Services, remain on track with some upside Raising full-year adjusted EPS guidance to $1.60 to $1.651 Upside driven by transactional activity anticipated entirely in Q4 2014 Expectations BUSINESS OUTLOOK We have not reconciled the non-GAAP EPS guidance to the most directly comparable GAAP measure because this cannot be done without unreasonable effort. |
|
|
SUPPLEMENTAL SLIDES AND GAAP RECONCILIATION TABLES |
|
|
U.S. VACANCY U.S. ABSORPTION TRENDS (in MSF) 2Q13 2Q14 4Q14 F 4Q15F 2Q13 2Q14 2013 2014F 2015F Office 15.2% 14.5% 14.4% 14.0% 10.0 15.4 36.7 36.8 35.5 Industrial 12.0% 10.8% 10.7% 10.4% 48.7 52.1 237.7 172.9 141.3 Retail 12.2% 11.7% 10.9% 9.8% 9.7 7.5 27.7 38.3 50.9 U.S. MARKET STATISTICS Source: CBRE Econometric Advisors (EA) Outlooks 2Q 2014 preliminary |
|
|
As of June 30, 2014 MANDATORY AMORTIZATION AND MATURITY SCHEDULE ($ in millions) $1,200.0 million revolver facility matures in March 2018. As of June 30, 2014, the outstanding revolver balance was 1. $336.0 million. 1 Global Cash Available Revolver 1,187 20 40 68 255 416 2 352 198 800 - 250.0 500.0 750.0 1,000.0 1,250.0 1,500.0 Q2 2014 2014 2015 2016 2017 2018 2019 2020 2021 2022 2023 Current Liquidity Term Loan A Term Loan B Revolver Sr. Unsecured Notes - 6.625% Sr. Unsecured Notes - 5.00% |
|
|
CAPITALIZATION 1. Excludes $47.2 million of cash in consolidated funds and other entities not available for Company use at June 30, 2014. 2. Represents notes payable on real estate in Development Services that are recourse to the Company. Excludes non-recourse notes payable on real estate of $85.8 million at June 30, 2014. 3. Excludes $731.5 million of aggregate warehouse facilities outstanding at June 30, 2014. 4. Calculation includes EBITDA from discontinued operations. See slide 20 for details. Cash 1 $ 334.7 Revolving credit facility 336.0 Senior secured term loan A 453.1 Senior secured term loan B 212.3 Senior unsecured notes 5.0% 800.0 Senior unsecured notes 6.625% 350.0 Notes payable on real estate 2 4.0 Other debt 3 10.7 Total debt $ 2,166.1 Stockholders’ equity 2,132.8 Total capitalization 4,298.9 Total net debt $ 1,831.4 Net debt to TTM Normalized EBITDA 4 1.70x As of June 30, 2014 ($ in millions) |
|
|
Three Months Ended June 30, ($ in millions) 2014 20131 Normalized EBITDA $ 262.8 $ 243.1 Adjustments: Carried interest incentive compensation 2 2.6 2.6 EBITDA 260.2 240.5 Add: Interest Income 1.1 1.5 Less: Depreciation and amortization 63.2 44.2 Interest expense 28.5 38.9 Write-off of financing costs - 42.7 Provision for income taxes 64.1 46.3 Net Income attributable to CBRE Group, Inc. $ 105.5 $ 69.9 RECONCILIATION OF NORMALIZED EBITDA TO EBITDA TO NET INCOME 1. Includes discontinued operations. See slide 20 for details. 2. Carried interest incentive compensation is related to funds that began recording carried interest expense for the first time in Q2 2013 and beyond. |
|
|
Three Months Ended June 30, ($ in millions) 2014 2013 Net income attributable to CBRE Group, Inc. $ 105.5 $ 69.9 Amortization expense related to certain intangible assets attributable to acquisitions, net of tax 11.7 4.6 Carried interest incentive compensation, net of tax 1 1.5 1.6 Write-off of financing costs, net of tax - 25.7 Net income attributable to CBRE Group, Inc., as adjusted $ 118.7 $ 101.8 Diluted income per share attributable to CBRE Group, Inc., as adjusted $ 0.36 $ 0.31 Weighted average shares outstanding for diluted income per share 333,918,620 331,631,185 1. Carried interest incentive compensation is related to funds that began recording carried interest expense in Q2 2013 and beyond. RECONCILIATION OF NET INCOME TO NET INCOME, AS ADJUSTED |
|
|
Discontinued Operations for the Three Months Ended June 30, 2013 Discontinued Operations for the Six Months Ended June 30, 2013 ($ in millions) Global Investment Management Development Services Total Global Investment Management Development Services Total Revenue $ 0.8 $ 4.1 $ 4.9 $ 1.5 $ 7.4 $ 8.9 EBITDA1 $ 0.8 $ 2.2 $ 3.0 $ 1.4 $ 6.0 $ 7.4 Less: Depreciation & amortization 0.4 0.2 0.6 0.5 0.4 0.9 Interest expense 0.5 0.9 1.4 1.0 2.2 3.2 Provision for income taxes - 0.4 0.4 - 1.3 1.3 Net (loss) income attributable to CBRE Group, Inc. $ (0.1) $ 0.7 $ 0.6 $ (0.1) $ 2.1 $ 2.0 RECONCILIATION OF DISCONTINUED OPERATIONS 1. There are no selected charges attributable to discontinued operations. |