Exhibit 99.2
|
|
The Global Economy and Real Estate Markets Raymond Torto Global Chief Economist Asieh Mansour Head of Americas Research December 6, 2012 |

Exhibit 99.2
|
|
The Global Economy and Real Estate Markets Raymond Torto Global Chief Economist Asieh Mansour Head of Americas Research December 6, 2012 |
|
|
Global Outlook: Still Growing Despite Europe Source: IHS Global Insight, October 2012 Real GDP, Quarter-on-Quarter % Change Annual % Change Forecast |
|
|
U.S. Outlook: Consumers More Upbeat than Business Composition of the US Economy Annual % Change Source: IHS Global Insight, October 2012 Net exports lowered U.S. GDP by $408 billion in 2011 (3%) |
|
|
Note: Annual results based on local currency composite Source: IPD, KTI Regional Property Performance, 2011 % per annum IPD Global Index 9.8% |
|
|
U.S. Property Performance NAREIT Equity REIT Index NCREIF Property Index Barclays Capital Govt Bond Standard & Poors 500 Index Consumer Price Index 90-day T-Bills Source: NCREIF, Q3 2012 (Annualized Returns) 1 2 3 4 5 6 |
|
|
CBRE Global Office Capital Value Index Source: CBRE Research, Q3 2012 Q3 2012 50 70 90 110 130 150 170 190 210 230 Global Americas Asia Pacific EMEA |
|
|
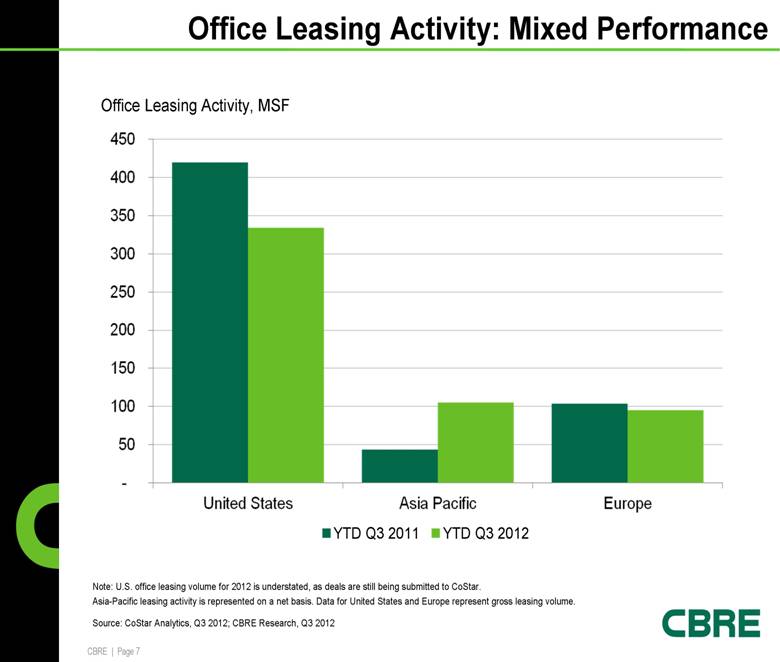
Office Leasing Activity, MSF Office Leasing Activity: Mixed Performance Source: CoStar Analytics, Q3 2012; CBRE Research, Q3 2012 Note: U.S. office leasing volume for 2012 is understated, as deals are still being submitted to CoStar. Asia-Pacific leasing activity is represented on a net basis. Data for United States and Europe represent gross leasing volume. YTD Q3 2011 YTD Q3 2012 |
|
|
Global Vacancy Perspective Source: CBRE Research, Q3 2012 Note: The cyclic low is the most recent low prior to the onset of the last financial crisis; the cyclic high is the high experienced following the cyclic low. Cyclic High 4% 6% 8% 10% 12% 14% 16% 18% Asia EMEA US and Canada Global Cylic High Cyclic Low Q3 2012 335 bps 148 bps 116 bps 31 bps Global Office Vacancy Rates, % |
|
|
U.S. Multi-Housing Leads and Retail Lags 2012Q3 Past Cyclic High “Natural Rate” Year Back to "Natural Rate" Office Vacancy Rate 15.5% 16.9 / 2010 13 to 15 2013 Industrial Availability Rate 13.1% 14.5 / 2010 9 to 10 2015 Retail Availability Rate 12.9% 13.2 / 2011 9 to 10 2016 Multifamily Vacancy Rate 4.6% 7.44 / 2009 5 to 6 2010 Full Service Hotels Vacancy Rate 33.7% 43 / 2009 34 to 38 2010 Source: CBRE Econometric Advisors, Q3 2012 |
|
|
CBRE Global Rent Index Source: CBRE Research, Q3 2012 Q3 2012 % Change Year over Year Q3 2012 vs. Q2 2012 7.3% 1.4% 0.9% 2.0% 0.3% -0.07% -1.0% 0.0% 1.0% 2.0% 3.0% 4.0% 5.0% 6.0% 7.0% 8.0% Global Retail Rent Global Industrial Rent Global Office Rent |
|
|
Muted Supply Risk for Now Source: CBRE Econometric Advisors, Q3 2012 % Change Note: New Supply as Share of Inventory, 2012-2014 |