Exhibit 99.8
|
|
Case Study: 1540 Broadway Mary Ann Tighe CEO, New York Tri-State Region November 17, 2010 |
Exhibit 99.8
|
|
Case Study: 1540 Broadway Mary Ann Tighe CEO, New York Tri-State Region November 17, 2010 |
|
|
[LOGO] |
|
|
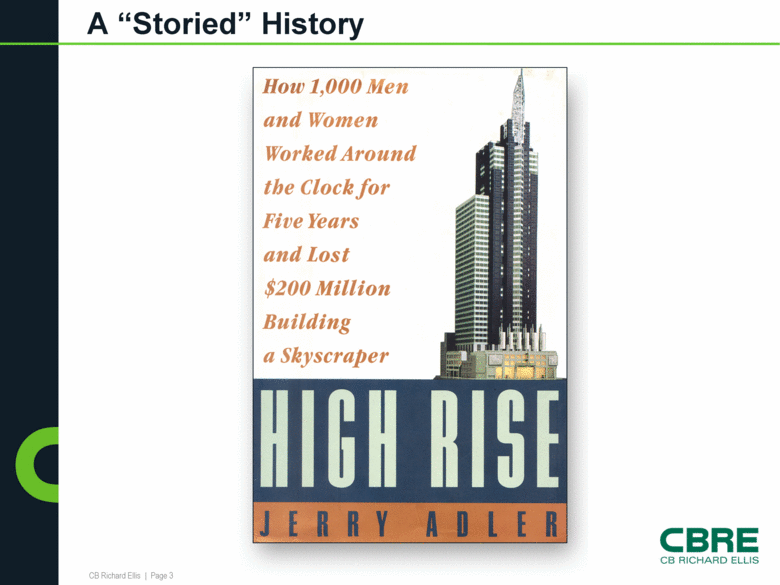
A “Storied” History |
|
|
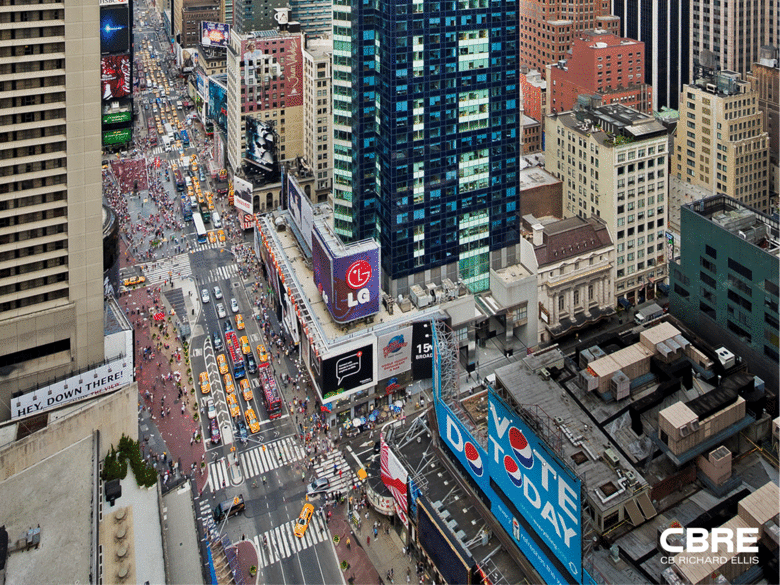
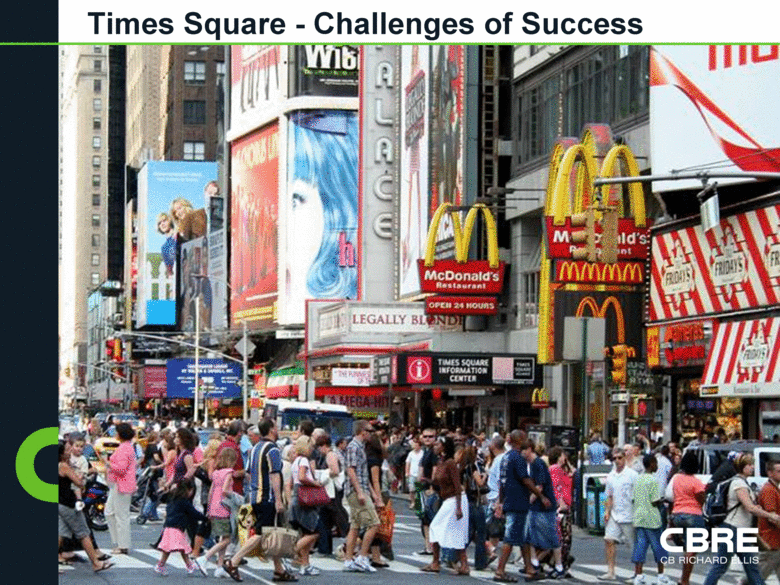
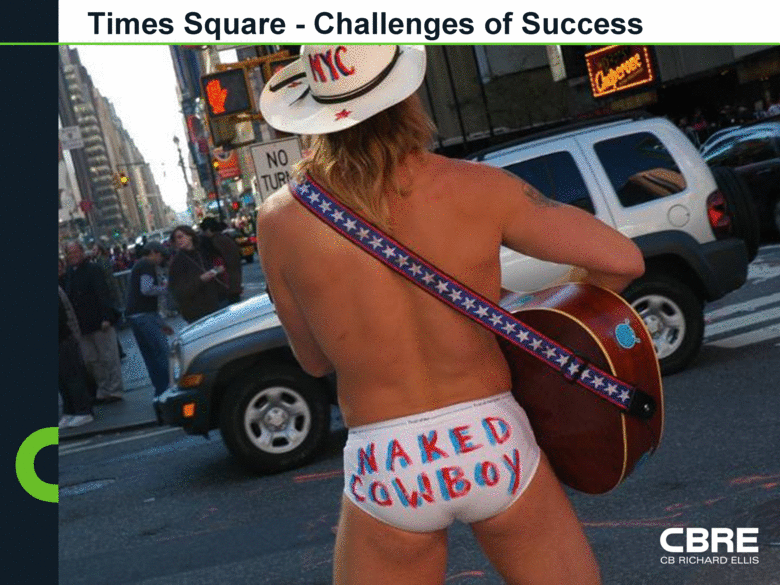
Times Square - Challenges of Success |
|
|
Times Square - Challenges of Success |
|
|
[LOGO] |
|
|
[LOGO] |
|
|
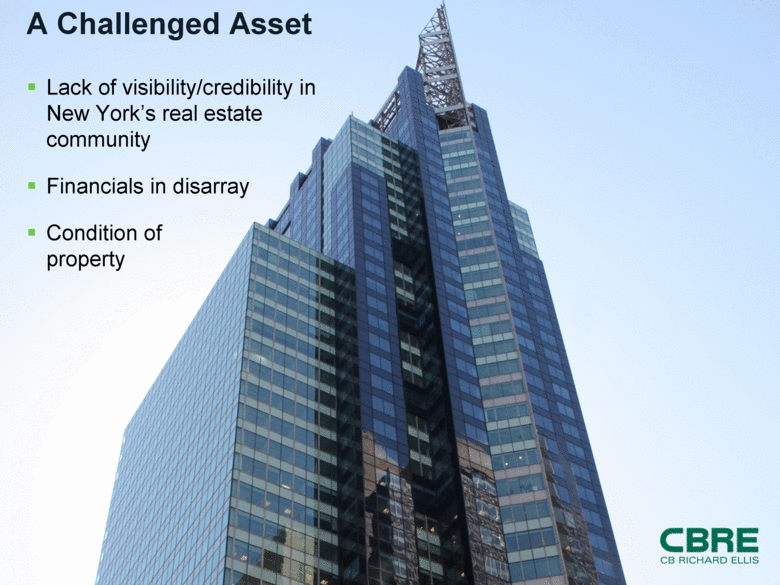
A Challenged Asset Lack of visibility/credibility in New York’s real estate community Financials in disarray Condition of property |
|
|
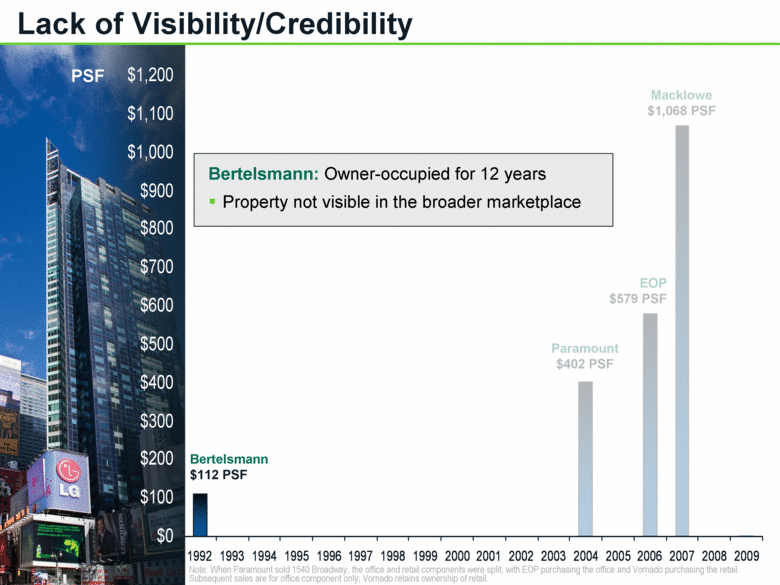
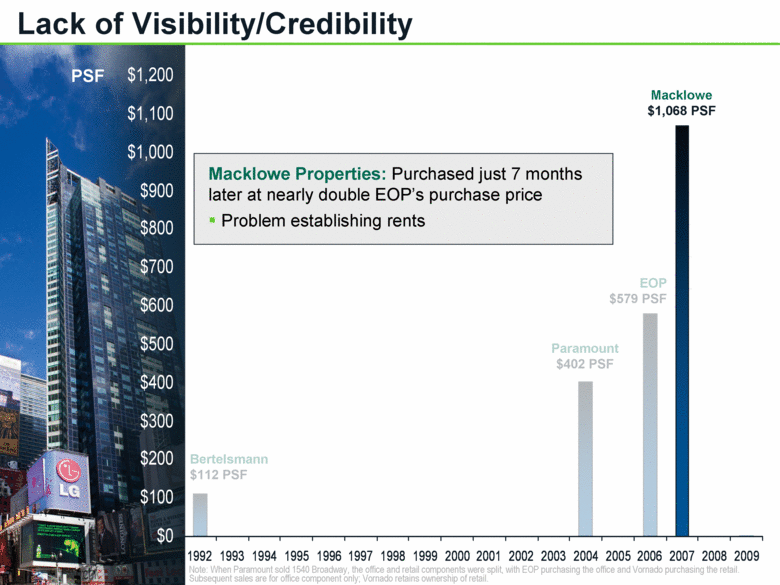
Paramount $402 PSF EOP $579 PSF Macklowe $1,068 PSF PSF Lack of Visibility/Credibility Note: When Paramount sold 1540 Broadway, the office and retail components were split, with EOP purchasing the office and Vornado purchasing the retail. Subsequent sales are for office component only; Vornado retains ownership of retail. Bertelsmann $112 PSF Bertelsmann: Owner-occupied for 12 years Property not visible in the broader marketplace $0 $100 $200 $300 $400 $500 $600 $700 $800 $900 $1,000 $1,100 $1,200 1992 1993 1994 1995 1996 1997 1998 1999 2000 2001 2002 2003 2004 2005 2006 2007 2008 2009 |
|
|
Bertelsmann $112 PSF EOP $579 PSF Macklowe $1,068 PSF PSF Lack of Visibility/Credibility Note: When Paramount sold 1540 Broadway, the office and retail components were split, with EOP purchasing the office and Vornado purchasing the retail. Subsequent sales are for office component only; Vornado retains ownership of retail. Paramount $402 PSF Paramount Group: Property 30% vacant Aggressive in pricing, risk-averse; perception that space not “really” available $0 $100 $200 $300 $400 $500 $600 $700 $800 $900 $1,000 $1,100 $1,200 1992 1993 1994 1995 1996 1997 1998 1999 2000 2001 2002 2003 2004 2005 2006 2007 2008 2009 |
|
|
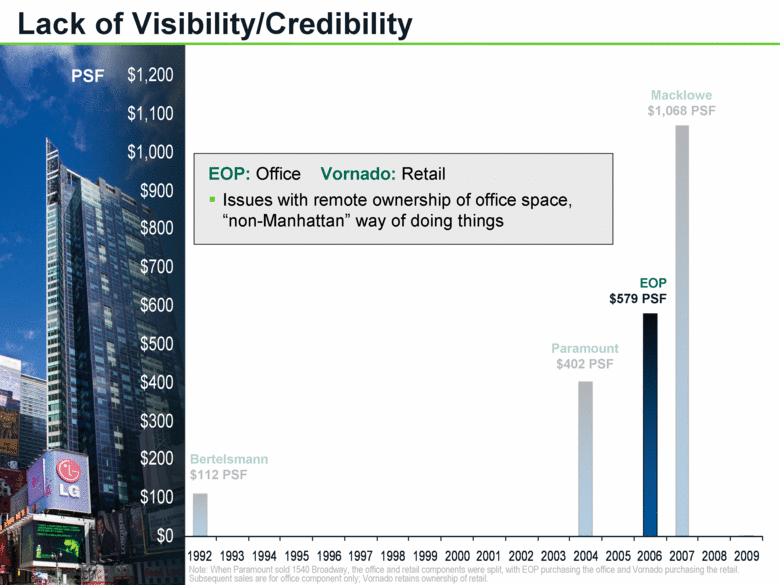
Paramount $402 PSF Bertelsmann $112 PSF Macklowe $1,068 PSF PSF Lack of Visibility/Credibility Note: When Paramount sold 1540 Broadway, the office and retail components were split, with EOP purchasing the office and Vornado purchasing the retail. Subsequent sales are for office component only; Vornado retains ownership of retail. EOP: Office Vornado: Retail Issues with remote ownership of office space, “non-Manhattan” way of doing things EOP $579 PSF $0 $100 $200 $300 $400 $500 $600 $700 $800 $900 $1,000 $1,100 $1,200 1992 1993 1994 1995 1996 1997 1998 1999 2000 2001 2002 2003 2004 2005 2006 2007 2008 2009 |
|
|
EOP $579 PSF Paramount $402 PSF Bertelsmann $112 PSF PSF Lack of Visibility/Credibility Note: When Paramount sold 1540 Broadway, the office and retail components were split, with EOP purchasing the office and Vornado purchasing the retail. Subsequent sales are for office component only; Vornado retains ownership of retail. Macklowe Properties: Purchased just 7 months later at nearly double EOP’s purchase price Problem establishing rents Macklowe $1,068 PSF $0 $100 $200 $300 $400 $500 $600 $700 $800 $900 $1,000 $1,100 $1,200 1992 1993 1994 1995 1996 1997 1998 1999 2000 2001 2002 2003 2004 2005 2006 2007 2008 2009 |
|
|
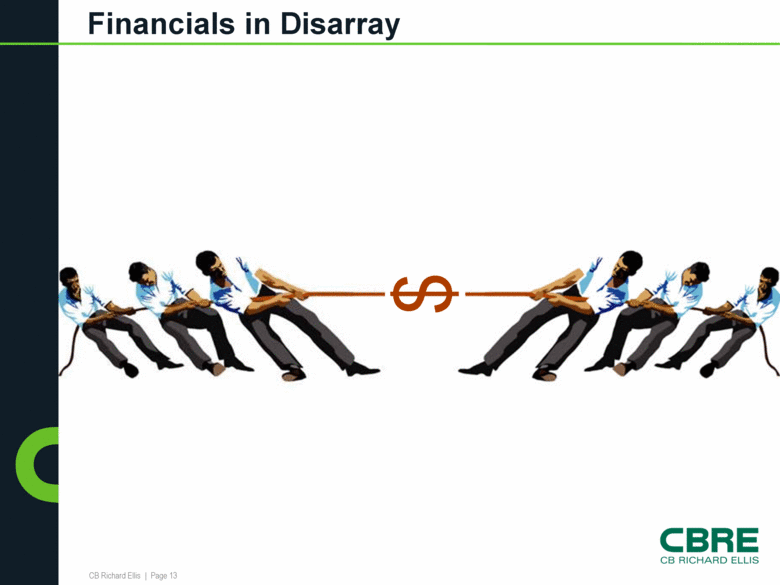
$ Financials in Disarray |
|
|
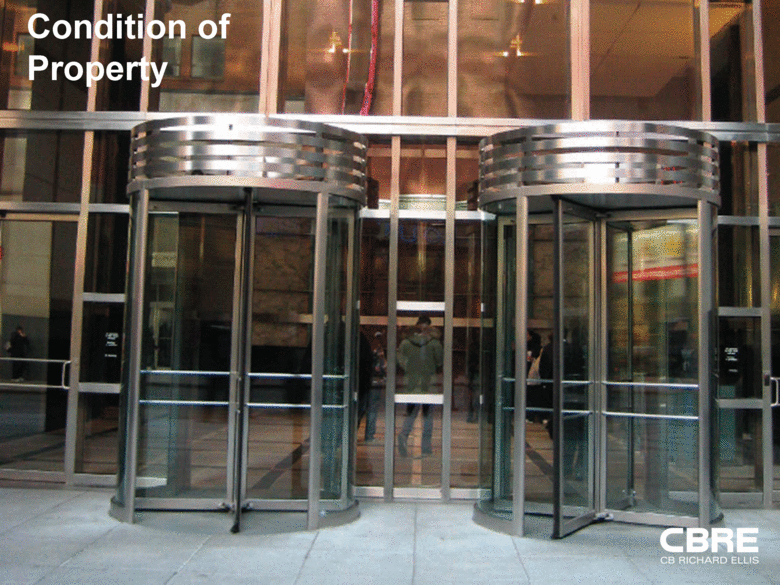
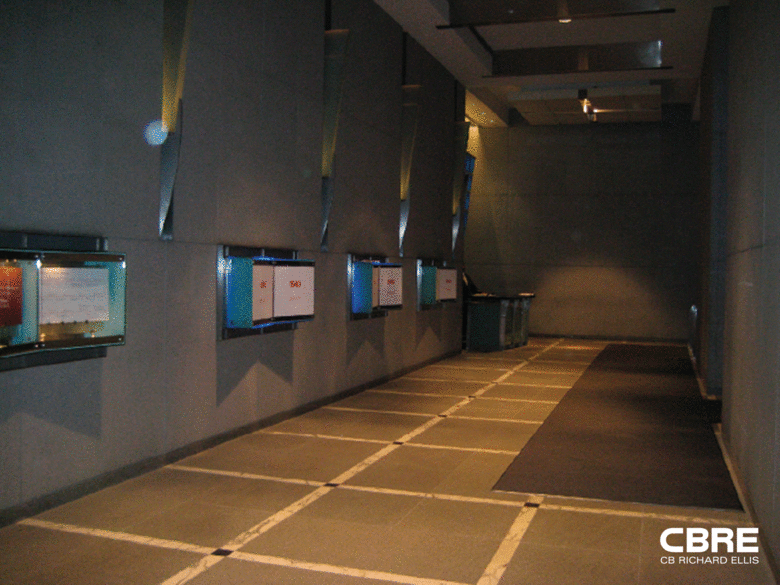
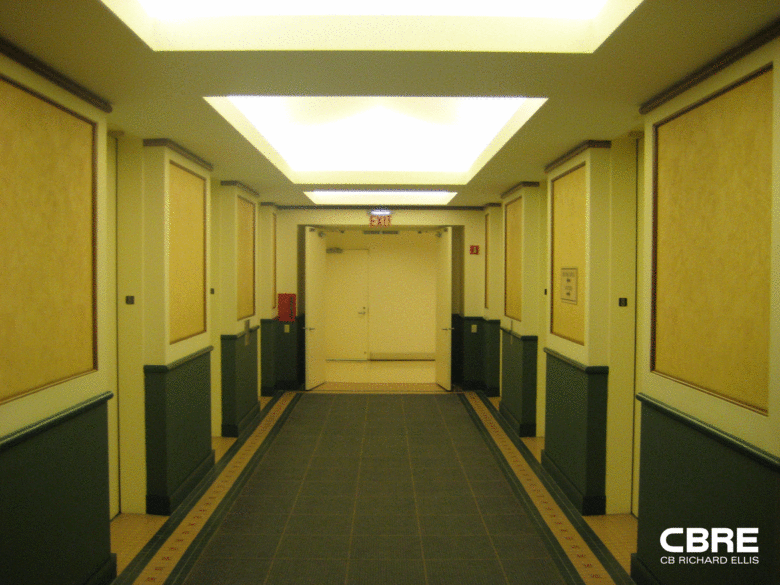
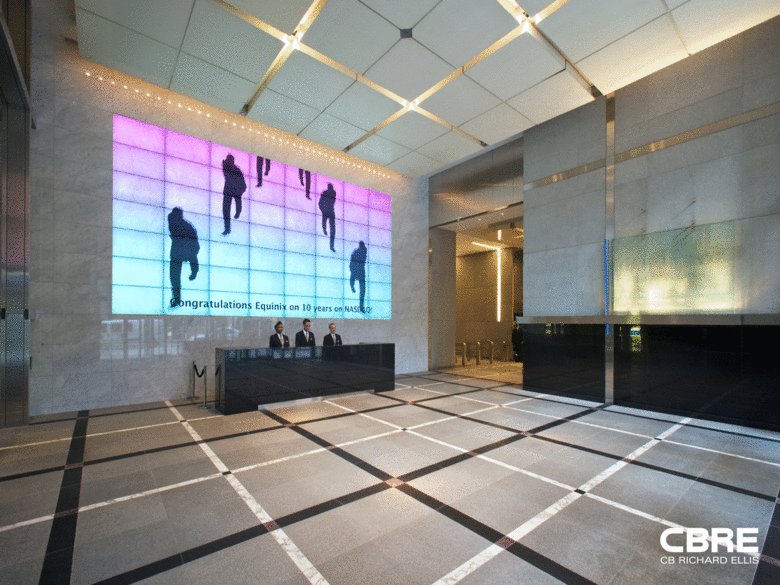
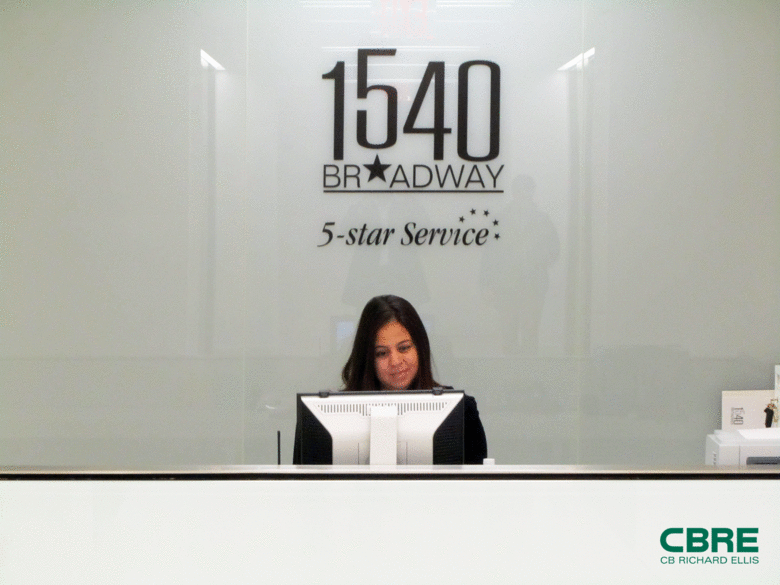
Entrance – 1540 Broadway Condition of Property |
|
|
[LOGO] |
|
|
[LOGO] |
|
|
[LOGO] |
|
|
[LOGO] |
|
|
[LOGO] |
|
|
CBREI Strategic Partners U.S. 5 Fund |
|
|
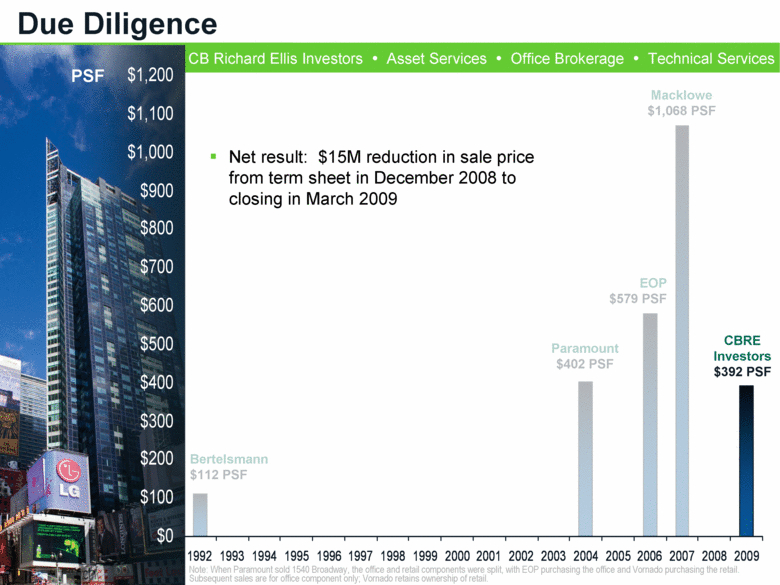
CB Richard Ellis Investors Asset Services Office Brokerage Technical Services Bertelsmann $112 PSF Paramount $402 PSF EOP $579 PSF Macklowe $1,068 PSF PSF Due Diligence Note: When Paramount sold 1540 Broadway, the office and retail components were split, with EOP purchasing the office and Vornado purchasing the retail. Subsequent sales are for office component only; Vornado retains ownership of retail. Net result: $15M reduction in sale price from term sheet in December 2008 to closing in March 2009 CBRE Investors $392 PSF $0 $100 $200 $300 $400 $500 $600 $700 $800 $900 $1,000 $1,100 $1,200 1992 1993 1994 1995 1996 1997 1998 1999 2000 2001 2002 2003 2004 2005 2006 2007 2008 2009 |
|
|
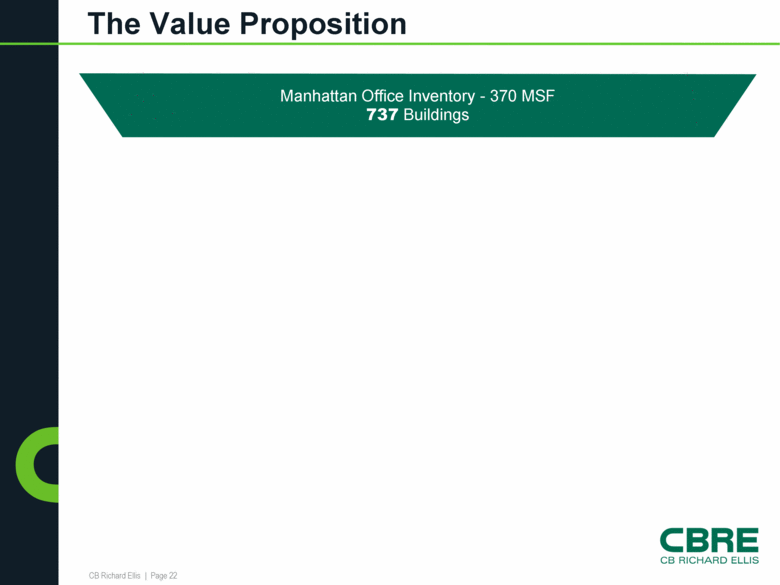
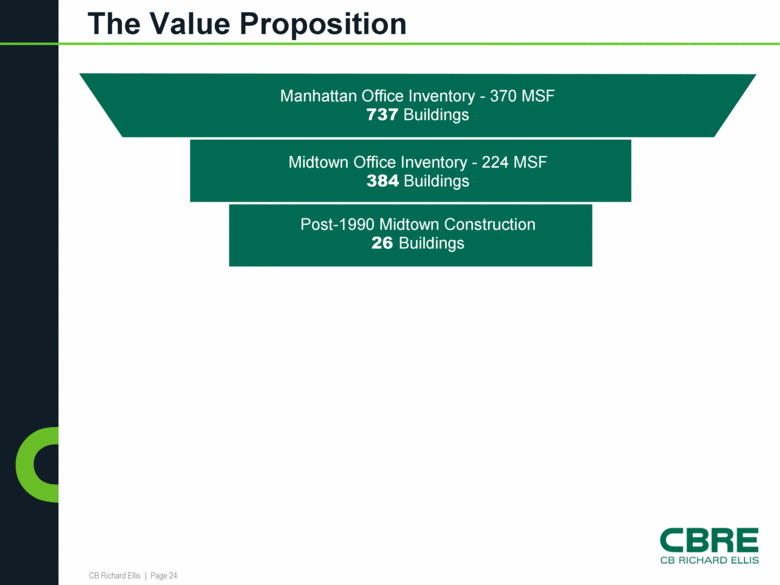
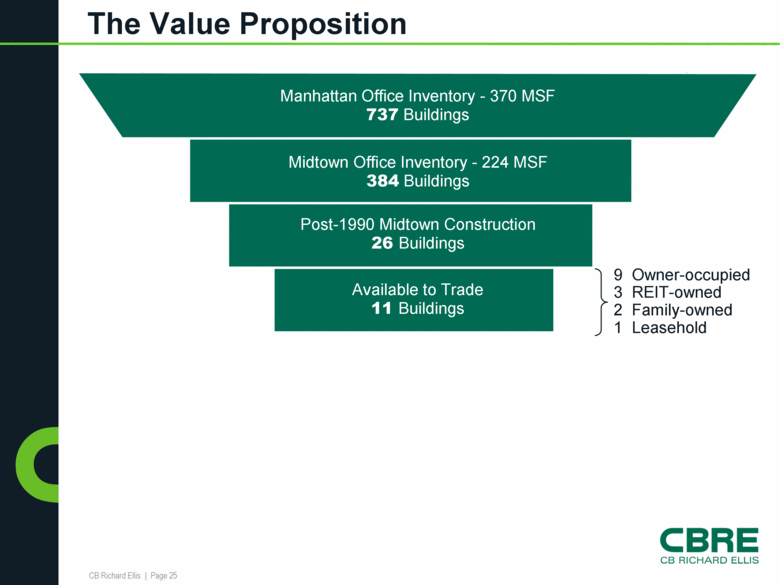
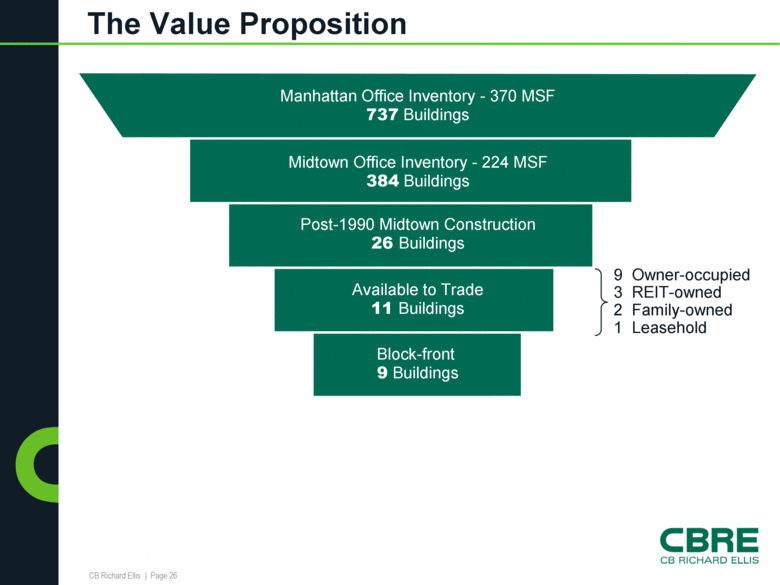
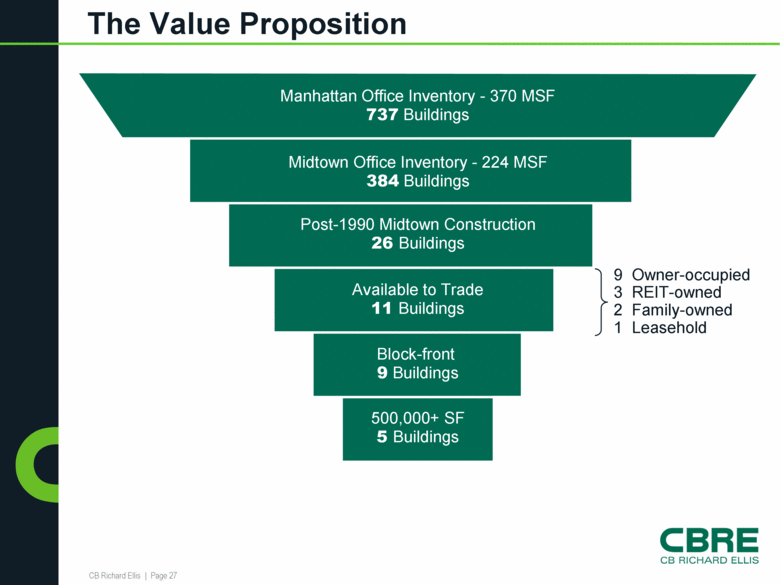
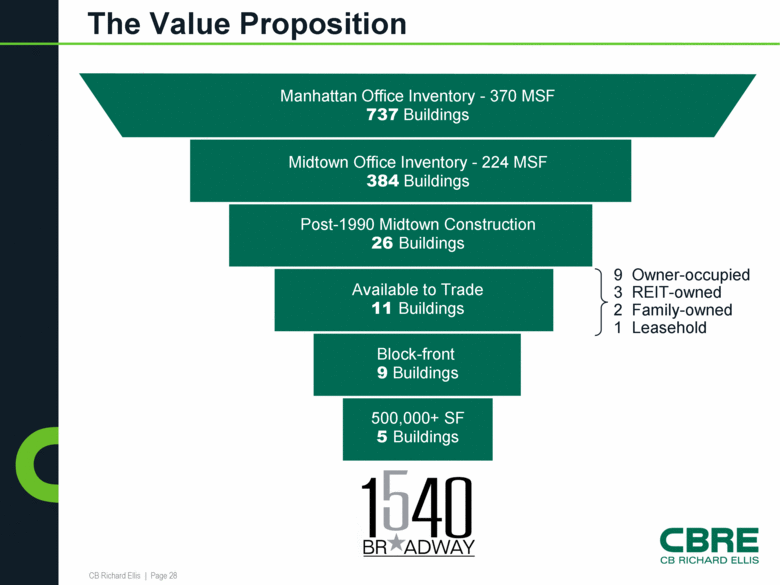
The Value Proposition Manhattan Office Inventory - 370 MSF 737 Buildings |
|
|
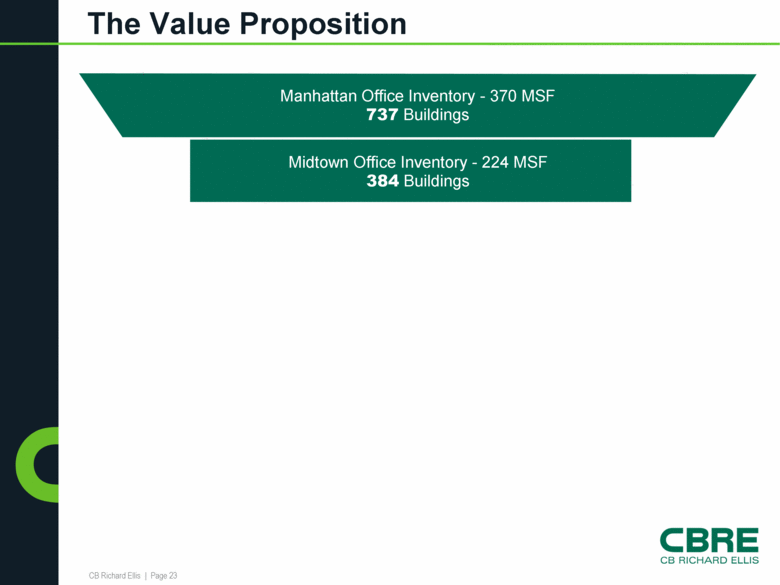
The Value Proposition Midtown Office Inventory - 224 MSF 384 Buildings Manhattan Office Inventory - 370 MSF 737 Buildings |
|
|
The Value Proposition Midtown Office Inventory - 224 MSF 384 Buildings Manhattan Office Inventory - 370 MSF 737 Buildings Post-1990 Midtown Construction 26 Buildings |
|
|
The Value Proposition Midtown Office Inventory - 224 Post-1990 Midtown Construction 26 Buildings Available to Trade 11 Buildings Manhattan Office Inventory - 370 MSF 737 Buildings 9 Owner-occupied 3 REIT-owned 2 Family-owned 1 Leasehold |
|
|
The Value Proposition Midtown Office Inventory - 224 MSF 384 Buildings Post-1990 Midtown Construction 26 Buildings Available to Trade 11 Manhattan Office Inventory - 370 MSF 737 Buildings Block-front 9 Buildings 9 Owner-occupied 3 REIT-owned 2 Family-owned 1 Leasehold |
|
|
The Value Proposition Midtown Office Inventory - 224 MSF 384 Buildings Post-1990 Midtown Construction 26 Buildings Available to Trade 11 Buildings Manhattan Office Inventory - 370 MSF 737 Buildings Block-front 9 Buildings 9 Owner-occupied 3 REIT-owned 2 Family-owned 1 Leasehold 500,000+ SF 5 Buildings |
|
|
The Value Proposition Midtown Office Inventory - 224 MSF 384 Buildings Post-1990 Midtown Construction 26 Buildings Available to Trade 11 Buildings 500,000+ SF 5 Buildings Manhattan Office Inventory - 370 MSF 737 Buildings Block-front 9 Buildings 9 Owner-occupied 3 REIT-owned 2 Family-owned 1 Leasehold |
|
|
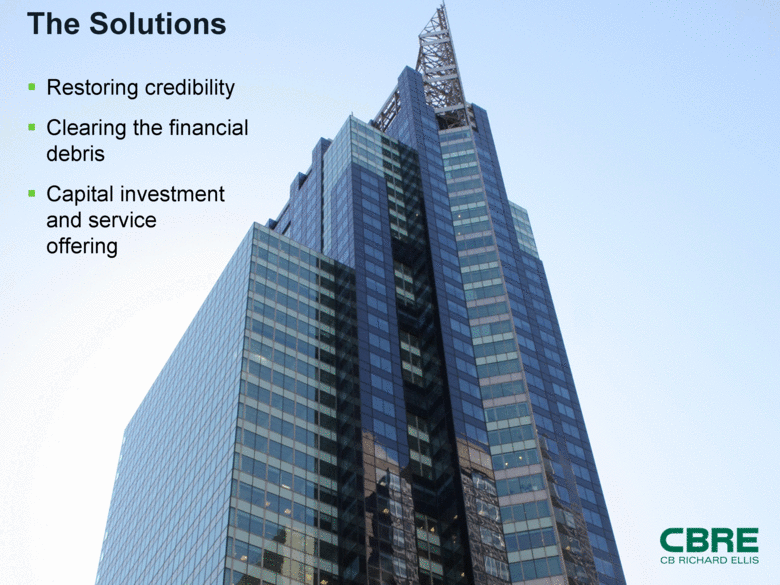
The Solutions Restoring credibility Clearing the financial debris Capital investment and service offering |
|
|
Restoring Credibility Telling the market a different story about ownership Well capitalized Committed to the asset and its tenants Market-oriented in its approach to leasing CB Richard Ellis Investors |
|
|
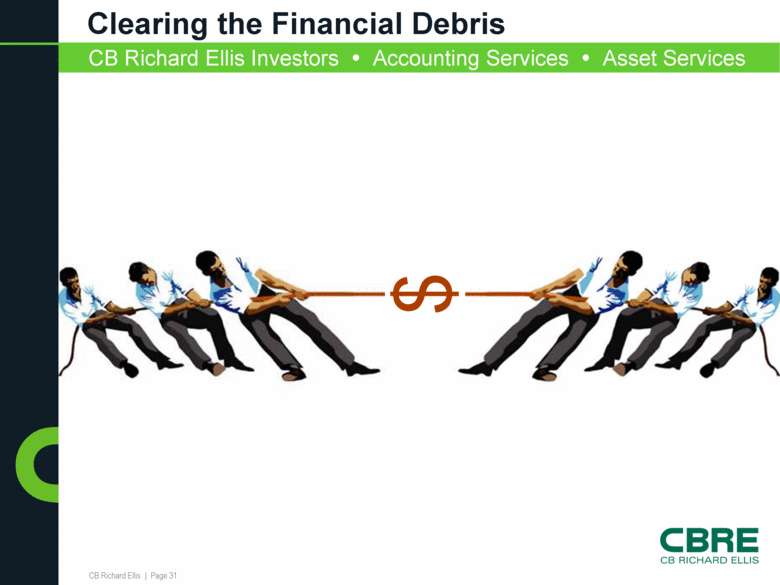
Clearing the Financial Debris $ CB Richard Ellis Investors Accounting Services Asset Services |
|
|
Clearing the Financial Debris CB Richard Ellis Investors Accounting Services Asset Services |
|
|
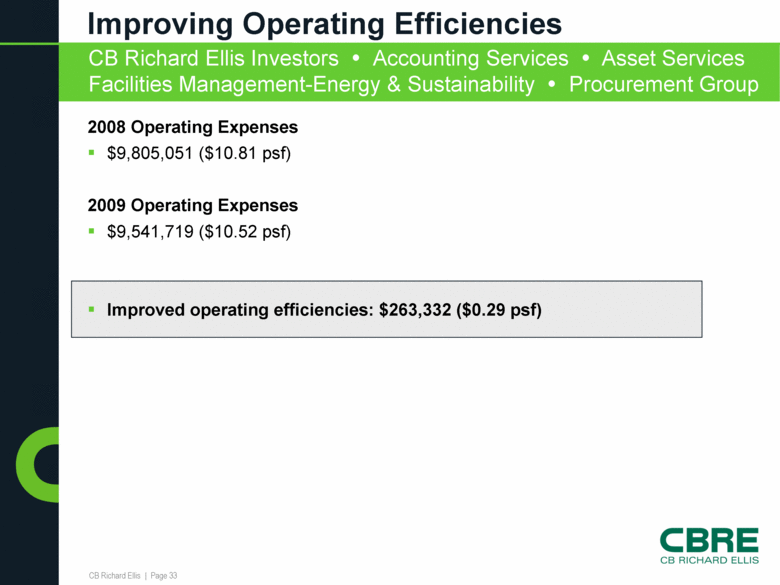
CB Richard Ellis Investors Accounting Services Asset Services Facilities Management-Energy & Sustainability Procurement Group Improving Operating Efficiencies 2008 Operating Expenses $9,805,051 ($10.81 psf) 2009 Operating Expenses $9,541,719 ($10.52 psf) Improved operating efficiencies: $263,332 ($0.29 psf) |
|
|
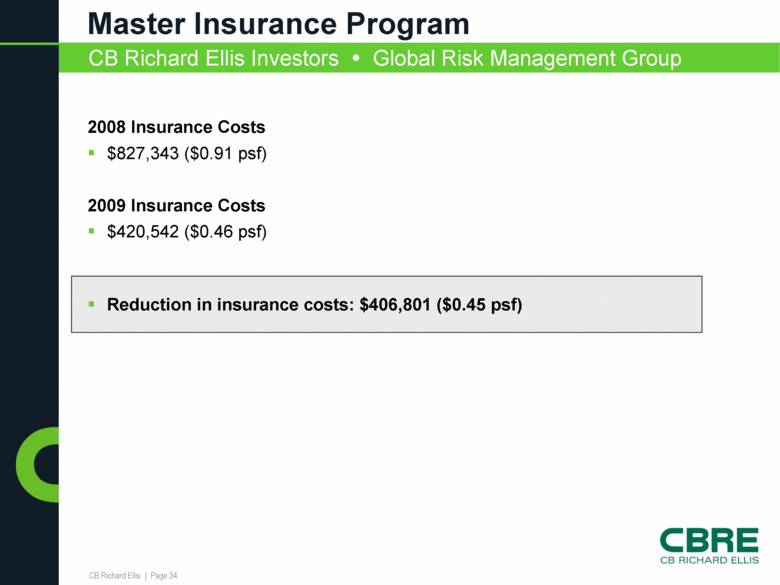
CB Richard Ellis Investors Global Risk Management Group Master Insurance Program 2008 Insurance Costs $827,343 ($0.91 psf) 2009 Insurance Costs $420,542 ($0.46 psf) Reduction in insurance costs: $406,801 ($0.45 psf) |
|
|
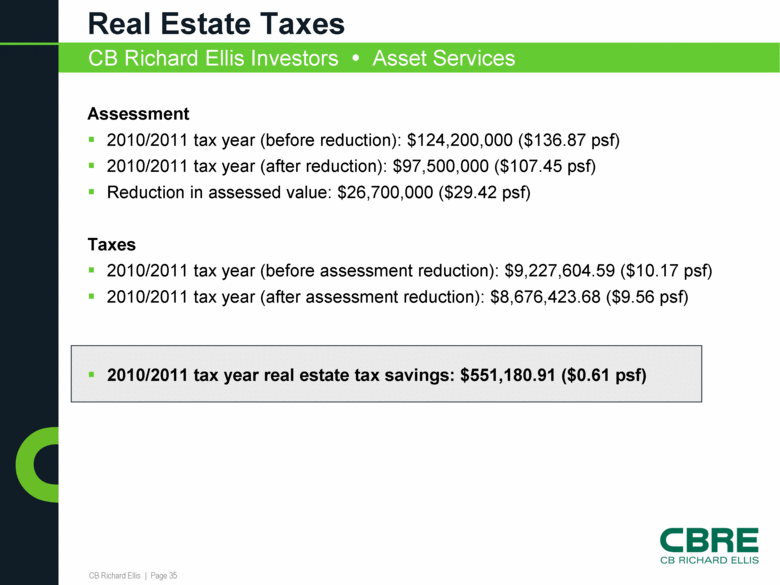
Real Estate Taxes Assessment 2010/2011 tax year (before reduction): $124,200,000 ($136.87 psf) 2010/2011 tax year (after reduction): $97,500,000 ($107.45 psf) Reduction in assessed value: $26,700,000 ($29.42 psf) Taxes 2010/2011 tax year (before assessment reduction): $9,227,604.59 ($10.17 psf) 2010/2011 tax year (after assessment reduction): $8,676,423.68 ($9.56 psf) 2010/2011 tax year real estate tax savings: $551,180.91 ($0.61 psf) CB Richard Ellis Investors Asset Services |
|
|
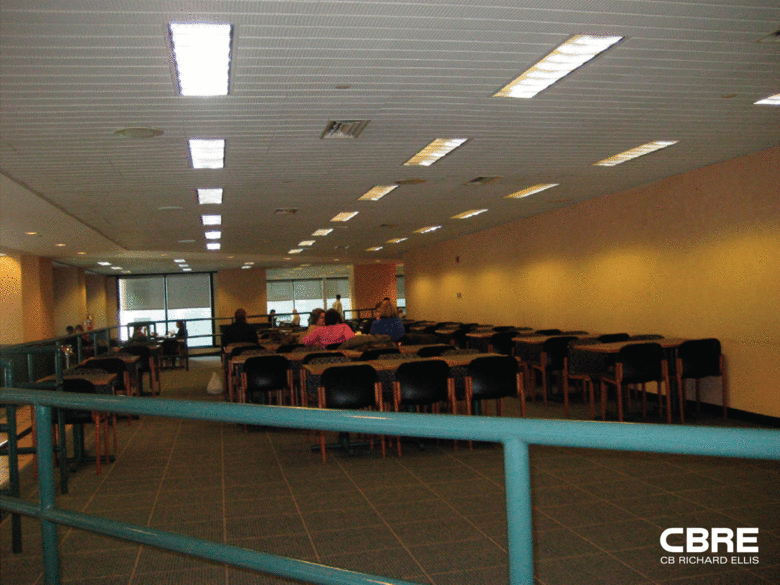
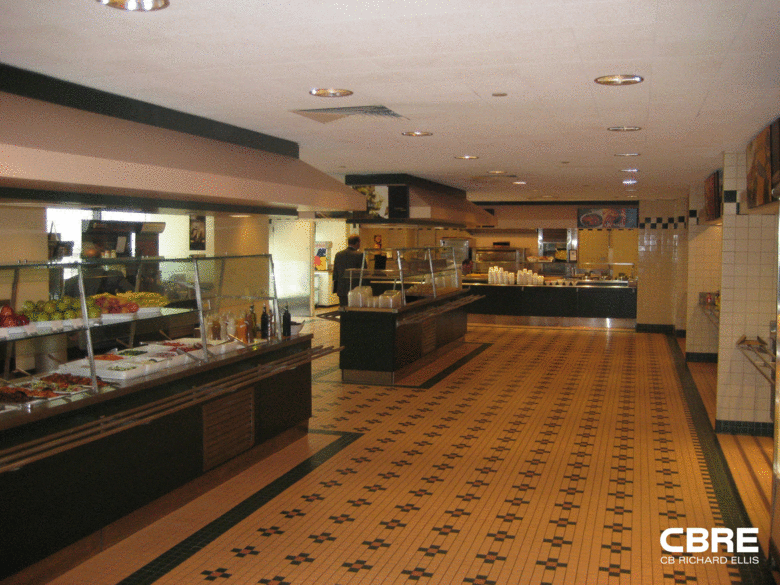
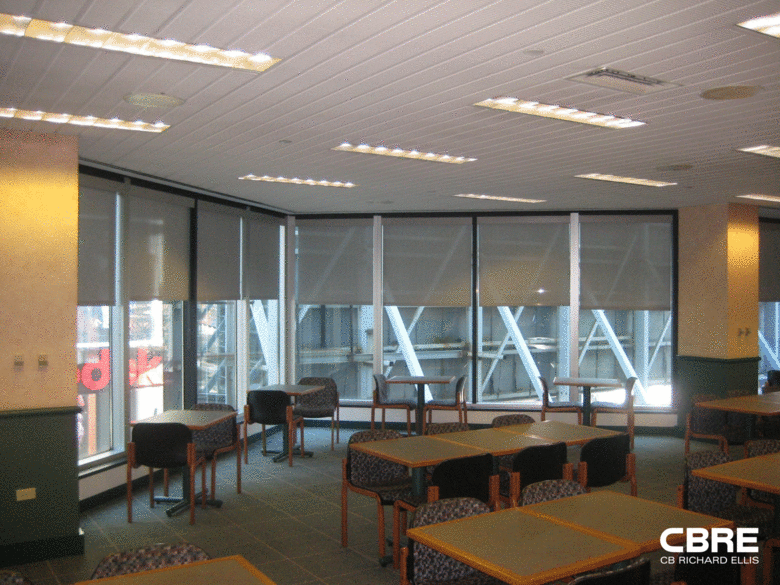
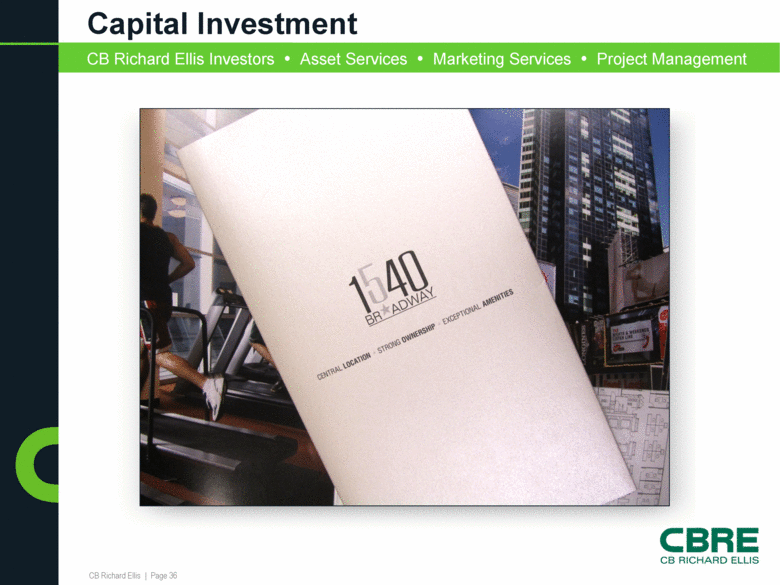
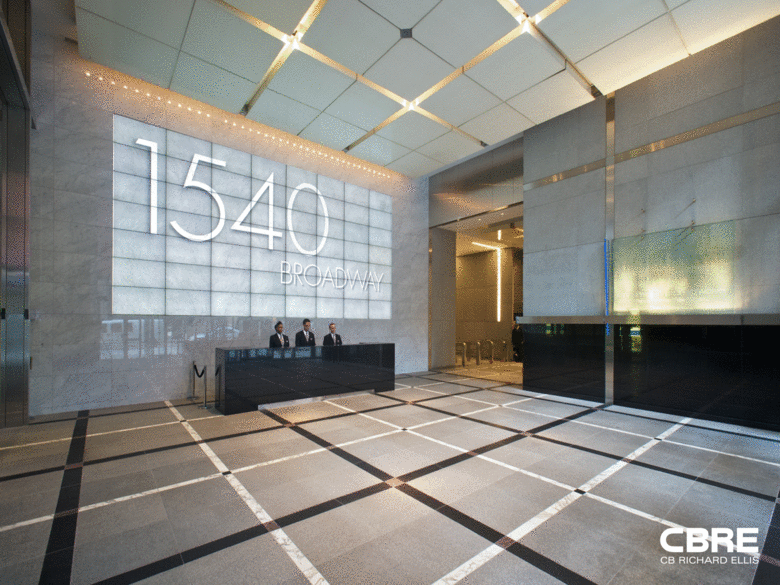
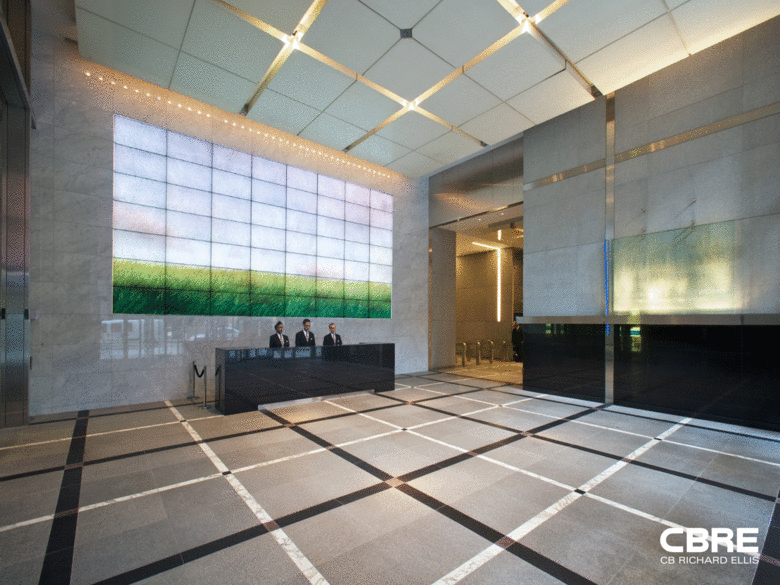
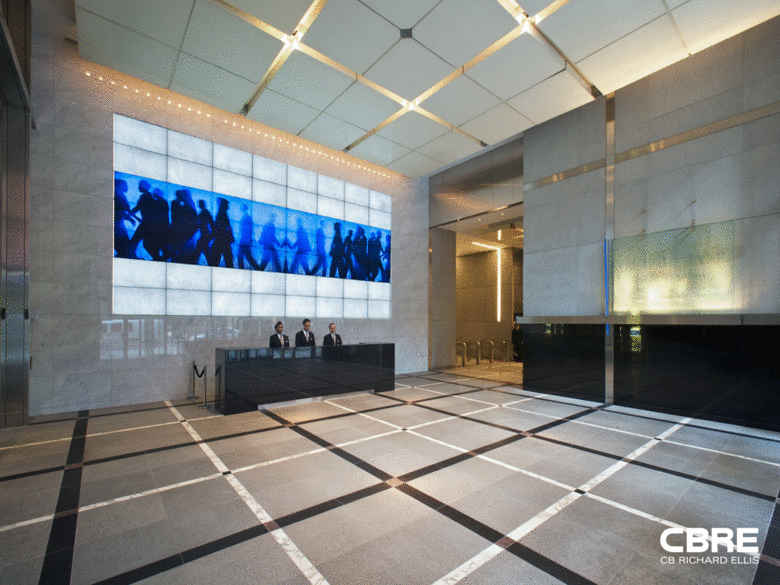
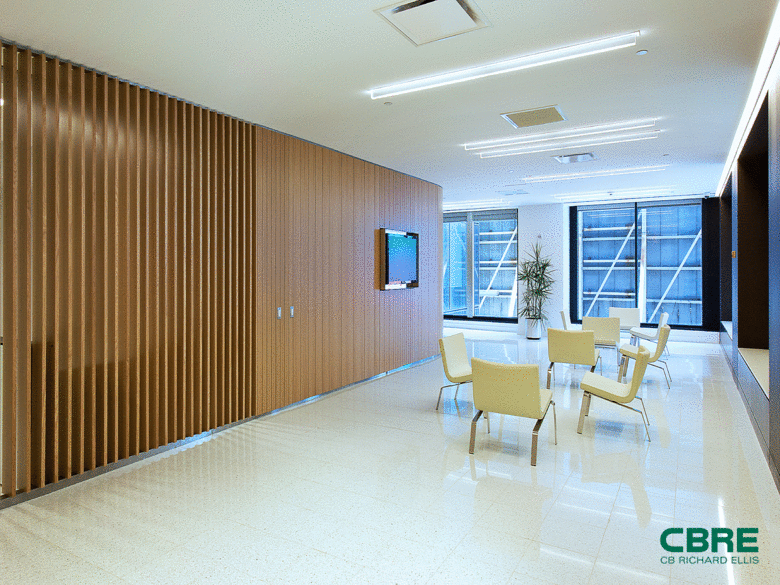
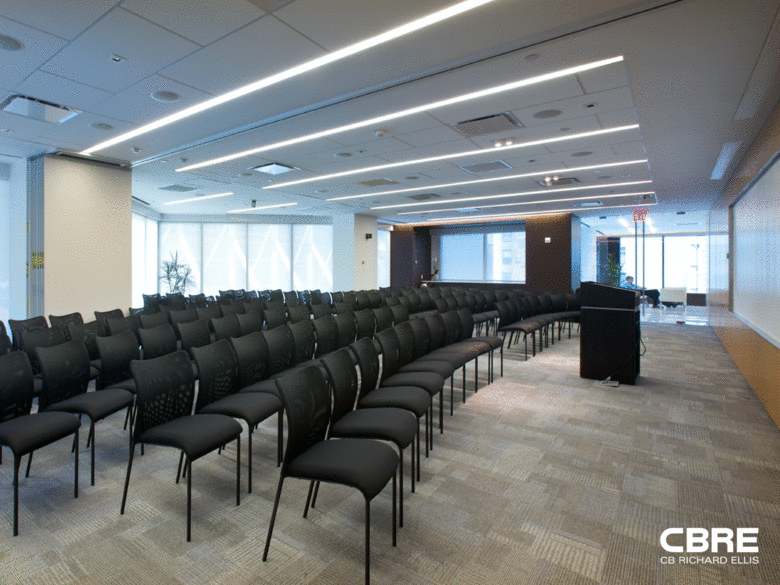
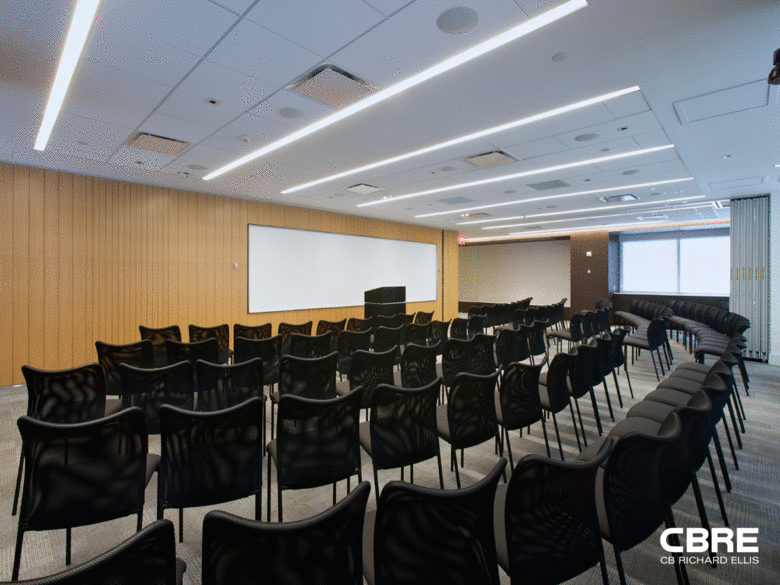
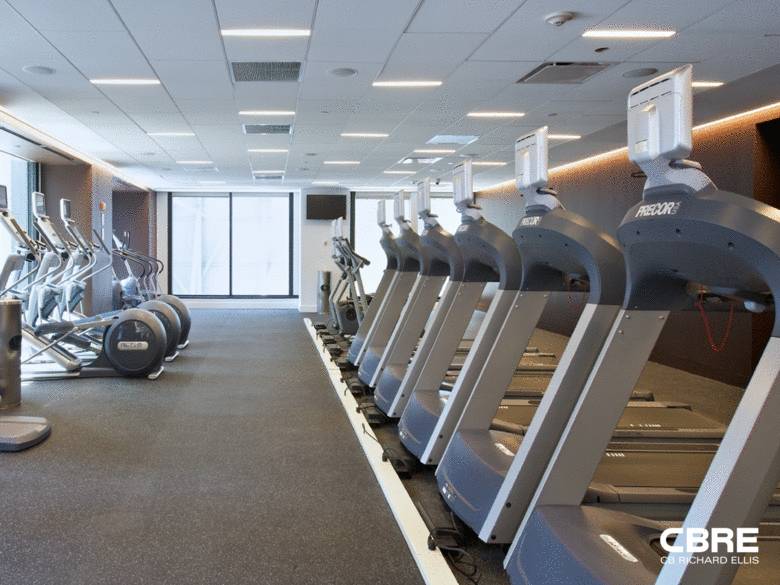
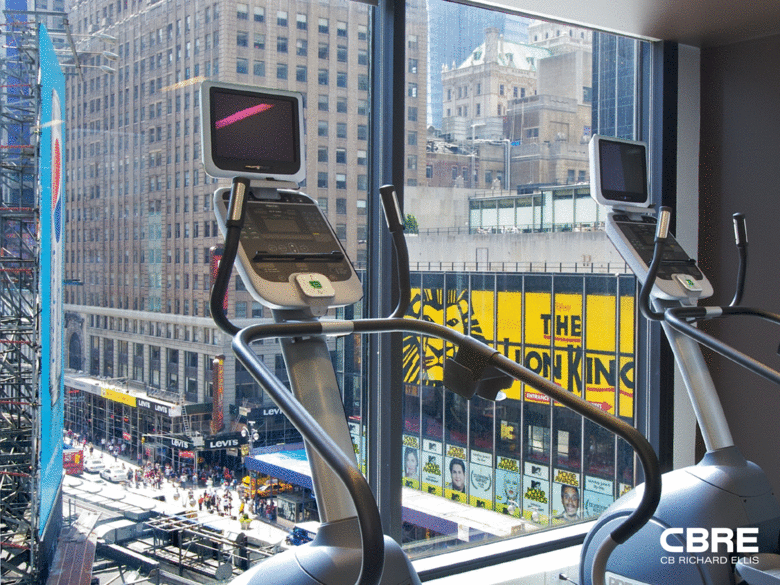
Capital Investment CB Richard Ellis Investors Asset Services Marketing Services Project Management |
|
|
[LOGO] |
|
|
[LOGO] |
|
|
[LOGO] |
|
|
[LOGO] |
|
|
[LOGO] |
|
|
[LOGO] |
|
|
[LOGO] |
|
|
[LOGO] |
|
|
[LOGO] |
|
|
[LOGO] |
|
|
[LOGO] |
|
|
[LOGO] |
|
|
[LOGO] |
|
|
[LOGO] |
|
|
[LOGO] |
|
|
[LOGO] |
|
|
[LOGO] |
|
|
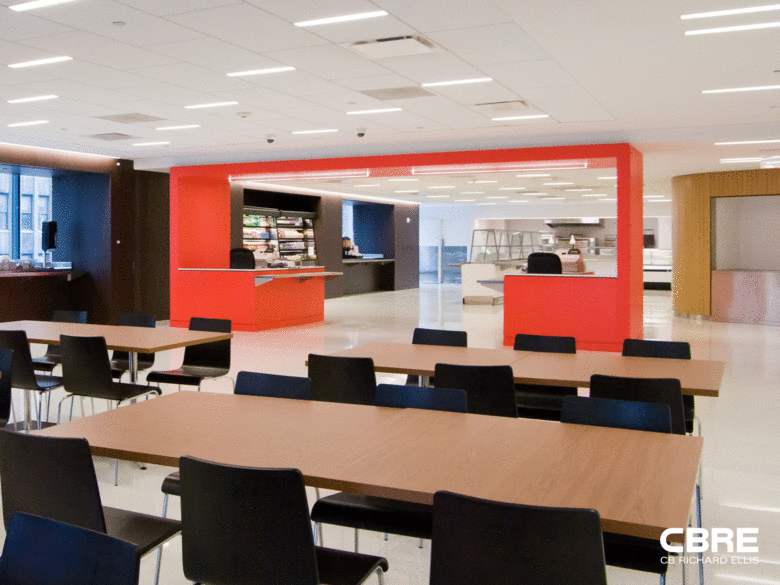
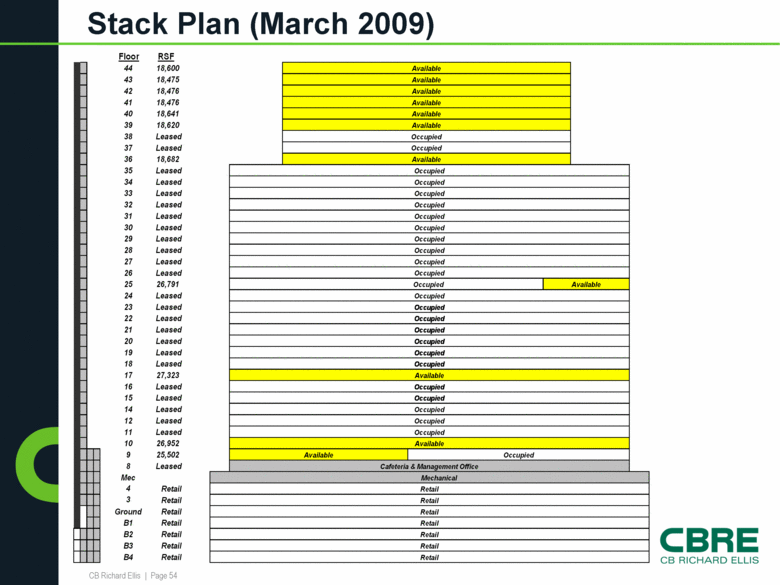
Stack Plan (March 2009) Floor RSF 44 18,600 Available 43 18,475 Available 42 18,476 Available 41 18,476 Available 40 18,641 Available 39 18,620 Available 38 Leased Occupied 37 Leased Occupied 36 18,682 Available 35 Leased Occupied 34 Leased Occupied 33 Leased Occupied 32 Leased Occupied 31 Leased Occupied 30 Leased Occupied 29 Leased Occupied 28 Leased Occupied 27 Leased Occupied 26 Leased Occupied 25 26,791 Occupied Available 24 Leased Occupied 23 Leased Occupied 22 Leased Occupied 21 Leased Occupied 20 Leased Occupied 19 Leased Occupied 18 Leased Occupied 17 27,323 Available 16 Leased Occupied 15 Leased Occupied 14 Leased Occupied 12 Leased Occupied 11 Leased Occupied 10 26,952 Available 9 25,502 Available 8 Leased Mec Mechanical 4 Retail Retail 3 Retail Retail Ground Retail Retail B1 Retail Retail B2 Retail Retail B3 Retail Retail B4 Retail Retail Occupied Cafeteria & Management Office |
|
|
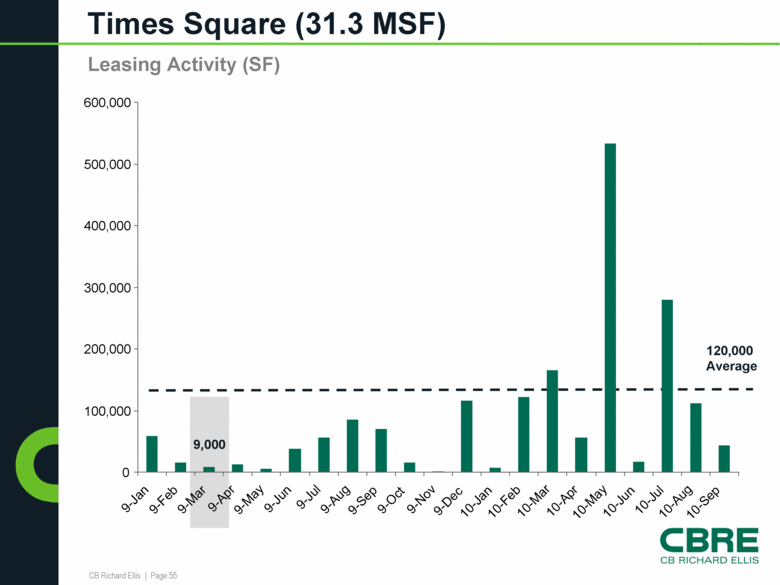
Times Square (31.3 MSF) Leasing Activity (SF) 120,000 Average 9,000 0 100,000 200,000 300,000 400,000 500,000 600,000 9-Jan 9-Feb 9-Mar 9-Apr 9-May 9-Jun 9-Jul 9-Aug 9-Sep 9-Oct 9-Nov 9-Dec 10-Jan 10-Feb 10-Mar 10-Apr 10-May 10-Jun 10-Jul 10-Aug 10-Sep |
|
|
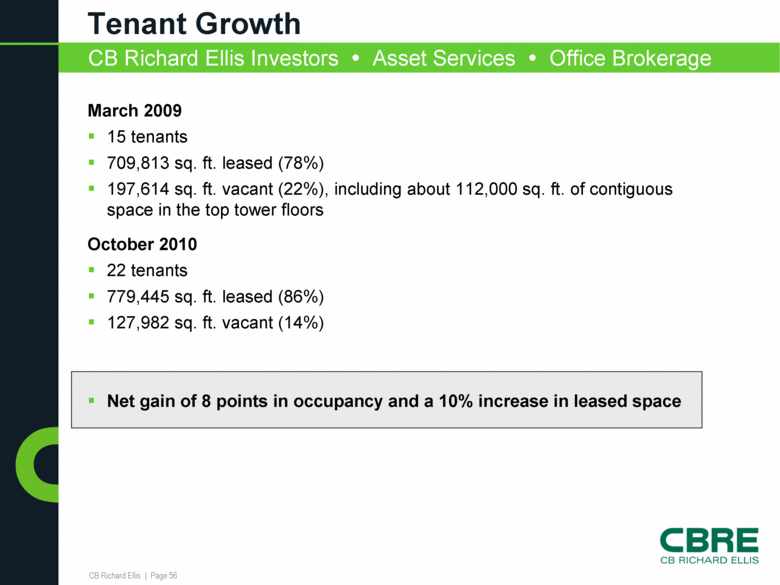
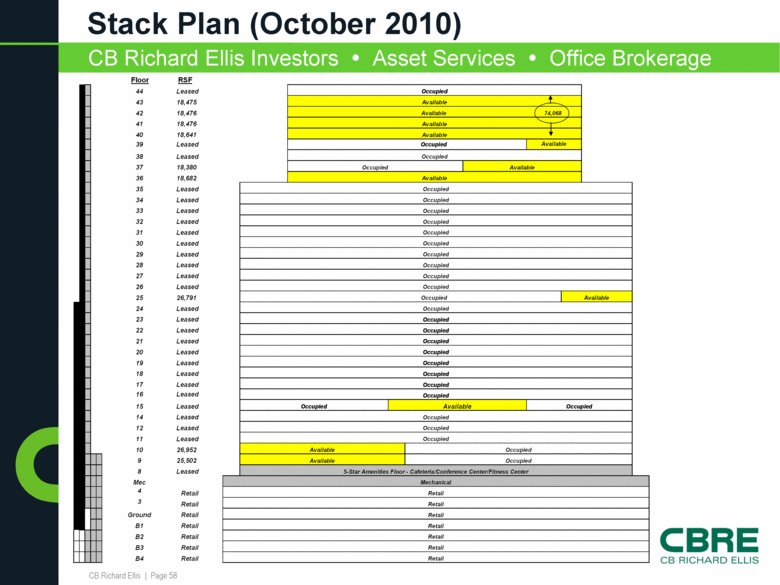
Tenant Growth March 2009 15 tenants 709,813 sq. ft. leased (78%) 197,614 sq. ft. vacant (22%), including about 112,000 sq. ft. of contiguous space in the top tower floors October 2010 22 tenants 779,445 sq. ft. leased (86%) 127,982 sq. ft. vacant (14%) Net gain of 8 points in occupancy and a 10% increase in leased space CB Richard Ellis Investors Asset Services Office Brokerage |
|
|
Tenant Growth CB Richard Ellis Investors Asset Services Office Brokerage |
|
|
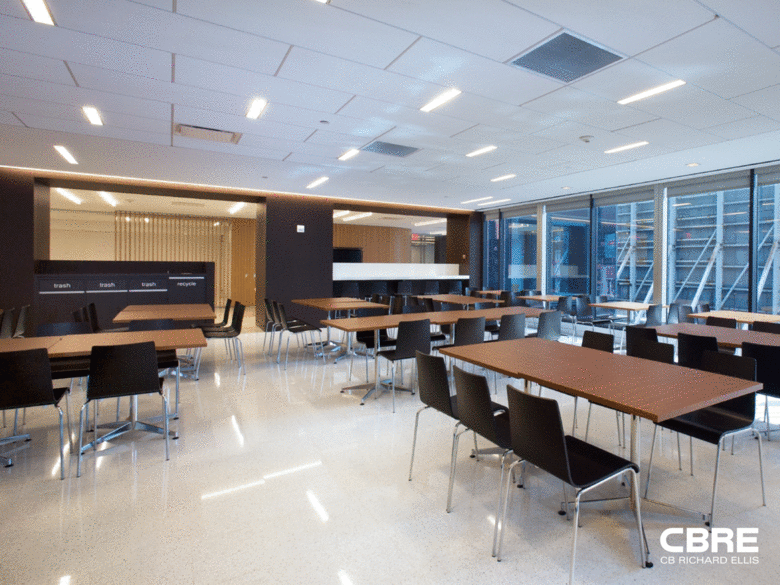
Stack Plan (October 2010) CB Richard Ellis Investors Asset Services Office Brokerage Floor RSF 44 Leased Occupied 43 18,475 Available 42 18,476 Available 74,068 41 18,476 Available 40 18,641 Available 39 Leased Occupied 38 Leased Occupied 37 18,380 Available 36 18,682 Available 35 Leased Occupied 34 Leased Occupied 33 Leased Occupied 32 Leased Occupied 31 Leased Occupied 30 Leased Occupied 29 Leased Occupied 28 Leased Occupied 27 Leased Occupied 26 Leased Occupied 25 26,791 Occupied Available 24 Leased Occupied 23 Leased Occupied 22 Leased Occupied 21 Leased Occupied 20 Leased Occupied 19 Leased Occupied 18 Leased Occupied 17 Leased Occupied 16 Leased Occupied 15 Leased Occupied Occupied 14 Leased Occupied 12 Leased Occupied 11 Leased Occupied 10 26,952 9 25,502 Available 8 Leased Mec Mechanical 4 Retail 3 Retail Ground Retail B1 Retail B2 Retail B3 Retail B4 Retail Available Available Occupied Occupied 5-Star Amenities Floor - Cafeteria/Conference Center/Fitness Center Retail Available Occupied Retail Retail Retail Retail Retail Retail |
|
|
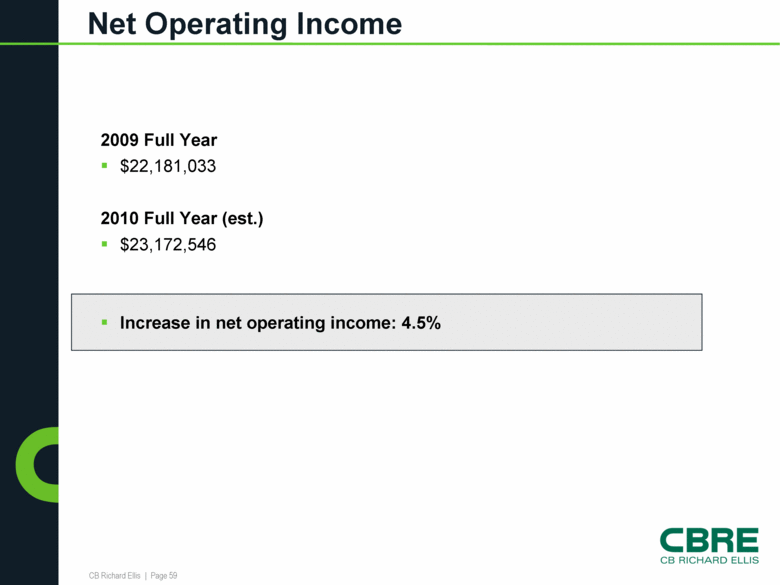
Net Operating Income 2009 Full Year $22,181,033 2010 Full Year (est.) $23,172,546 Increase in net operating income: 4.5% |
|
|
What We Accomplished New visibility in the market Credibility in the market Improved financials Desirable space and amenities |
|
|
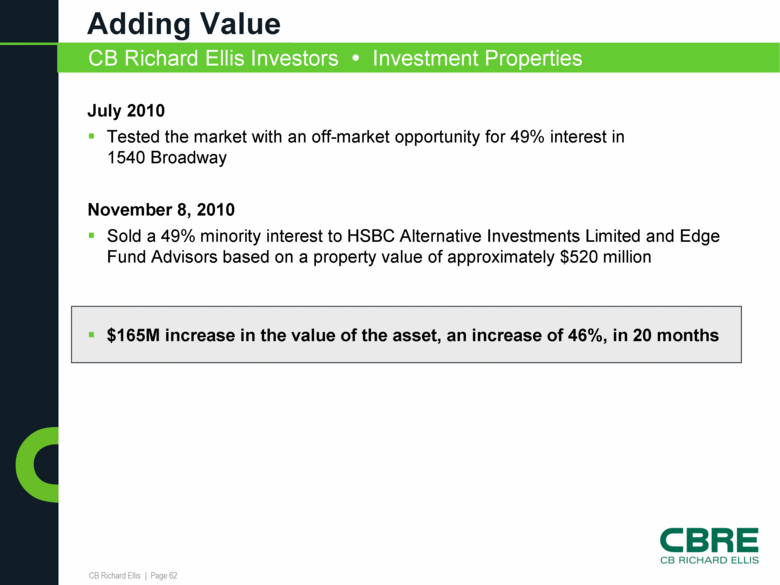
Testing the Market July 2010 Tested the market with an off-market opportunity for 49% interest in 1540 Broadway |
|
|
Adding Value July 2010 Tested the market with an off-market opportunity for 49% interest in 1540 Broadway November 8, 2010 Sold a 49% minority interest to HSBC Alternative Investments Limited and Edge Fund Advisors based on a property value of approximately $520 million $165M increase in the value of the asset, an increase of 46%, in 20 months CB Richard Ellis Investors Investment Properties |
|
|
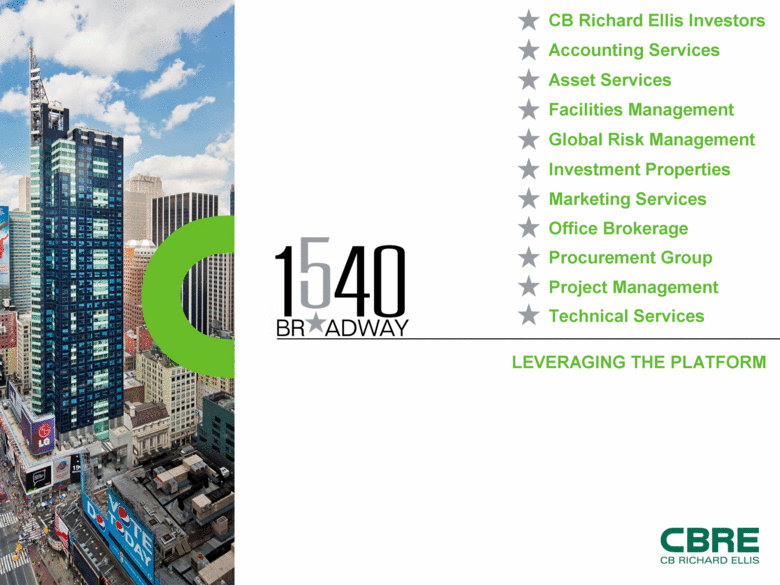
LEVERAGING THE PLATFORM CB Richard Ellis Investors Asset Services Marketing Services Office Brokerage Project Management Technical Services Accounting Services Facilities Management Procurement Group Global Risk Management Investment Properties |