Exhibit 99.2
|
|
Economic Outlook Raymond G. Torto, PhD, CRE Global Chief Economist November 17, 2010 |

Exhibit 99.2
|
|
Economic Outlook Raymond G. Torto, PhD, CRE Global Chief Economist November 17, 2010 |
|
|
Regional Growth Disparities Have Widened Real GDP (Annual Percent Change) Spread from Western Europe Source: CBRE Global Research and Consulting, Global Insight, October 2010 Forecast Western Europe |
|
|
Global Deal Flow Better, but Source: Real Capital Analytics (October 2010). *Does not include sales of Chinese development sites. Transaction Volume ($ billions) |
|
|
Data is Limited, but Cap Rates Recovering Average Quarterly Cap Rates By Region Source: Real Capital Analytics (October 2010). * Cap rates for commercial properties only. |
|
|
Prime Cap Rates: London/Paris vs. NY/DC Source: RCA, October 2010 |
|
|
Global Capital Value Trends % change per annum Source: CB Richard Ellis, NCREIF -40% -30% -20% -10% 0% 10% 20% 30% 40% 50% 2002 Q1 2002 Q3 2003 Q1 2003 Q3 2004 Q1 2004 Q3 2005 Q1 2005 Q3 2006 Q1 2006 Q3 2007 Q1 2007 Q3 2008 Q1 2008 Q3 2009 Q1 2009 Q3 2010 Q1 2010 Q3 Asia Pacific EMEA USA Global |
|
|
Global Rental Trends % change per annum Source: CB Richard Ellis -30% -20% -10% 0% 10% 20% 30% 2002 Q1 2002 Q3 2003 Q1 2003 Q3 2004 Q1 2004 Q3 2005 Q1 2005 Q3 2006 Q1 2006 Q3 2007 Q1 2007 Q3 2008 Q1 2008 Q3 2009 Q1 2009 Q3 2010 Q1 2010 Q3 Asia Pacific EMEA Americas Global |
|
|
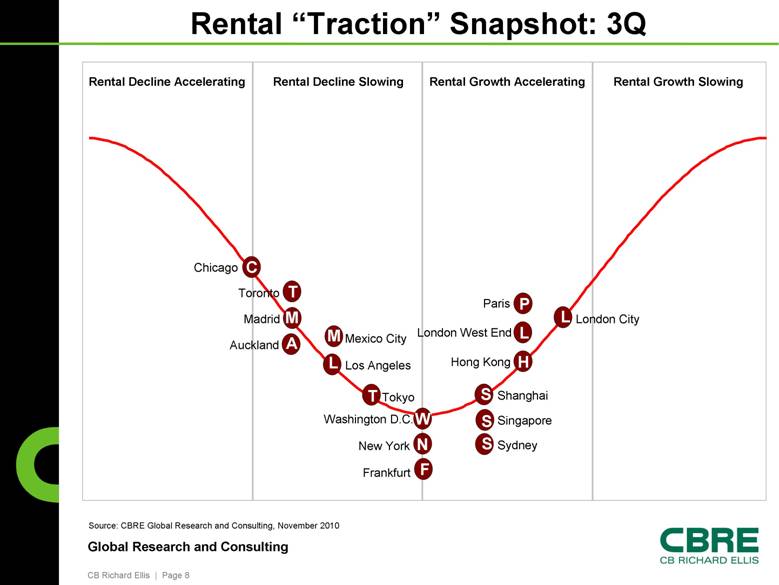
Rental “Traction” Snapshot: 3Q Source: CBRE Global Research and Consulting, November 2010 Washington D.C. S S Frankfurt F F Shanghai N N New York T T Toronto C C Chicago A A Auckland W W Paris S S P P M M Mexico City Singapore Madrid M M S S Los Angeles L L Sydney Tokyo T T L L London City London West End L L H H Hong Kong Rental Decline Accelerating Rental Decline Slowing Rental Growth Accelerating Rental Growth Slowing |
|
|
Limits on US Supply Push Office Vacancy Downward Source: CBRE-EA Outlook, Winter 2011 8 10 12 14 16 18 20 - 150,000 - 100,000 - 50,000 0 50,000 100,000 150,000 1990 1991 1992 1993 1994 1995 1996 1997 1998 1999 2000 2001 2002 2003 2004 2005 2006 2007 2008 2009 2010 2011 2012 2013 2014 2015 Completions Net Absorption Vacancy Rate Net Absorption & Completions, sqft x 1,000 Vacancy Rate, % Forecast |
|
|
Similar Story in EU Office Market Source: CBRE-EA Outlook, Fall 2010 3 4 5 6 7 8 9 10 - 1,000 0 1,000 2,000 3,000 4,000 5,000 6,000 7,000 Completions Net Absorption Vacancy Rate Net Absorption & Completions Vacancy Rate, % Forecast |
|
|
The Private Sector is Adding Jobs Source: Bureau of Labor Statistics - 1000 - 800 - 600 - 400 - 200 0 200 400 600 Jan-08 Feb-08 Mar-08 Apr-08 May-08 Jun-08 Jul-08 Aug-08 Sep-08 Oct-08 Nov-08 Dec-08 Jan-09 Feb-09 Mar-09 Apr-09 May-09 Jun-09 Jul-09 Aug-09 Sep-09 Oct-09 Nov-09 Dec-09 Jan-10 Feb-10 Mar-10 Apr-10 May-10 Jun-10 Jul-10 Aug-10 Sep-10 Oct-10 Private Sector Employment Census, State and Local Government Employment Change in Employment (x1000) |
|
|
But a Long Recovery to Former Health Source: Bureau of Labor Statistics, CBRE Econometric Advisors (September, 2010). Employment, % Change From Peak Months from Start of Recession And This is Optimistic!! |
|
|
Vacancy at 3Q 44.2/ 2001 Hotels* 30.6 6.7 / 2003 5.7 Multifamily 11.4 / 1992 13.0 Retail 11.8 / 2004 14.0 Industrial 17.0 / 2003 16.7 / 2010 Office Previous Peak Year 2010Q3 Vacancy and Availability Rates Peak/Year 16.6 14.1 / 2010 13.1 / 2010 7.5 / 2009 42.7 / 2009 Sources: CBRE-EA Winter 2011 Outlook *Full service only |
|
|
Economic Rent by Property Type: Past & Future Economic Rent Growth (%) History Forecast 2007q4 – 2010q2 2010q2 – 2012q2 (Base case) 2010q2 – 2012q2 (Double Dip) Office -14.3 4.5 -4.6 Industrial -17.6 2.4 -3.0 Multi-Housing -4.7 5.6 1.4 Retail -12.7 0.1-5.4 |