Exhibit 99.5
|
|
Global Investment Management Vance Maddocks CEO CBRE Investors |
Exhibit 99.5
|
|
Global Investment Management Vance Maddocks CEO CBRE Investors |
|
|
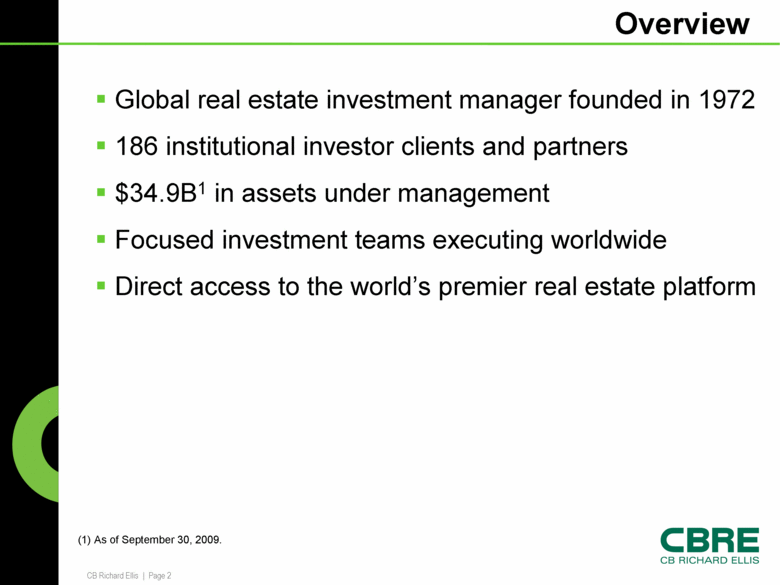
Overview (1) As of September 30, 2009. Global real estate investment manager founded in 1972 186 institutional investor clients and partners $34.9B1 in assets under management Focused investment teams executing worldwide Direct access to the world’s premier real estate platform |
|
|
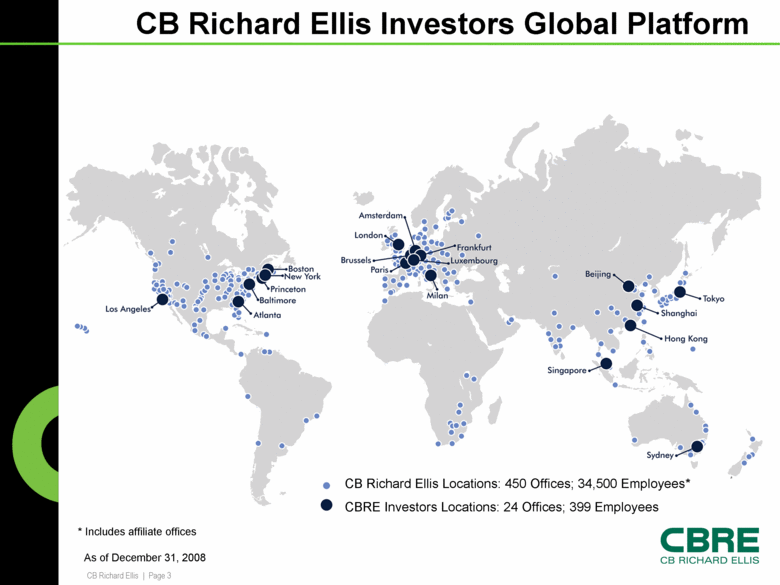
CB Richard Ellis Investors Global Platform * Includes affiliate offices As of December 31, 2008 CB Richard Ellis Locations: 450 Offices; 34,500 Employees* CBRE Investors Locations: 24 Offices; 399 Employees |
|
|
Strategic Vision Positioning CBRE Investors to succeed as the real estate investment management industry resets Maximize PERFORMANCE for our existing portfolio World class LEADERS Disciplined RISK MANAGEMENT Consistent performance for INVESTORS Exceptional REAL ESTATE investment execution Strategic RELATIONSHIPS with capital sources Capitalize on the LARGEST market opportunities Industry leading investor COMMUNICATION Capitalizing on our affiliation with CBRE |
|
|
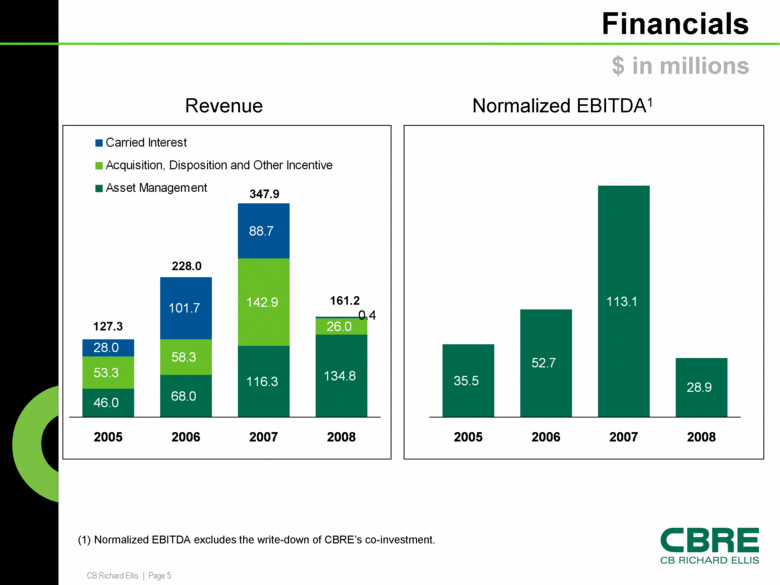
Financials 161.2 228.0 127.3 347.9 Revenue Normalized EBITDA1 $ in millions (1) Normalized EBITDA excludes the write-down of CBRE’s co-investment. 46.0 68.0 116.3 134.8 53.3 58.3 142.9 26.0 28.0 88.7 101.7 0.4 2005 2006 2007 2008 Carried Interest Acquisition, Disposition and Other Incentive Asset Management 35.5 52.7 113.1 28.9 2005 2006 2007 2008 |
|
|
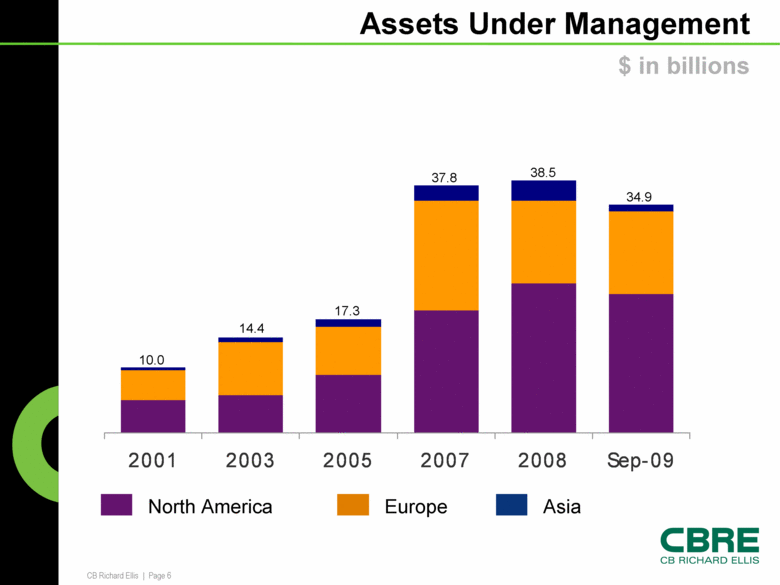
Assets Under Management 10.0 14.4 17.3 37.8 38.5 Asia North America Europe 34.9 $ in billions 2001 2003 2005 2007 2008 Sep-09 |
|
|
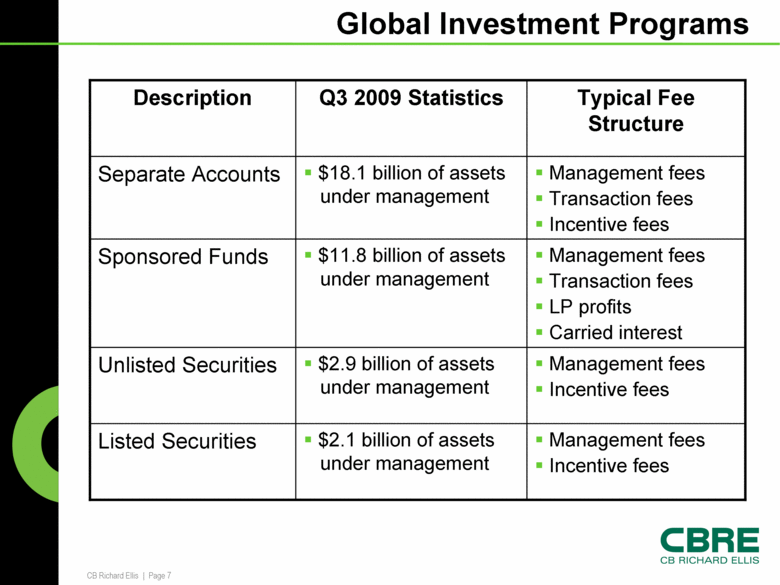
Global Investment Programs Management fees Transaction fees LP profits Carried interest $11.8 billion of assets under management Sponsored Funds Management fees Incentive fees $2.1 billion of assets under management Listed Securities Management fees Incentive fees $2.9 billion of assets under management Unlisted Securities Management fees Transaction fees Incentive fees $18.1 billion of assets under management Separate Accounts Typical Fee Structure Q3 2009 Statistics Description |
|
|
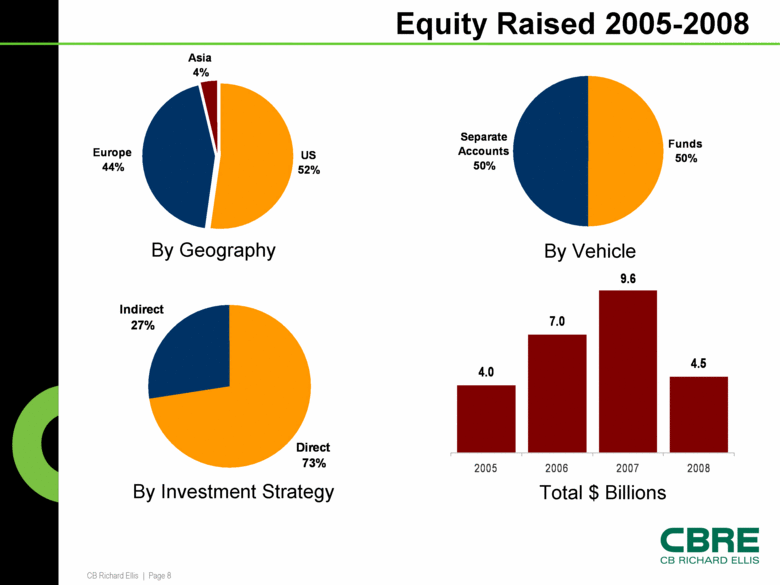
Equity Raised 2005-2008 By Investment Strategy By Geography By Vehicle Total $ Billions Direct 73% Indirect 27% 4.0 7.0 9.6 4.5 2005 2006 2007 2008 Funds 50% Separate Accounts 50% US 52% Europe 44% Asia 4% |
|
|
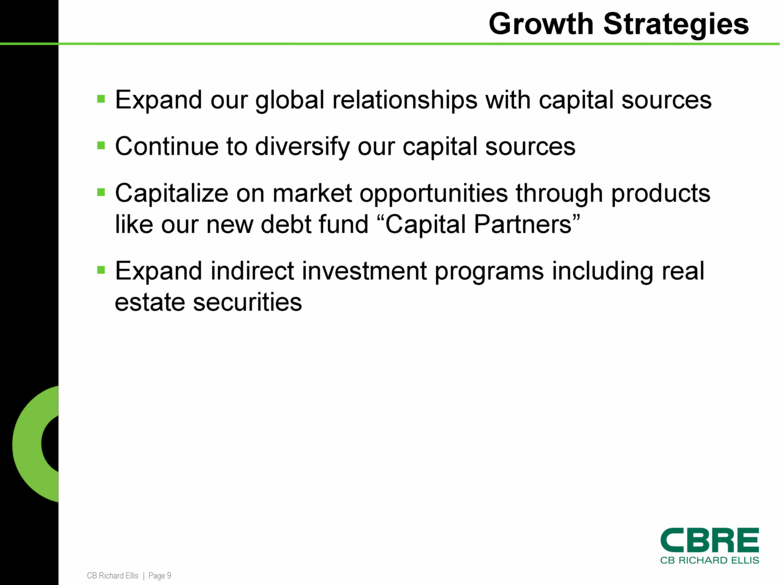
Growth Strategies Expand our global relationships with capital sources Continue to diversify our capital sources Capitalize on market opportunities through products like our new debt fund “Capital Partners” Expand indirect investment programs including real estate securities |
|
|
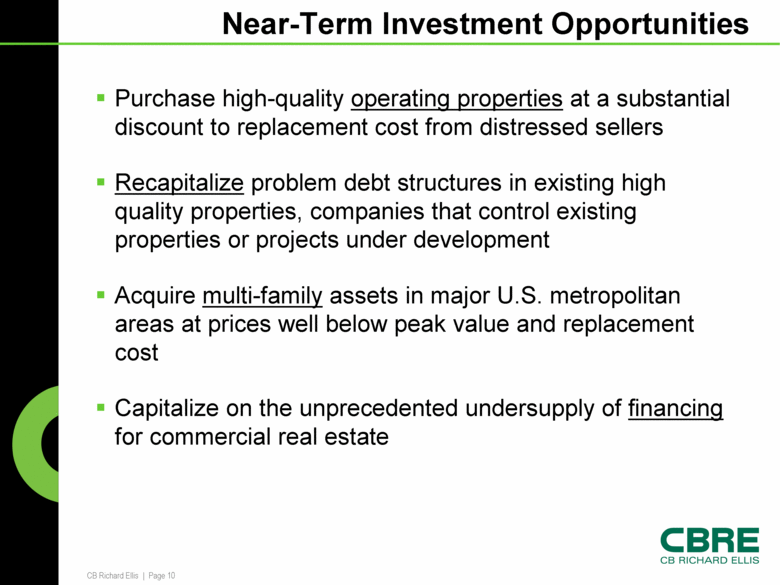
Near-Term Investment Opportunities Purchase high-quality operating properties at a substantial discount to replacement cost from distressed sellers Recapitalize problem debt structures in existing high quality properties, companies that control existing properties or projects under development Acquire multi-family assets in major U.S. metropolitan areas at prices well below peak value and replacement cost Capitalize on the unprecedented undersupply of financing for commercial real estate |