Exhibit 99.1
|
|
Operational & Financial Overview Bob Sulentic Group President & Chief Financial Officer |
Exhibit 99.1
|
|
Operational & Financial Overview Bob Sulentic Group President & Chief Financial Officer |
|
|
Forward Looking Statements This presentation contains statements that are forward looking within the meaning of the Private Securities Litigation Reform Act of 1995, including statements regarding our momentum in 2009, future operations and future financial performance. These statements should be considered as estimates only and actual results may ultimately differ from these estimates. Except to the extent required by applicable securities laws, we undertake no obligation to update or publicly revise any of the forward-looking statements that you may hear today. Please refer to our current annual report on Form 10-K and our current quarterly report on Form 10-Q, in particular any discussion of Risk Factors, which are filed with the SEC and available at the SEC’s website (http://www.sec.gov), for a full discussion of the risks and other factors that may impact any estimates that you may hear today. We may make certain statements during the course of this presentation which include references to “non-GAAP financial measures,” as defined by SEC regulations. As required by these regulations, we have provided reconciliations of these measures to what we believe are the most directly comparable GAAP measures, which are attached hereto within the appendix. |
|
|
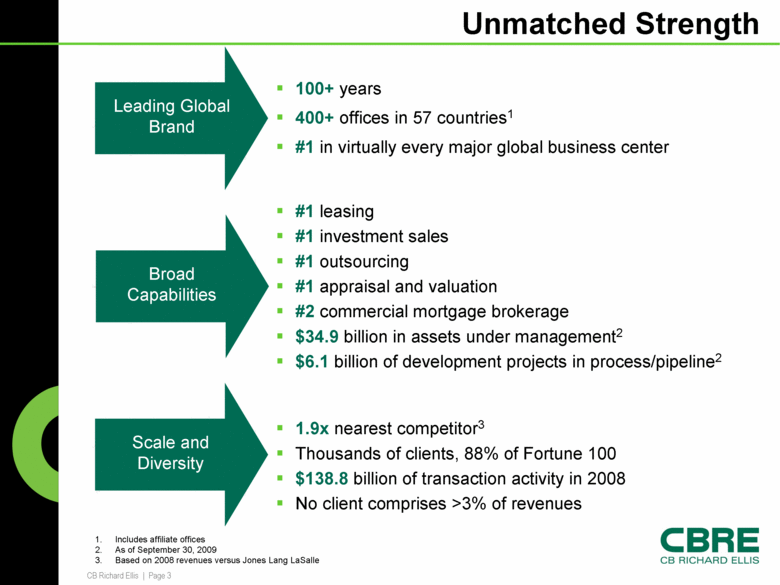
Unmatched Strength 1. Includes affiliate offices 2. As of September 30, 2009 3. Based on 2008 revenues versus Jones Lang LaSalle Scale and Diversity 1.9x nearest competitor3 Thousands of clients, 88% of Fortune 100 $138.8 billion of transaction activity in 2008 No client comprises >3% of revenues Broad Capabilities #1 leasing #1 investment sales #1 outsourcing #1 appraisal and valuation #2 commercial mortgage brokerage $34.9 billion in assets under management2 $6.1 billion of development projects in process/pipeline2 Leading Global Brand 100+ years 400+ offices in 57 countries1 #1 in virtually every major global business center |
|
|
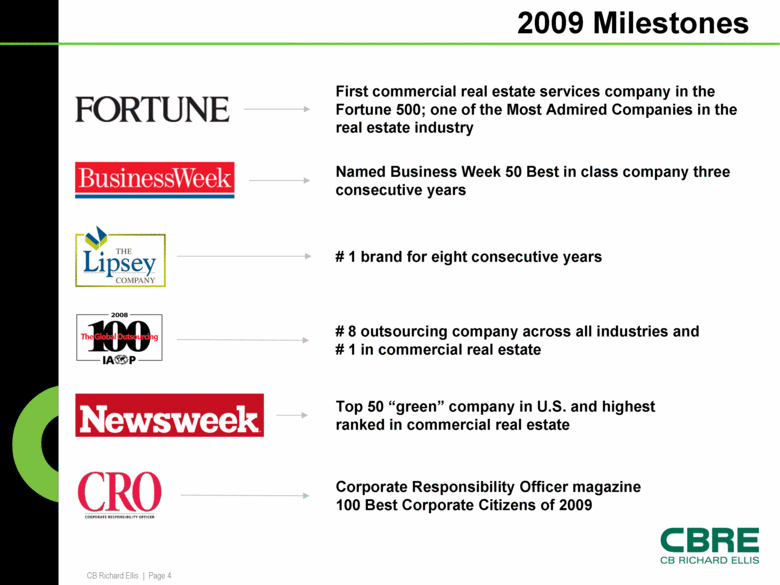
2009 Milestones # 8 outsourcing company across all industries and # 1 in commercial real estate # 1 brand for eight consecutive years First commercial real estate services company in the Fortune 500; one of the Most Admired Companies in the real estate industry Corporate Responsibility Officer magazine 100 Best Corporate Citizens of 2009 Named Business Week 50 Best in class company three consecutive years Top 50 “green” company in U.S. and highest ranked in commercial real estate |
|
|
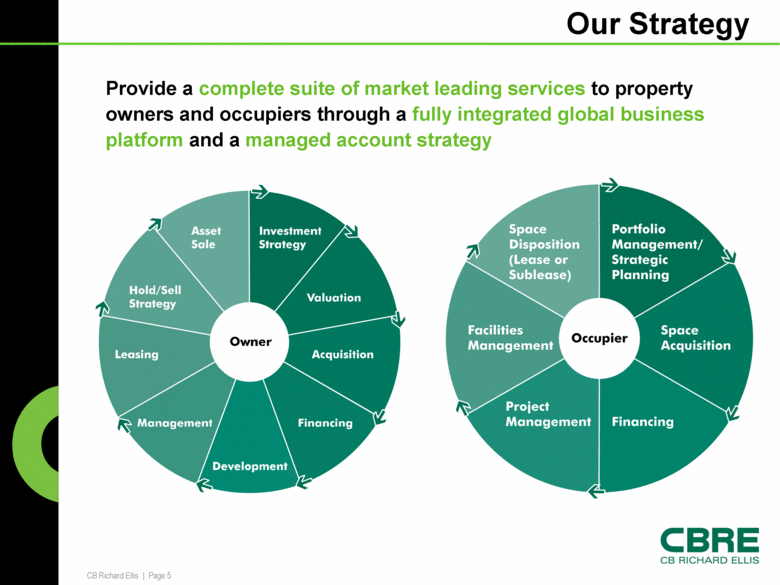
Our Strategy Provide a complete suite of market leading services to property owners and occupiers through a fully integrated global business platform and a managed account strategy Asset Sale Investment Strategy Valuation Acquisition Financing Development Management Leasing Hold/Sell Strategy Space Disposition (Lease or Sublease) Portfolio Management/Strategic Planning Space Acquisition Financing Project Management Facilities Management Facilities Management |
|
|
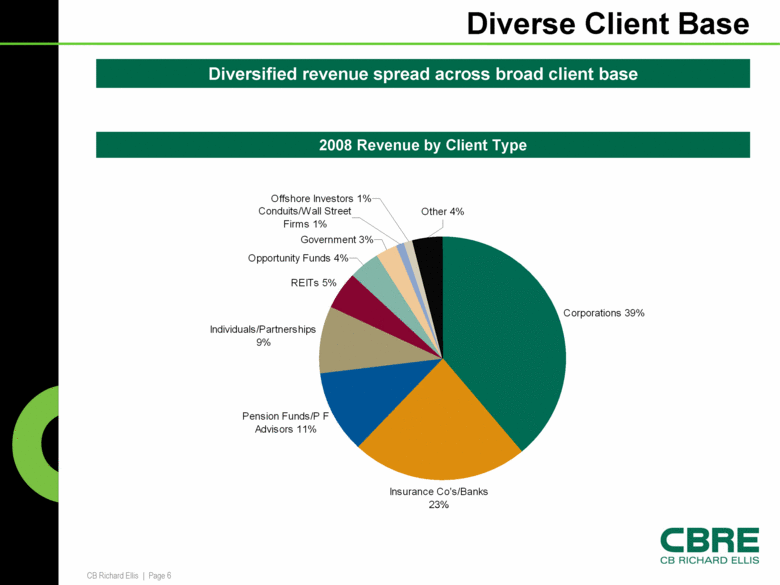
Diverse Client Base Diversified revenue spread across broad client base 2008 Revenue by Client Type Corporations 39% Insurance Co's/Banks 23% Pension Funds/P F Advisors 11% Individuals/Partnerships 9% REITs 5% Opportunity Funds 4% Government 3% Conduits/Wall Street Firms 1% Offshore Investors 1% Other 4% |
|
|
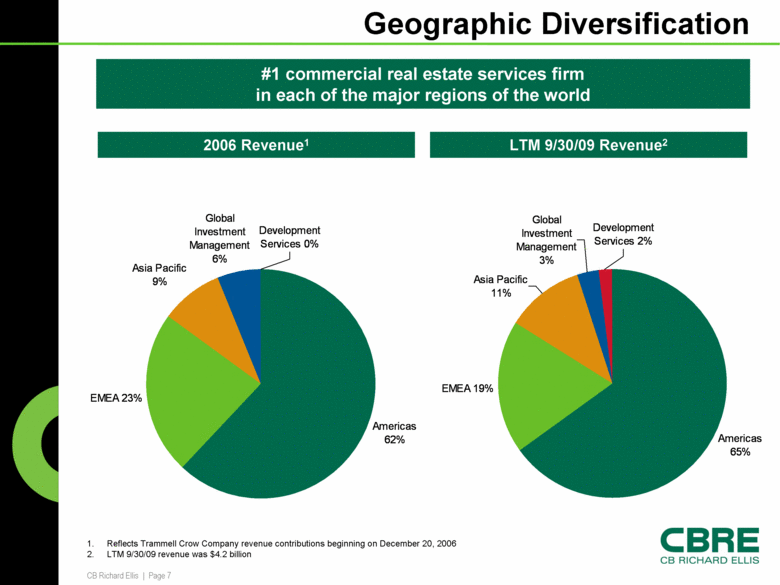
Geographic Diversification 1. Reflects Trammell Crow Company revenue contributions beginning on December 20, 2006 2. LTM 9/30/09 revenue was $4.2 billion #1 commercial real estate services firm in each of the major regions of the world LTM 9/30/09 Revenue2 2006 Revenue1 Americas 62% EMEA 23% Asia Pacific 9% Global Investment Management 6% Development Services 0% Americas 65% EMEA 19% Asia Pacific 11% Global Investment Management 3% Development Services 2% |
|
|
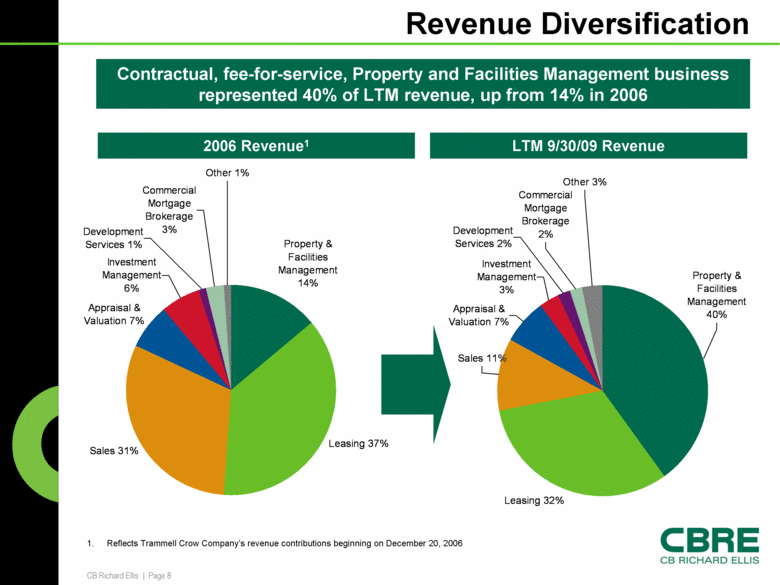
Revenue Diversification LTM 9/30/09 Revenue 2006 Revenue1 1. Reflects Trammell Crow Company’s revenue contributions beginning on December 20, 2006 Contractual, fee-for-service, Property and Facilities Management business represented 40% of LTM revenue, up from 14% in 2006 Leasing 32% Appraisal & Valuation 7% Investment Management 3% Property & Facilities Management 40% Sales 11% Development Services 2% Commercial Mortgage Brokerage 2% Other 3% Property & Facilities Management 14% Leasing 37% Sales 31% Appraisal & Valuation 7% Investment Management 6% Development Services 1% Commercial Mortgage Brokerage 3% Other 1% |
|
|
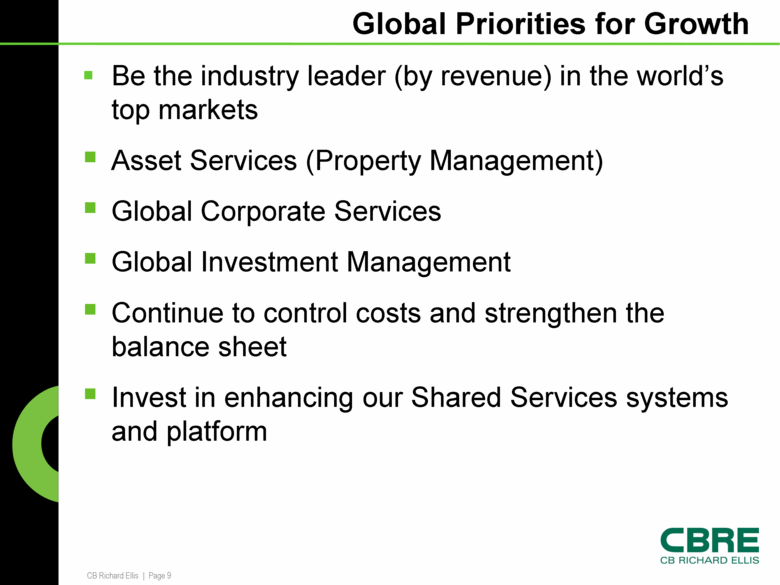
Be the industry leader (by revenue) in the world’s top markets Asset Services (Property Management) Global Corporate Services Global Investment Management Continue to control costs and strengthen the balance sheet Invest in enhancing our Shared Services systems and platform Global Priorities for Growth |
|
|
Financial Performance |
|
|
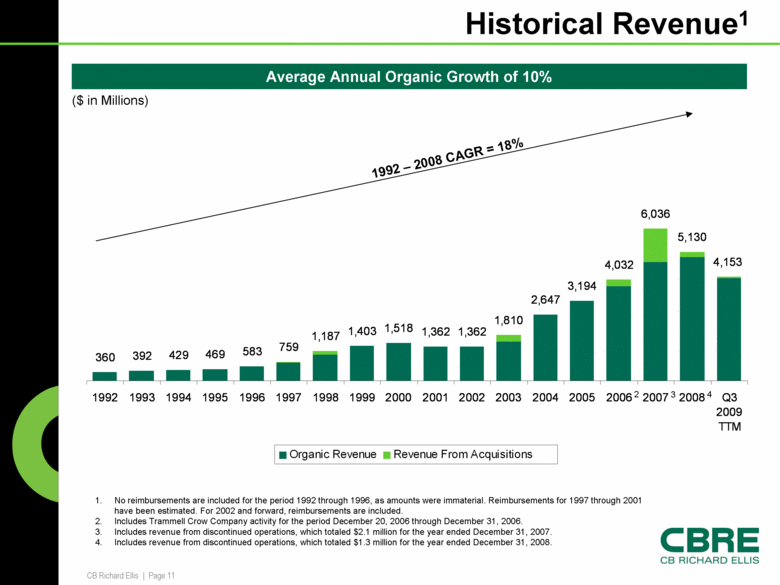
Historical Revenue1 ($ in Millions) 1. No reimbursements are included for the period 1992 through 1996, as amounts were immaterial. Reimbursements for 1997 through 2001 have been estimated. For 2002 and forward, reimbursements are included. 2. Includes Trammell Crow Company activity for the period December 20, 2006 through December 31, 2006. 3. Includes revenue from discontinued operations, which totaled $2.1 million for the year ended December 31, 2007. 4. Includes revenue from discontinued operations, which totaled $1.3 million for the year ended December 31, 2008. 2 3 4 1992 – 2008 CAGR = 18% Average Annual Organic Growth of 10% 360 392 429 469 583 759 1,187 1,403 1,518 1,362 1,362 1,810 2,647 3,194 4,032 6,036 5,130 4,153 1992 1993 1994 1995 1996 1997 1998 1999 2000 2001 2002 2003 2004 2005 2006 2007 2008 Q3 2009 TTM Organic Revenue Revenue From Acquisitions |
|
|
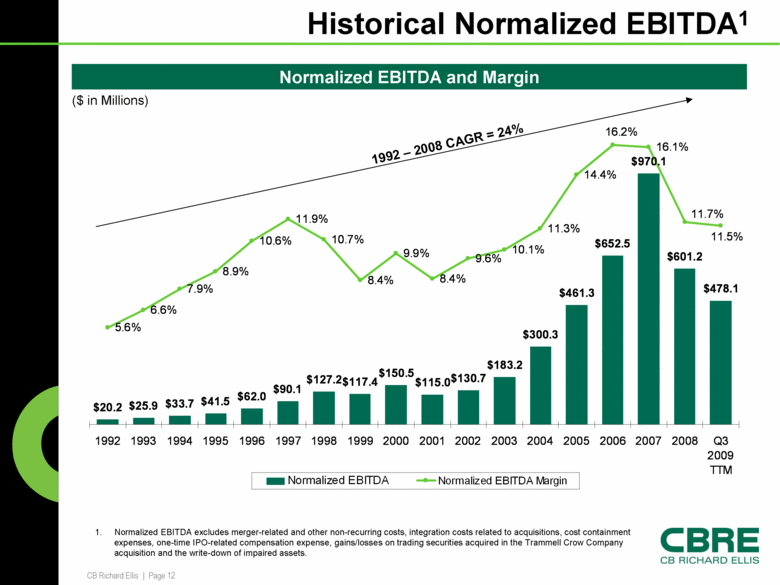
Historical Normalized EBITDA1 ($ in Millions) 1. Normalized EBITDA excludes merger-related and other non-recurring costs, integration costs related to acquisitions, cost containment expenses, one-time IPO-related compensation expense, gains/losses on trading securities acquired in the Trammell Crow Company acquisition and the write-down of impaired assets. Normalized EBITDA and Margin 1992 – 2008 CAGR = 24% $20.2 $25.9 $33.7 $41.5 $62.0 $90.1 $127.2 $117.4 $150.5 $115.0 $130.7 $183.2 $300.3 $461.3 $652.5 $970.1 $601.2 $478.1 5.6% 6.6% 7.9% 8.9% 10.6% 11.9% 10.7% 8.4% 9.9% 8.4% 9.6% 10.1% 11.3% 14.4% 16.1% 16.2% 11.7% 11.5% 1992 1993 1994 1995 1996 1997 1998 1999 2000 2001 2002 2003 2004 2005 2006 2007 2008 Q3 2009 TTM Normalized EBITDA Normalized EBITDA Margin |
|
|
Americas Business Overview |
|
|
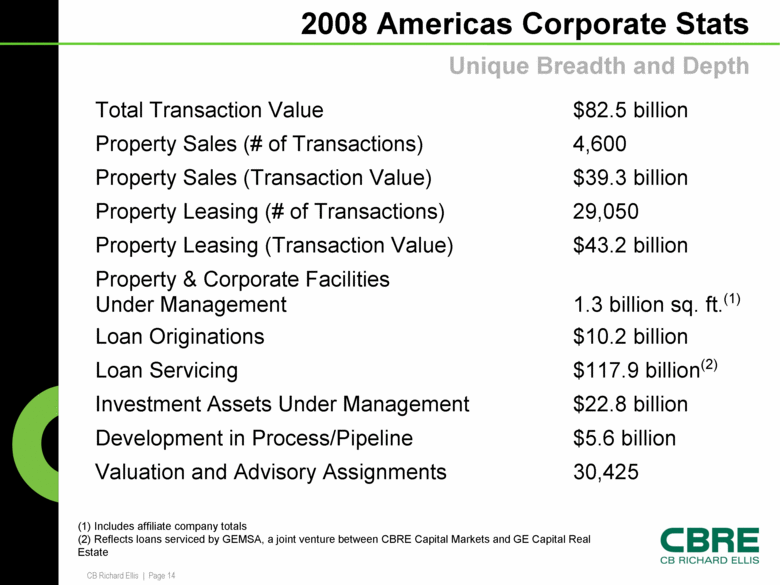
2008 Americas Corporate Stats Total Transaction Value $82.5 billion Property Sales (# of Transactions) 4,600 Property Sales (Transaction Value) $39.3 billion Property Leasing (# of Transactions) 29,050 Property Leasing (Transaction Value) $43.2 billion Property & Corporate Facilities Under Management 1.3 billion sq. ft.(1) Loan Originations $10.2 billion Loan Servicing $117.9 billion(2) Investment Assets Under Management $22.8 billion Development in Process/Pipeline $5.6 billion Valuation and Advisory Assignments 30,425 Unique Breadth and Depth (1) Includes affiliate company totals (2) Reflects loans serviced by GEMSA, a joint venture between CBRE Capital Markets and GE Capital Real Estate |
|
|
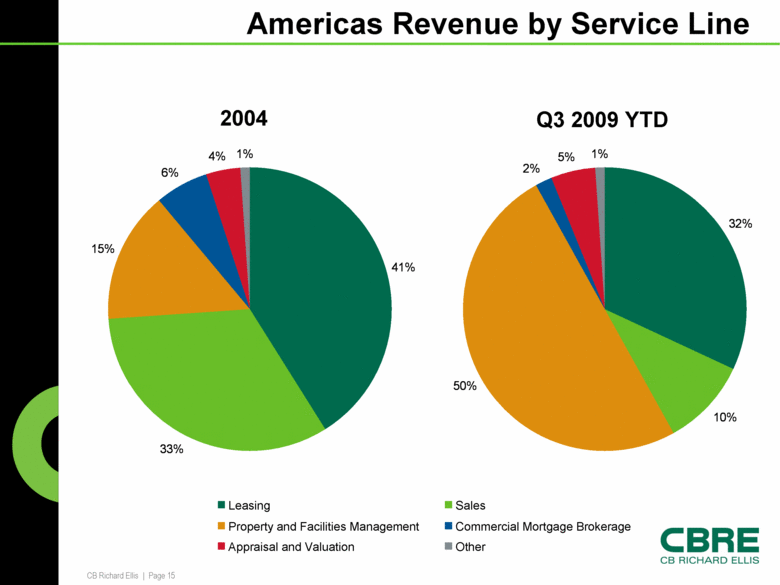
Americas Revenue by Service Line 2004 Q3 2009 YTD Leasing Sales Property and Facilities Management Commercial Mortgage Brokerage Appraisal and Valuation Other 41% 33% 15% 6% 4% 1% 32% 10% 50% 2% 5% 1% |
|
|
EMEA Business Overview |
|
|
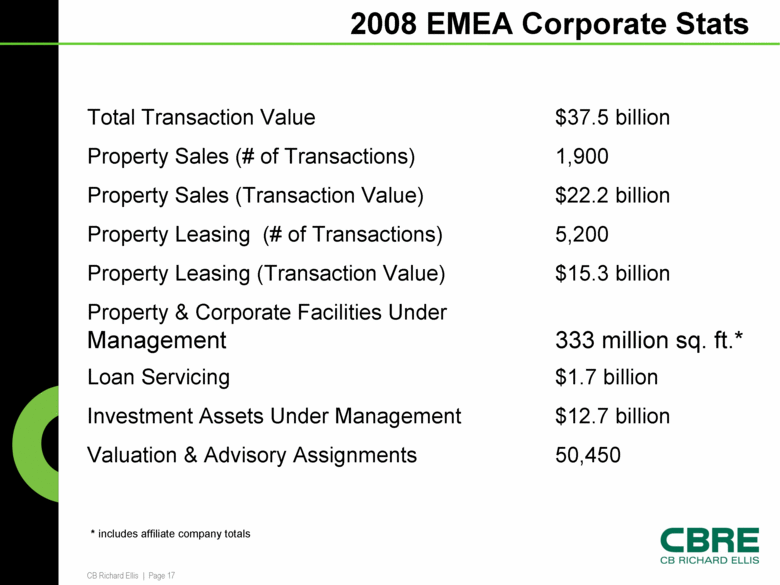
2008 EMEA Corporate Stats Total Transaction Value $37.5 billion Property Sales (# of Transactions) 1,900 Property Sales (Transaction Value) $22.2 billion Property Leasing (# of Transactions) 5,200 Property Leasing (Transaction Value) $15.3 billion Property & Corporate Facilities Under Management 333 million sq. ft.* Loan Servicing $1.7 billion Investment Assets Under Management $12.7 billion Valuation & Advisory Assignments 50,450 * includes affiliate company totals |
|
|
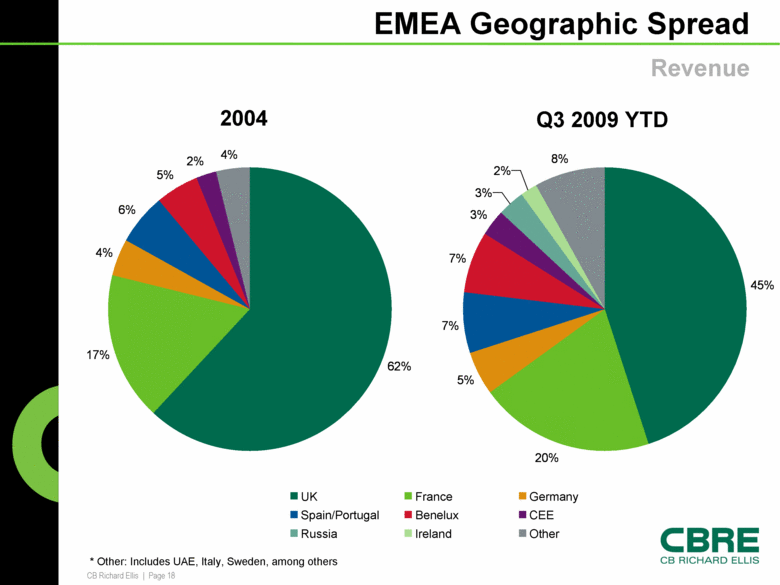
EMEA Geographic Spread * Other: Includes UAE, Italy, Sweden, among others Revenue 2004 Q3 2009 YTD UK France Germany Spain/Portugal Benelux CEE Russia Ireland Other 62% 17% 4% 6% 5% 2% 4% 45% 20% 5% 7% 7% 3% 3% 2% 8% |
|
|
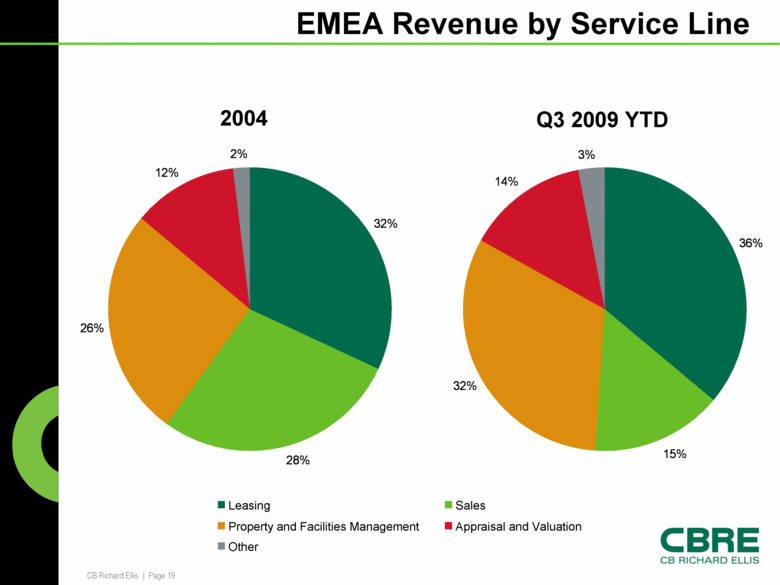
EMEA Revenue by Service Line 2004 Q3 2009 YTD Leasing Sales Property and Facilities Management Appraisal and Valuation Other 32% 28% 26% 12% 2% 36% 15% 32% 14% 3% |
|
|
Asia Pacific Business Overview |
|
|
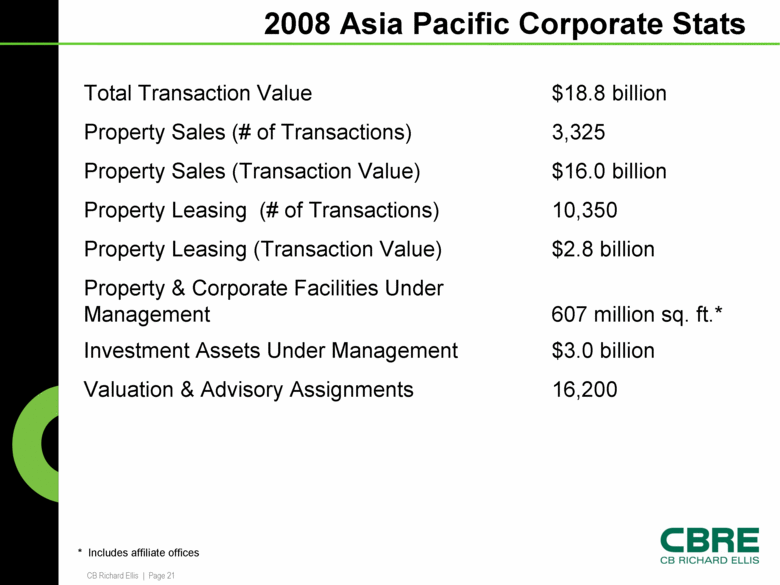
2008 Asia Pacific Corporate Stats * Includes affiliate offices Total Transaction Value $18.8 billion Property Sales (# of Transactions) 3,325 Property Sales (Transaction Value) $16.0 billion Property Leasing (# of Transactions) 10,350 Property Leasing (Transaction Value) $2.8 billion Property & Corporate Facilities Under Management 607 million sq. ft.* Investment Assets Under Management $3.0 billion Valuation & Advisory Assignments 16,200 |
|
|
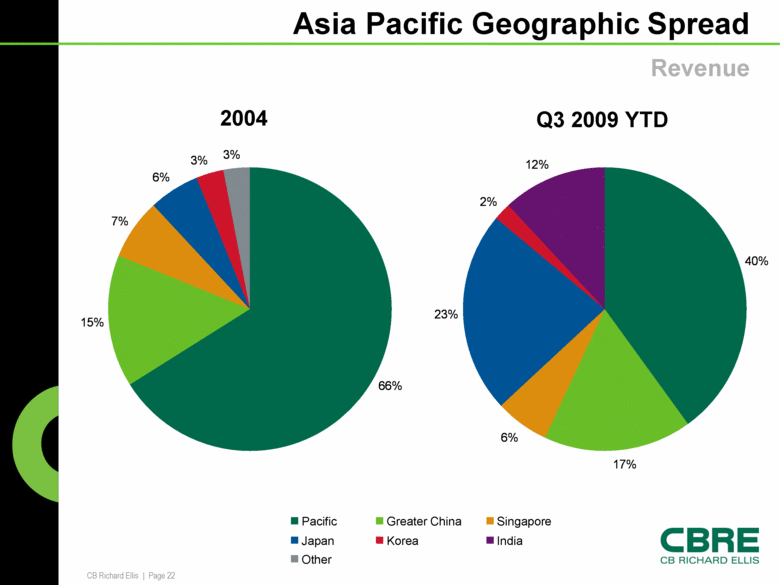
Asia Pacific Geographic Spread Revenue 2004 Q3 2009 YTD Pacific Greater China Singapore Japan Korea India Other 66% 15% 7% 3% 3% 6% 40% 17% 6% 2% 12% 23% |
|
|
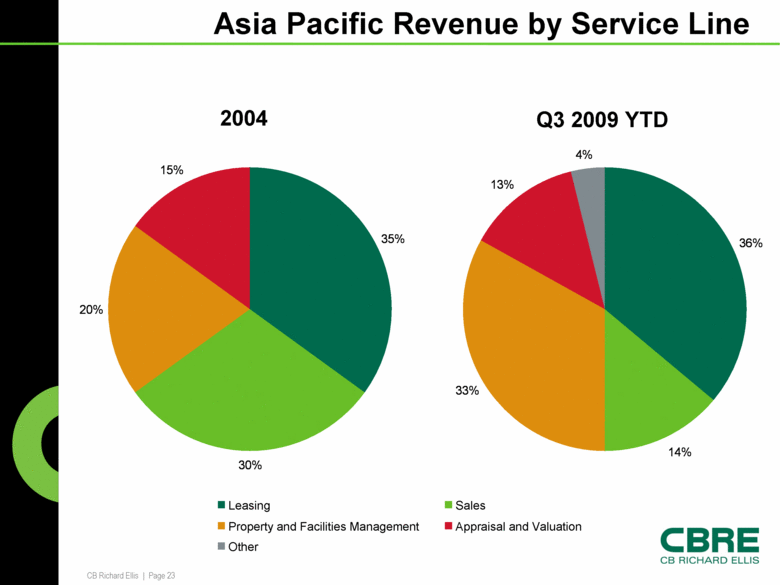
Asia Pacific Revenue by Service Line 2004 Q3 2009 YTD Leasing Sales Property and Facilities Management Appraisal and Valuation Other 35% 30% 20% 15% 36% 14% 33% 13% 4% |
|
|
Appendix |
|
|
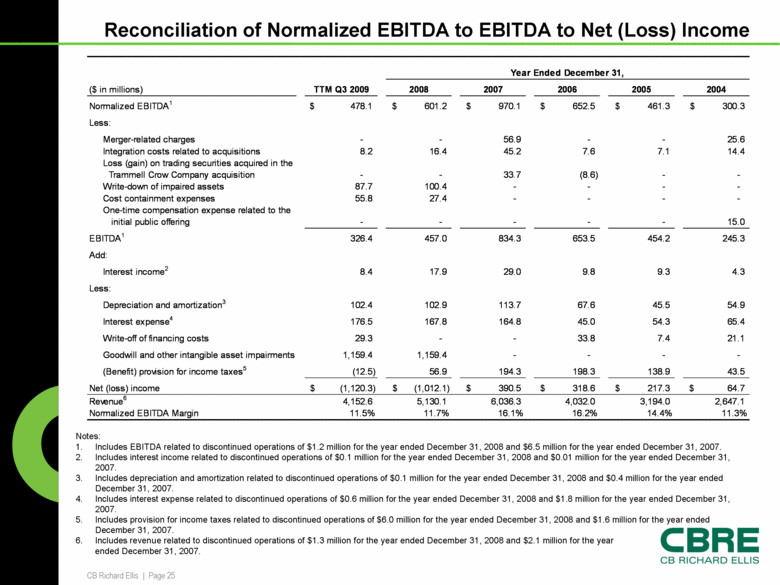
Reconciliation of Normalized EBITDA to EBITDA to Net (Loss) Income Notes: Includes EBITDA related to discontinued operations of $1.2 million for the year ended December 31, 2008 and $6.5 million for the year ended December 31, 2007. Includes interest income related to discontinued operations of $0.1 million for the year ended December 31, 2008 and $0.01 million for the year ended December 31, 2007. Includes depreciation and amortization related to discontinued operations of $0.1 million for the year ended December 31, 2008 and $0.4 million for the year ended December 31, 2007. Includes interest expense related to discontinued operations of $0.6 million for the year ended December 31, 2008 and $1.8 million for the year ended December 31, 2007. Includes provision for income taxes related to discontinued operations of $6.0 million for the year ended December 31, 2008 and $1.6 million for the year ended December 31, 2007. Includes revenue related to discontinued operations of $1.3 million for the year ended December 31, 2008 and $2.1 million for the year ended December 31, 2007. (Benefit) provision for income taxes5 Reconciliation of Normalized EBITDA to EBITDA to Net Income (Loss) Year Ended December 31, ($ in millions) TTM Q3 2009 2008 2007 2006 2005 2004 2003 Normalized EBITDA1 $478.1 $601.2 $970.1 $652.5 $461.3 $300.3 $183.2 Less: Merger-related charges - - 56.9 - - 25.6 36.8 Integration costs related to acquisitions 8.2 16.4 45.2 7.6 7.1 14.4 13.6 Loss (gain) on trading securities acquired in the Trammell Crow Company acquisition - - 33.7 (8.6) - - - Write-down of impaired assets 87.7 100.4 - - - - - Cost containment expenses 55.8 27.4 - - - - - One-time compensation expense related to the initial public offering - - - - - 15.0 - EBITDA1 326.4 457.0 834.3 653.5 454.2 245.3 132.8 Add: Interest income2 8.4 17.9 29.0 9.8 9.3 4.3 3.8 Less: Depreciation and amortization3 102.4 102.9 113.7 67.6 45.5 54.9 92.8 Interest expense4 176.5 167.8 164.8 45.0 54.3 65.4 71.3 Write-off of financing costs 29.3 - - 33.8 7.4 21.1 13.5 Goodwill and other intangible asset impairments 1,159.4 1,159.4 - - - - - (Benefit) provision for income taxes5 (12.5) 56.9 194.3 198.3 138.9 43.5 (6.3) Net (loss) income $(1,120.3) $(1,012.1) $390.5 $318.6 $217.3 $64.7 $(34.7) Revenue6 4,152.6 5,130.1 6,036.3 4,032.0 3,194.0 2,647.1 1,810.1 Normalized EBITDA Margin 11.5% 11.7% 16.1% 16.2% 14.4% 11.3% 10.1% |