Exhibit 99.1
|
|
CB Richard Ellis Group, Inc. Investor Presentation August 2009 |

Exhibit 99.1
|
|
CB Richard Ellis Group, Inc. Investor Presentation August 2009 |
|
|
Forward Looking Statements This presentation contains statements that are forward looking within the meaning of the Private Securities Litigation Reform Act of 1995, including statements regarding our momentum in 2009, future operations and future financial performance. These statements should be considered as estimates only and actual results may ultimately differ from these estimates. Except to the extent required by applicable securities laws, we undertake no obligation to update or publicly revise any of the forward-looking statements that you may hear today. Please refer to our current annual report on Form 10-K and our current quarterly report on Form 10-Q, in particular any discussion of Risk Factors, which are filed with the SEC and available at the SEC’s website (http://www.sec.gov), for a full discussion of the risks and other factors that may impact any estimates that you may hear today. We may make certain statements during the course of this presentation which include references to “non-GAAP financial measures,” as defined by SEC regulations. As required by these regulations, we have provided reconciliations of these measures to what we believe are the most directly comparable GAAP measures, which are attached hereto within the appendix. |
|
|
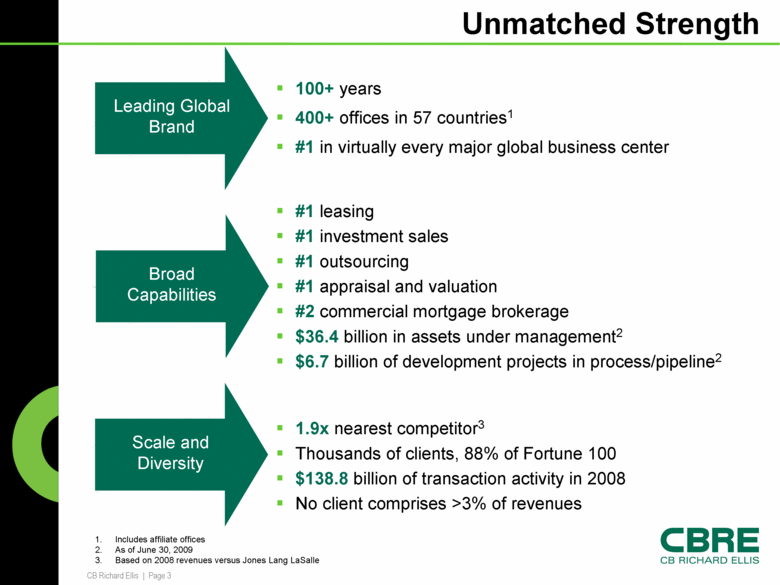
Unmatched Strength Includes affiliate offices As of June 30, 2009 Based on 2008 revenues versus Jones Lang LaSalle Scale and Diversity 1.9x nearest competitor3 Thousands of clients, 88% of Fortune 100 $138.8 billion of transaction activity in 2008 No client comprises >3% of revenues Broad Capabilities #1 leasing #1 investment sales #1 outsourcing #1 appraisal and valuation #2 commercial mortgage brokerage $36.4 billion in assets under management2 $6.7 billion of development projects in process/pipeline2 Leading Global Brand 100+ years 400+ offices in 57 countries1 #1 in virtually every major global business center |
|
|
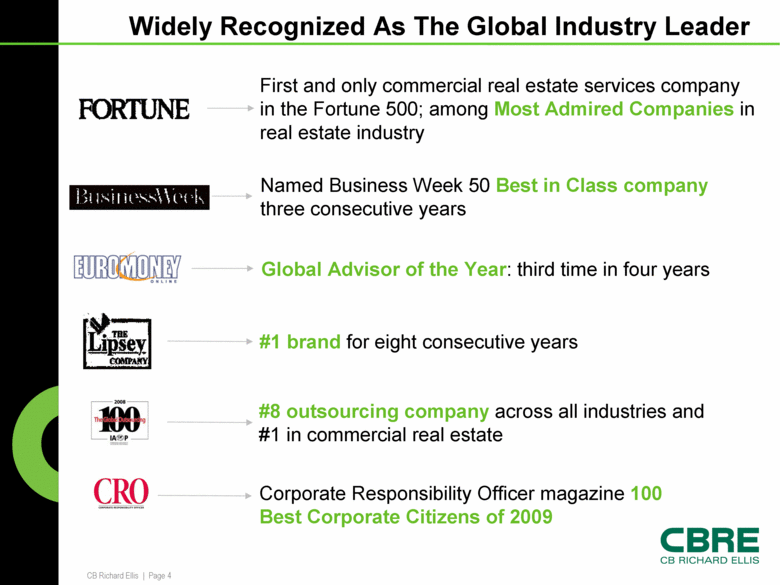
Widely Recognized As The Global Industry Leader First and only commercial real estate services company in the Fortune 500; among Most Admired Companies in real estate industry Global Advisor of the Year: third time in four years #8 outsourcing company across all industries and #1 in commercial real estate Corporate Responsibility Officer magazine 100 Best Corporate Citizens of 2009 Named Business Week 50 Best in Class company three consecutive years #1 brand for eight consecutive years |
|
|
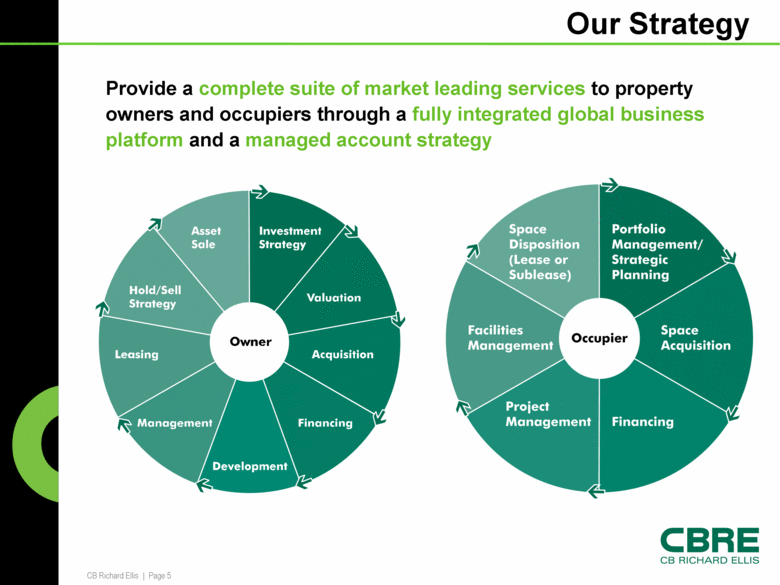
Our Strategy Provide a complete suite of market leading services to property owners and occupiers through a fully integrated global business platform and a managed account strategy |
|
|
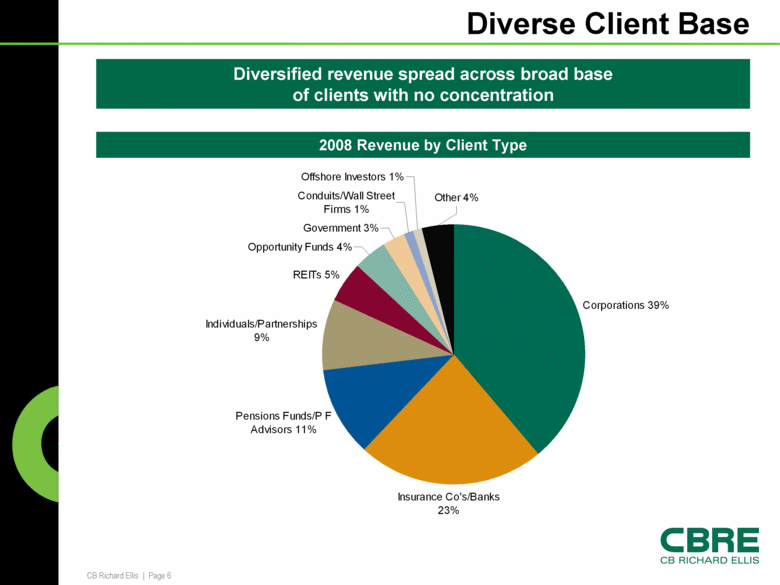
Diverse Client Base Diversified revenue spread across broad base of clients with no concentration 2008 Revenue by Client Type Corporations 39% Insurance Co's/Banks 23% Pensions Funds/P F Advisors 11% Individuals/Partnerships 9% REITs 5% Opportunity Funds 4% Government 3% Conduits/Wall Street Firms 1% Offshore Investors 1% Other 4% |
|
|
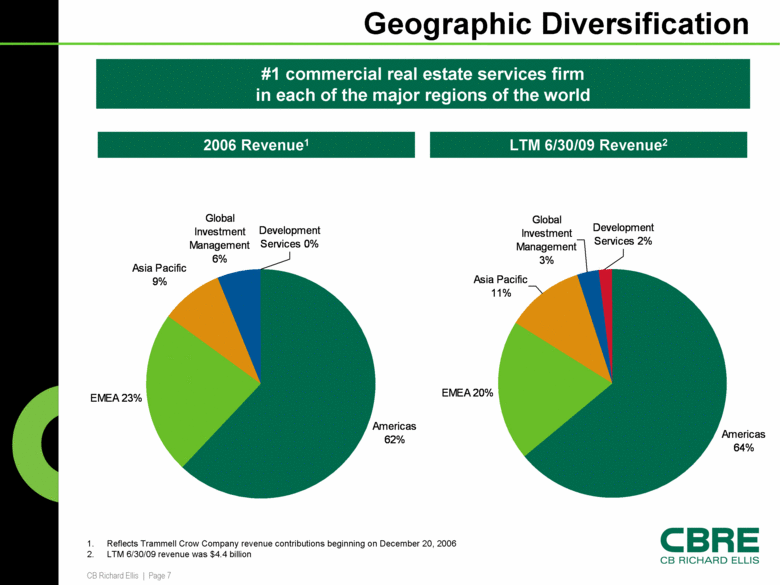
Geographic Diversification Reflects Trammell Crow Company revenue contributions beginning on December 20, 2006 LTM 6/30/09 revenue was $4.4 billion #1 commercial real estate services firm in each of the major regions of the world LTM 6/30/09 Revenue2 2006 Revenue1 Americas 62% EMEA 23% Asia Pacific 9% Global Investment Management 6% Development Services 0% Americas 64% EMEA 20% Asia Pacific 11% Global Investment Management 3% Development Services 2% |
|
|
Revenue Diversification LTM 6/30/09 Revenue 2006 Revenue1 Reflects Trammell Crow Company’s revenue contributions beginning on December 20, 2006 Contractual, fee-for-service, Property and Facilities Management business represented 38% of LTM revenue, up from 14% in 2006 Property & Facilities Management 38% Leasing 33% Appraisal & Valuation 7% Investment Management 3% Sales 13% Development Services 2% Commercial Mortgage Brokerage 2% Other 2% Property & Facilities Management 14% Leasing 37% Sales 31% Appraisal & Valuation 7% Investment Management 6% Development Services 1% Commercial Mortgage Brokerage 3% Other 1% |
|
|
Key Service Lines |
|
|
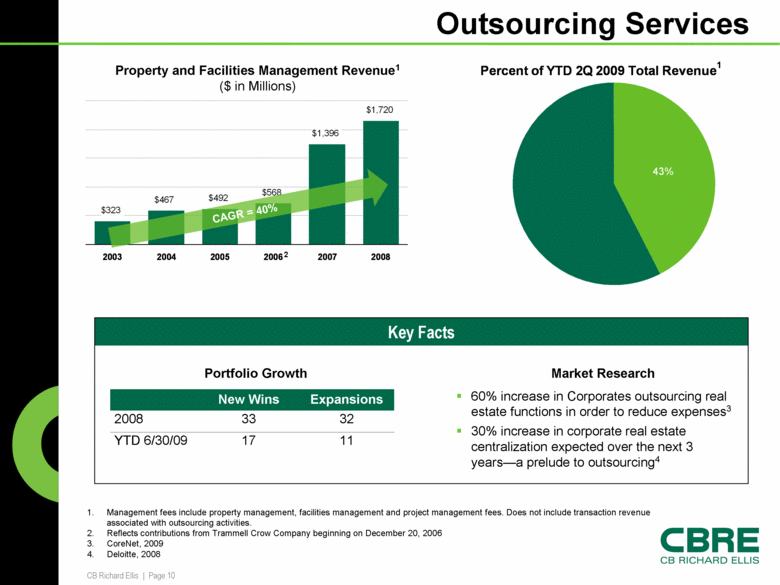
Outsourcing Services Management fees include property management, facilities management and project management fees. Does not include transaction revenue associated with outsourcing activities. Reflects contributions from Trammell Crow Company beginning on December 20, 2006 CoreNet, 2009 Deloitte, 2008 Property and Facilities Management Revenue1 ($ in Millions) CAGR = 40% 2 11 32 Expansions New Wins 2008 33 YTD 6/30/09 17 Portfolio Growth Key Facts 60% increase in Corporates outsourcing real estate functions in order to reduce expenses3 30% increase in corporate real estate centralization expected over the next 3 years—a prelude to outsourcing4 Market Research Percent of YTD 2Q 2009 Total Revenue 1 43% |
|
|
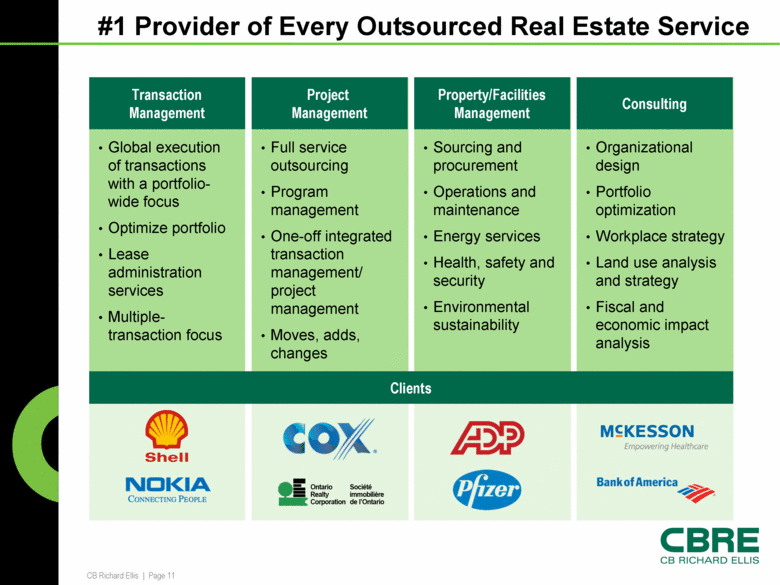
#1 Provider of Every Outsourced Real Estate Service Clients Consulting Property/Facilities Management Project Management Transaction Management Global execution of transactions with a portfolio-wide focus Optimize portfolio Lease administration services Multiple-transaction focus Full service outsourcing Program management One-off integrated transaction management/project management Moves, adds, changes Sourcing and procurement Operations and maintenance Energy services Health, safety and security Environmental sustainability Organizational design Portfolio optimization Workplace strategy Land use analysis and strategy Fiscal and economic impact analysis |
|
|
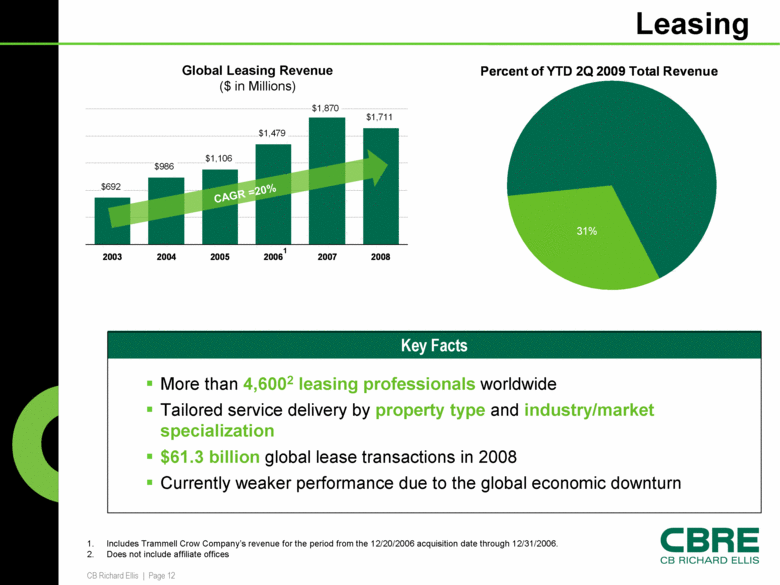
Leasing Global Leasing Revenue ($ in Millions) 1. Includes Trammell Crow Company’s revenue for the period from the 12/20/2006 acquisition date through 12/31/2006. 2. Does not include affiliate offices 1 CAGR =20% More than 4,6002 leasing professionals worldwide Tailored service delivery by property type and industry/market specialization $61.3 billion global lease transactions in 2008 Currently weaker performance due to the global economic downturn Key Facts $692 $986 $1,106 $1,479 $1,870 $1,711 2003 2004 2005 2006 2007 2008 Percent of YTD 2Q 2009 Total Revenue 31% |
|
|
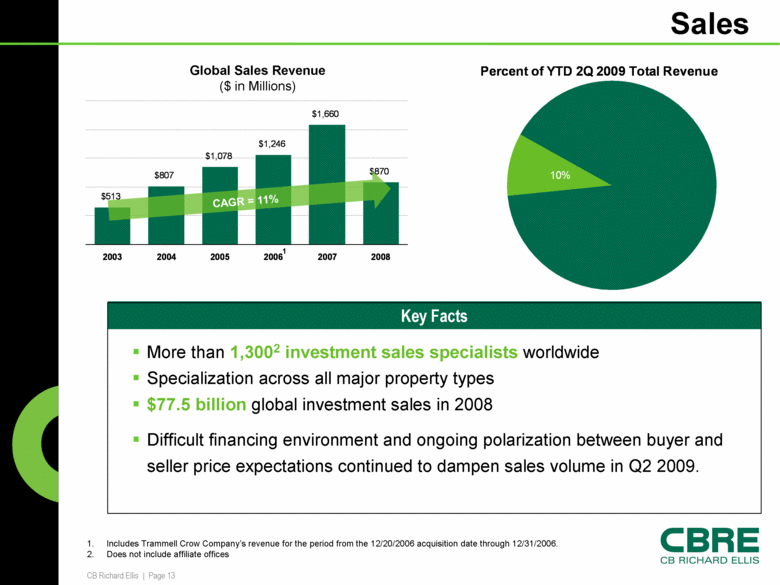
Sales Global Sales Revenue ($ in Millions) 1. Includes Trammell Crow Company’s revenue for the period from the 12/20/2006 acquisition date through 12/31/2006. 2. Does not include affiliate offices 1 CAGR = 11% Key Facts More than 1,3002 investment sales specialists worldwide Specialization across all major property types $77.5 billion global investment sales in 2008 Difficult financing environment and ongoing polarization between buyer and seller price expectations continued to dampen sales volume in Q2 2009. $513 $807 $1,078 $1,246 $1,660 $870 2003 2004 2005 2006 2007 2008 Percent of YTD 2Q 2009 Total Revenue 10% |
|
|
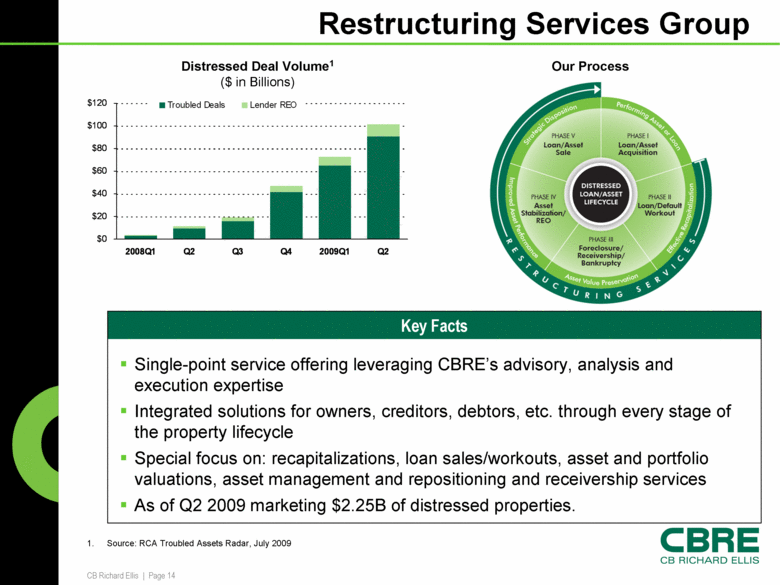
Restructuring Services Group Distressed Deal Volume1 ($ in Billions) 1. Source: RCA Troubled Assets Radar, July 2009 Our Process Single-point service offering leveraging CBRE’s advisory, analysis and execution expertise Integrated solutions for owners, creditors, debtors, etc. through every stage of the property lifecycle Special focus on: recapitalizations, loan sales/workouts, asset and portfolio valuations, asset management and repositioning and receivership services As of Q2 2009 marketing $2.25B of distressed properties. Key Facts $0 $20 $40 $60 $80 $100 $120 2008Q1 Q2 Q3 Q4 2009Q1 Q2 Troubled Deals Lender REO |
|
|
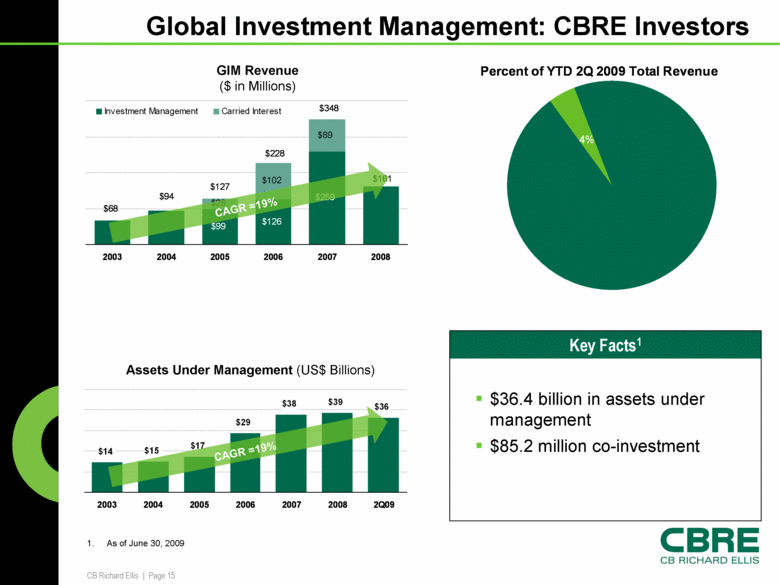
Global Investment Management: CBRE Investors GIM Revenue ($ in Millions) CAGR =19% Assets Under Management (US$ Billions) CAGR =19% Key Facts1 $36.4 billion in assets under management $85.2 million co-investment 1. As of June 30, 2009 $99 $126 $259 $28 $102 $89 $68 $94 2003 2004 2005 2006 2007 2008 Investment Management Carried Interest $127 $228 $348 $161 Percent of YTD 2Q 2009 Total Revenue 4% $14 $15 $17 $29 $38 $39 $36 2003 2004 2005 2006 2007 2008 2Q09 |
|
|
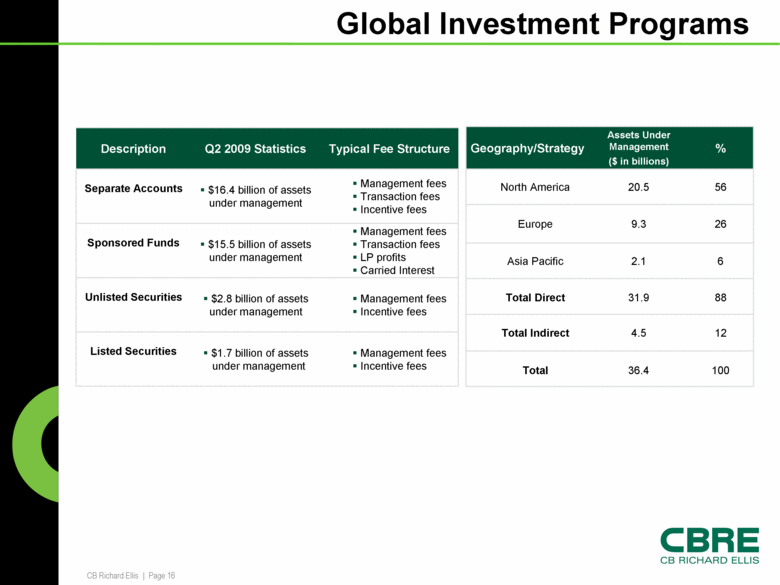
Global Investment Programs Description Q2 2009 Statistics Typical Fee Structure Separate Accounts $16.4 billion of assets under management Management fees Transaction fees Incentive fees Sponsored Funds $15.5 billion of assets under management Management fees Transaction fees LP profits Carried Interest Unlisted Securities $2.8 billion of assets under management Management fees Incentive fees Listed Securities $1.7 billion of assets under management Management fees Incentive fees Geography/Strategy Assets Under Management ($ in billions) % North America 20.5 56 Europe 9.3 26 Asia Pacific 2.1 6 Total Direct 31.9 88 Total Indirect 4.5 12 Total 36.4 100 |
|
|
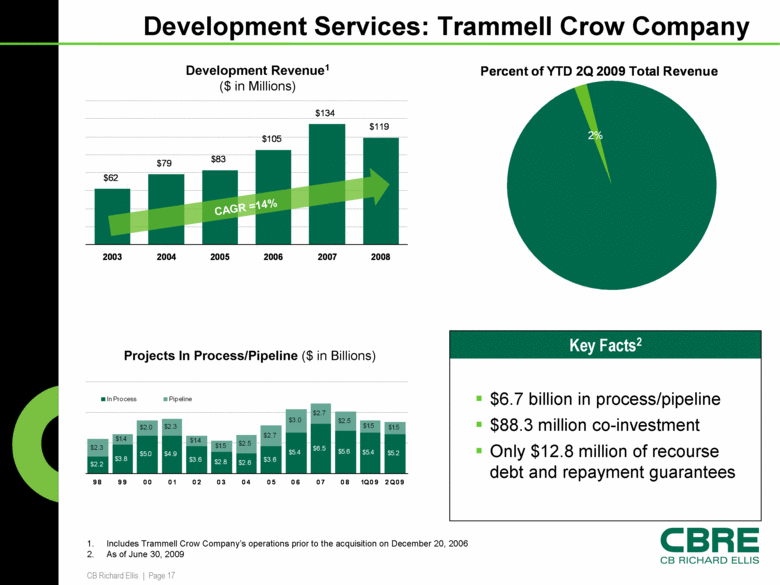
Development Services: Trammell Crow Company Development Revenue1 ($ in Millions) 1. Includes Trammell Crow Company’s operations prior to the acquisition on December 20, 2006 2. As of June 30, 2009 CAGR =14% $6.7 billion in process/pipeline $88.3 million co-investment Only $12.8 million of recourse debt and repayment guarantees Projects In Process/Pipeline ($ in Billions) Key Facts2 $62 $79 $83 $105 $134 $119 2003 2004 2005 2006 2007 2008 Percent of YTD 2Q 2009 Total Revenue 2% |
|
|
The Market Environment |
|
|
Outsourcing Market Conditions Robust global RFP activity 25% increase in new client contracts versus 2008 Square footage growth positive in Q2 2009 Lower corporate spending impacting projects and reimbursements Vacancy and consolidation also pressuring near-term results Positive long-term outlook |
|
|
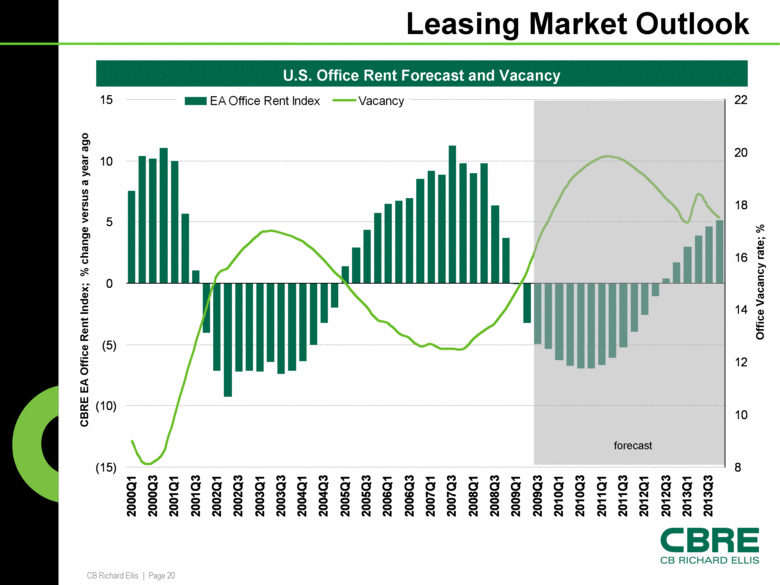
Leasing Market Outlook forecast CBRE EA Office Rent Index; % change versus a year ago Office Vacancy rate; % U.S. Office Rent Forecast and Vacancy (15) (10) (5) 0 5 10 15 2000Q1 2000Q3 2001Q1 2001Q3 2002Q1 2002Q3 2003Q1 2003Q3 2004Q1 2004Q3 2005Q1 2005Q3 2006Q1 2006Q3 2007Q1 2007Q3 2008Q1 2008Q3 2009Q1 2009Q3 2010Q1 2010Q3 2011Q1 2011Q3 2012Q1 2012Q3 2013Q1 2013Q3 8 10 12 14 16 18 20 22 EA Office Rent Index Vacancy |
|
|
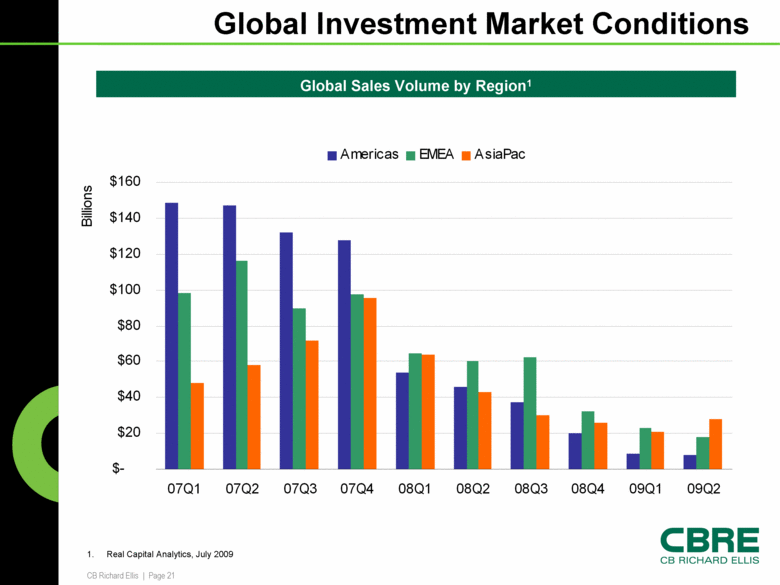
Real Capital Analytics, July 2009 Global Investment Market Conditions Global Sales Volume by Region1 $- $20 $40 $60 $80 $100 $120 $140 $160 07Q1 07Q2 07Q3 07Q4 08Q1 08Q2 08Q3 08Q4 09Q1 09Q2 Billions Americas EMEA AsiaPac |
|
|
Financial Performance |
|
|
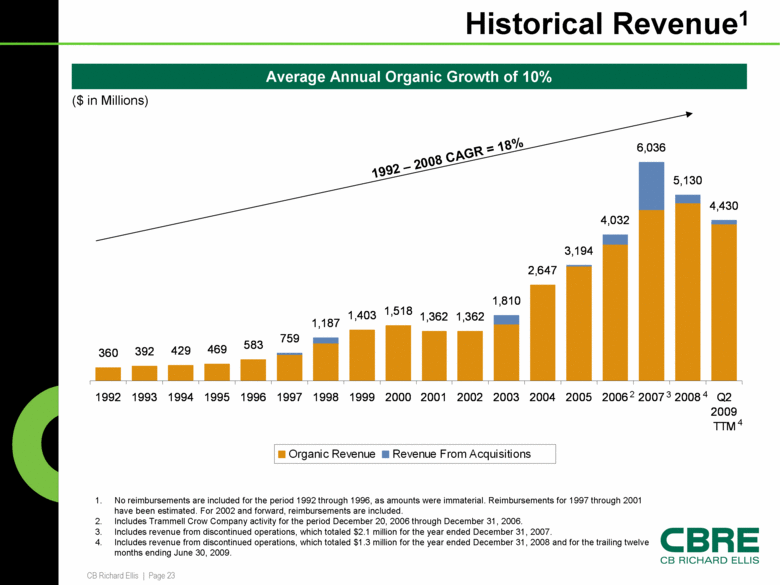
Historical Revenue1 ($ in Millions) No reimbursements are included for the period 1992 through 1996, as amounts were immaterial. Reimbursements for 1997 through 2001 have been estimated. For 2002 and forward, reimbursements are included. Includes Trammell Crow Company activity for the period December 20, 2006 through December 31, 2006. Includes revenue from discontinued operations, which totaled $2.1 million for the year ended December 31, 2007. Includes revenue from discontinued operations, which totaled $1.3 million for the year ended December 31, 2008 and for the trailing twelve months ending June 30, 2009. 2 3 4 4 1992 – 2008 CAGR = 18% Average Annual Organic Growth of 10% 360 392 429 469 583 759 1,187 1,403 1,518 1,362 1,362 1,810 2,647 3,194 4,032 6,036 5,130 4,430 1992 1993 1994 1995 1996 1997 1998 1999 2000 2001 2002 2003 2004 2005 2006 2007 2008 Q2 2009 TTM Organic Revenue Revenue From Acquisitions |
|
|
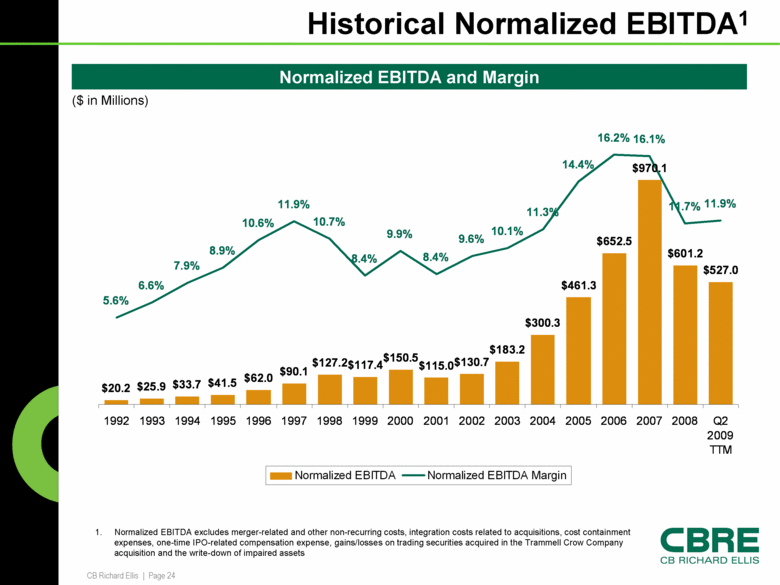
Historical Normalized EBITDA1 ($ in Millions) Normalized EBITDA excludes merger-related and other non-recurring costs, integration costs related to acquisitions, cost containment expenses, one-time IPO-related compensation expense, gains/losses on trading securities acquired in the Trammell Crow Company acquisition and the write-down of impaired assets Normalized EBITDA and Margin $20.2 $25.9 $33.7 $41.5 $62.0 $90.1 $127.2 $117.4 $150.5 $115.0 $130.7 $183.2 $300.3 $461.3 $652.5 $970.1 $601.2 $527.0 5.6% 6.6% 7.9% 8.9% 10.6% 11.9% 10.7% 8.4% 9.9% 8.4% 9.6% 10.1% 11.3% 14.4% 16.2% 16.1% 11.7% 11.9% 1992 1993 1994 1995 1996 1997 1998 1999 2000 2001 2002 2003 2004 2005 2006 2007 2008 Q2 2009 TTM Normalized EBITDA Normalized EBITDA Margin |
|
|
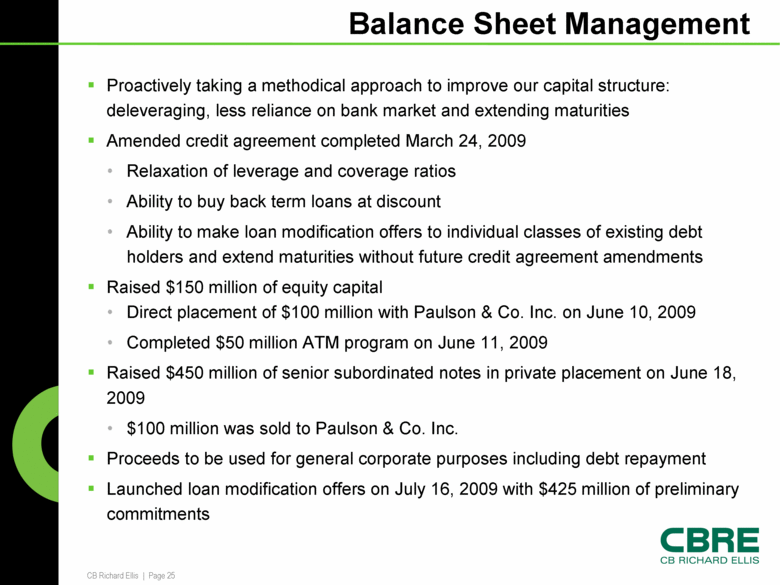
Balance Sheet Management Proactively taking a methodical approach to improve our capital structure: deleveraging, less reliance on bank market and extending maturities Amended credit agreement completed March 24, 2009 Relaxation of leverage and coverage ratios Ability to buy back term loans at discount Ability to make loan modification offers to individual classes of existing debt holders and extend maturities without future credit agreement amendments Raised $150 million of equity capital Direct placement of $100 million with Paulson & Co. Inc. on June 10, 2009 Completed $50 million ATM program on June 11, 2009 Raised $450 million of senior subordinated notes in private placement on June 18, 2009 $100 million was sold to Paulson & Co. Inc. Proceeds to be used for general corporate purposes including debt repayment Launched loan modification offers on July 16, 2009 with $425 million of preliminary commitments |
|
|
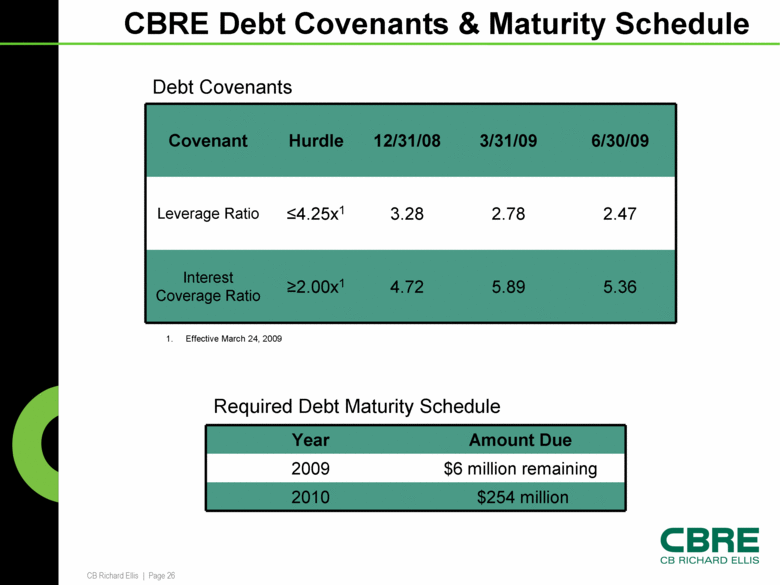
CBRE Debt Covenants & Maturity Schedule Covenant Hurdle 12/31/08 3/31/09 6/30/09 Leverage Ratio <4.25x1 3.28 2.78 2.47 Interest Coverage Ratio >2.00x1 4.72 5.89 5.36 Year Amount Due 2009 $6 million remaining 2010 $254 million Debt Covenants Required Debt Maturity Schedule Effective March 24, 2009 |
|
|
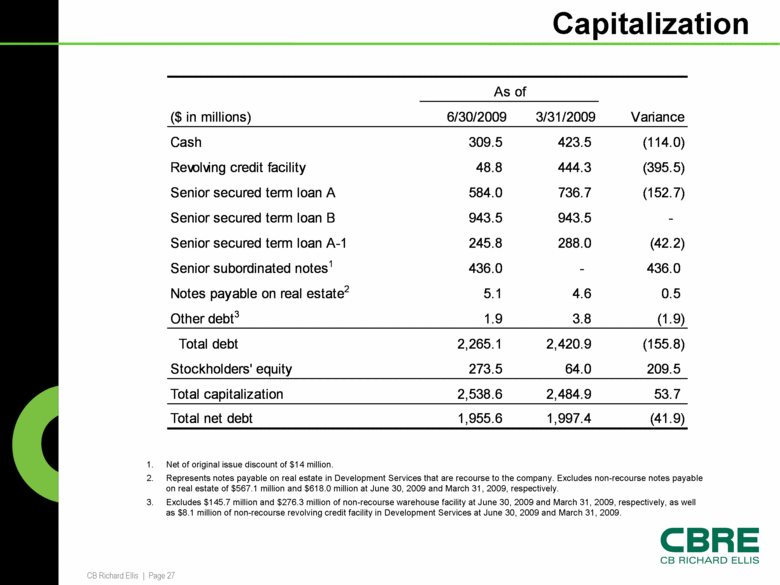
Capitalization Net of original issue discount of $14 million. Represents notes payable on real estate in Development Services that are recourse to the company. Excludes non-recourse notes payable on real estate of $567.1 million and $618.0 million at June 30, 2009 and March 31, 2009, respectively. Excludes $145.7 million and $276.3 million of non-recourse warehouse facility at June 30, 2009 and March 31, 2009, respectively, as well as $8.1 million of non-recourse revolving credit facility in Development Services at June 30, 2009 and March 31, 2009. Stockholders' equity |
|
|
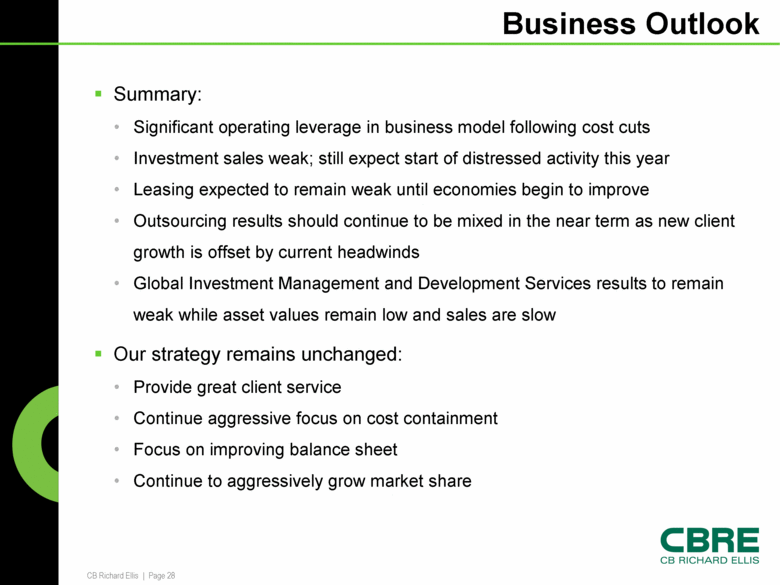
Business Outlook Summary: Significant operating leverage in business model following cost cuts Investment sales weak; still expect start of distressed activity this year Leasing expected to remain weak until economies begin to improve Outsourcing results should continue to be mixed in the near term as new client growth is offset by current headwinds Global Investment Management and Development Services results to remain weak while asset values remain low and sales are slow Our strategy remains unchanged: Provide great client service Continue aggressive focus on cost containment Focus on improving balance sheet Continue to aggressively grow market share |
|
|
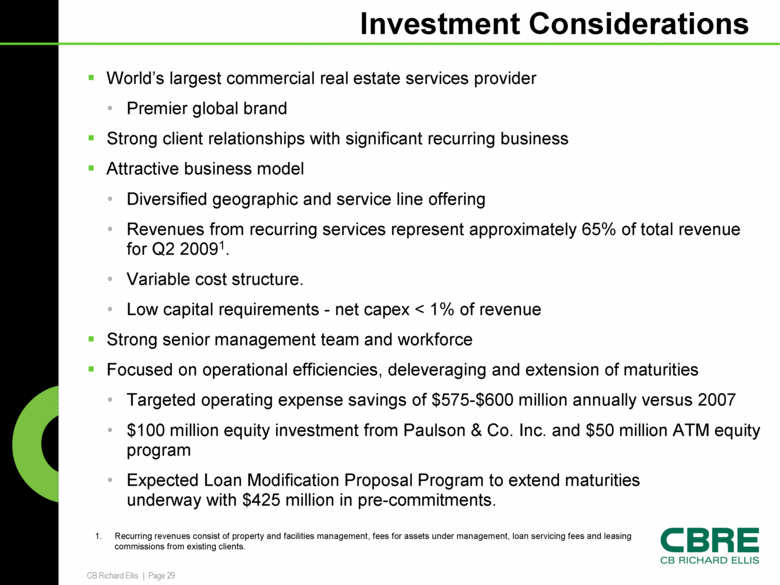
Investment Considerations World’s largest commercial real estate services provider Premier global brand Strong client relationships with significant recurring business Attractive business model Diversified geographic and service line offering Revenues from recurring services represent approximately 65% of total revenue for Q2 20091. Variable cost structure. Low capital requirements - net capex < 1% of revenue Strong senior management team and workforce Focused on operational efficiencies, deleveraging and extension of maturities Targeted operating expense savings of $575-$600 million annually versus 2007 $100 million equity investment from Paulson & Co. Inc. and $50 million ATM equity program Expected Loan Modification Proposal Program to extend maturities underway with $425 million in pre-commitments. Recurring revenues consist of property and facilities management, fees for assets under management, loan servicing fees and leasing commissions from existing clients. |
|
|
Appendix |
|
|
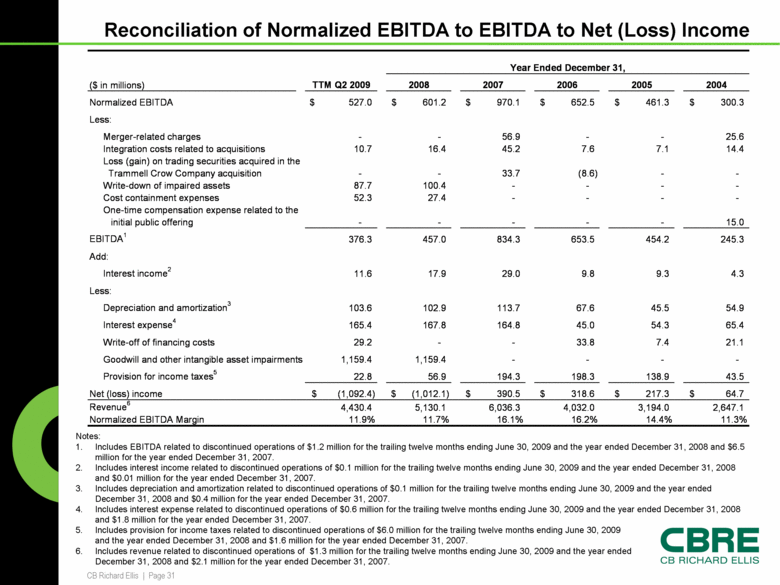
Reconciliation of Normalized EBITDA to EBITDA to Net (Loss) Income Notes: Includes EBITDA related to discontinued operations of $1.2 million for the trailing twelve months ending June 30, 2009 and the year ended December 31, 2008 and $6.5 million for the year ended December 31, 2007. Includes interest income related to discontinued operations of $0.1 million for the trailing twelve months ending June 30, 2009 and the year ended December 31, 2008 and $0.01 million for the year ended December 31, 2007. Includes depreciation and amortization related to discontinued operations of $0.1 million for the trailing twelve months ending June 30, 2009 and the year ended December 31, 2008 and $0.4 million for the year ended December 31, 2007. Includes interest expense related to discontinued operations of $0.6 million for the trailing twelve months ending June 30, 2009 and the year ended December 31, 2008 and $1.8 million for the year ended December 31, 2007. Includes provision for income taxes related to discontinued operations of $6.0 million for the trailing twelve months ending June 30, 2009 and the year ended December 31, 2008 and $1.6 million for the year ended December 31, 2007. Includes revenue related to discontinued operations of $1.3 million for the trailing twelve months ending June 30, 2009 and the year ended December 31, 2008 and $2.1 million for the year ended December 31, 2007. 11.3% 14.4% 16.2% 16.1% 11.7% 11.9% Normalized EBITDA Margin 2,647.1 3,194.0 4,032.0 6,036.3 5,130.1 4,430.4 Revenue6 $ 64.7 $ 217.3 $ 318.6 $ 390.5 $ (1,012.1) $ (1,092.4) Net (loss) income 43.5 138.9 198.3 194.3 56.9 22.8 Provision for income taxes5 - - - - 1,159.4 1,159.4 Goodwill and other intangible asset impairments 21.1 7.4 33.8 - - 29.2 Write-off of financing costs 65.4 54.3 45.0 164.8 167.8 165.4 Interest expense4 54.9 45.5 67.6 113.7 102.9 103.6 Depreciation and amortization3 Less: 4.3 9.3 9.8 29.0 17.9 11.6 Interest income2 Add: 245.3 454.2 653.5 834.3 457.0 376.3 EBITDA1 15.0 - - - - - initial public offering One-time compensation expense related to the - - - - 27.4 52.3 Cost containment expenses - - - - 100.4 87.7 Write-down of impaired assets - - (8.6) 33.7 - - Trammell Crow Company acquisition Loss (gain) on trading securities acquired in the 14.4 7.1 7.6 45.2 16.4 10.7 Integration costs related to acquisitions 25.6 - - 56.9 - - Merger-related charges Less: $ 300.3 $ 461.3 $ 652.5 $ 970.1 $ 601.2 $ 527.0 Normalized EBITDA 2004 2005 2006 2007 2008 TTM Q2 2009 ($ in millions) Year Ended December 31, |