Exhibit 99.1
|
|
Investor Presentation May 2009 CB Richard Ellis Group, Inc. |
Exhibit 99.1
|
|
Investor Presentation May 2009 CB Richard Ellis Group, Inc. |
|
|
Forward Looking Statements This presentation contains statements that are forward looking within the meaning of the Private Securities Litigation Reform Act of 1995, including statements regarding our growth momentum in 2009, future operations and future financial performance. These statements should be considered as estimates only and actual results may ultimately differ from these estimates. Except to the extent required by applicable securities laws, we undertake no obligation to update or publicly revise any of the forward-looking statements that you may hear today. Please refer to our current annual report on Form 10-K and our current quarterly report on Form 10-Q, in particular any discussion of Risk Factors, which are filed with the SEC and available at the SEC’s website (http://www.sec.gov), for a full discussion of the risks and other factors that may impact any estimates that you may hear today. We may make certain statements during the course of this presentation which include references to “non-GAAP financial measures,” as defined by SEC regulations. As required by these regulations, we have provided reconciliations of these measures to what we believe are the most directly comparable GAAP measures, which are attached hereto within the appendix. |
|
|
Global Leader in Commercial Real Estate Services 100+ years 57 countries #1 in key cities in America, Europe and Asia Pacific #1 commercial real estate brokerage #1 outsourcing #1 appraisal and valuation $36.0 billion in assets under management1 #2 commercial mortgage brokerage $6.9 billion of development projects in process/pipeline1 1.9x nearest competitor2 Thousands of clients, 88% of Fortune 100 2009 Q1 TTM revenue of $4.8 billion 2009 Q1 TTM normalized EBITDA of $550.7 million3 Leading Global Brand Broad Capabilities Scale, Diversity and Earnings Power 1 As of March 31, 2009. 2 Based on 2008 revenues versus Jones Lang LaSalle. 3 Normalized EBITDA excludes integration costs related to acquisitions, cost containment expenses and the write-down of impaired assets. |
|
|
Diverse Client Base Diversified revenue spread across broad base of clients with no concentration. 2008 Revenue by Client Type Corporations, 39% Insurance Co’s/Banks, 23% Pensions Funds/P F Advisors, 11% Individuals/Partnerships, 9% REITs, 5% Opportunity Funds, 4% Government, 3% Conduits/Wall Street Firms, 1% Offshore Investors, 1% Other, 4% |
|
|
Segment Contribution TTM Q1 2009 Revenue TTM Q1 2009 Normalized EBITDA1. Normalized EBITDA excludes integration costs related to acquisitions, cost containment expenses and the write-down of impaired assets. Americas 63% EMEA 19% Asia Pacific 8% Global Investment Management 6% Development Services 4% Americas 63% EMEA 21% Asia Pacific 11% Global Investment Management 3% Development Services 2% |
|
|
Revenue Breakdown 1st Quarter 2009 44% 30% 9% 7% 4% 2% 2% 2% Property & Facilities Management Leasing Sales Appraisal & Valuation Investment Management Development Services Commercial Mortgage Brokerage Other ($ in millions) 2009 2008 % Change 396.4 413.2 -4 267.1 394.5 -32 77.8 227.9 -66 62.4 87.1 -28 35.5 41.0 -14 19.9 26.2 -24 14.7 21.9 -33 16.6 19.1 -13 Total 890.4 1,230.9 -28 Three months ended March 31, |
|
|
Outsourcing Services Global property and facilities management Global project management Global corporate services 1 88 of the Fortune 100 Represents combined data for CBRE and TCC; does not include joint ventures and affiliates. Management fees include property management, facilities management and project management fees. Does not include transaction revenue associated with outsourcing activities. 2 CAGR 11% 2 Global Square Footage Managed (SF in billions) 1.2 1.3 1.4 1.6 1.9 1.9 2004 2005 2006 2007 2008 Q1 2009 Outsourcing % of Q1 2009 Total Revenue 44% |
|
|
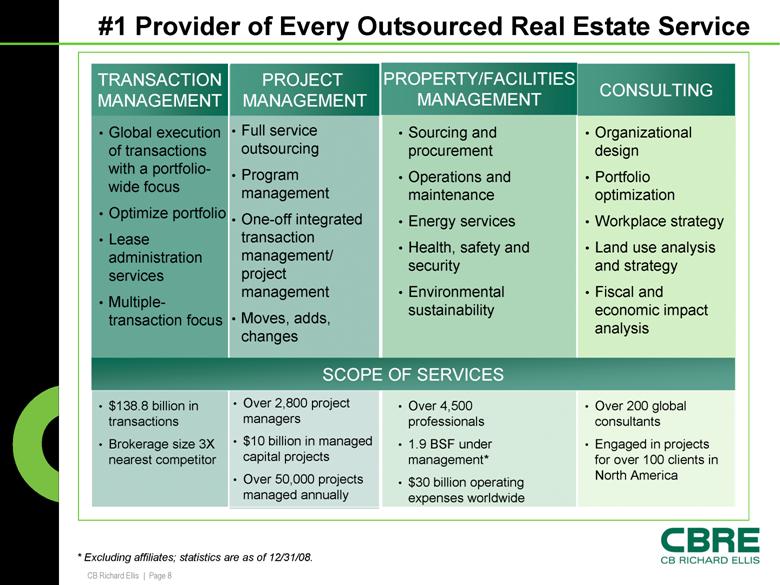
#1 Provider of Every Outsourced Real Estate Service * Excluding affiliates; statistics are as of 12/31/08. Global execution of transactions with a portfolio-wide focus Optimize portfolio Lease administration services Multiple-transaction focus Full service outsourcing Program management One-off integrated transaction management/ project management Moves, adds, changes Sourcing and procurement Operations and maintenance Energy services Health, safety and security Environmental sustainability Organizational design Portfolio optimization Workplace strategy Land use analysis and strategy Fiscal and economic impact analysis SCOPE OF SERVICES CONSULTING PROPERTY/FACILITIES MANAGEMENT PROJECT MANAGEMENT TRANSACTION MANAGEMENT $138.8 billion in transactions Brokerage size 3X nearest competitor Over 2,800 project managers $10 billion in managed capital projects Over 50,000 projects managed annually Over 4,500 professionals 1.9 BSF under management* $30 billion operating expenses worldwide Over 200 global consultants Engaged in projects for over 100 clients in North America |
|
|
US Market Statistics US Absorption Trends US Vacancy (in millions of square feet) 4Q07 4Q08 1Q09 4Q09 F 2007 2008 1Q09 2009 F Office 12.6% 13.9% 14.7% 17.4% 57.7 18.4 -16.3 -70.3 Industrial 9.5% 11.4% 12.2% 14.3% 167.4 -86.8 -92.7 -315.5 Retail 8.7% 10.4% 11.2% 12.4% 13.7 -0.7 -11.3 -22.3 Source: CBRE Econometric Advisors (EA) Outlooks Summer 2009 Cap Rate Cap Rates Up At Lower Volumes Growth1 4Q07 4Q08 1Q09 2009 F Office Volume ($B) 27.3 7.6 3.6 Cap Rate 6.5% 7.3% 7.5% +80 to 160 bps Industrial Volume ($B) 10.2 3.0 1.3 Cap Rate 7.2% 7.9% 8.2% +60 to 170 bps Retail Volume ($B) 11.9 3.2 1.9 Cap Rate 7.1% 7.3% 7.7% +70 to 170 bps Source: RCA April 2009 1. CBRE EA estimates |
|
|
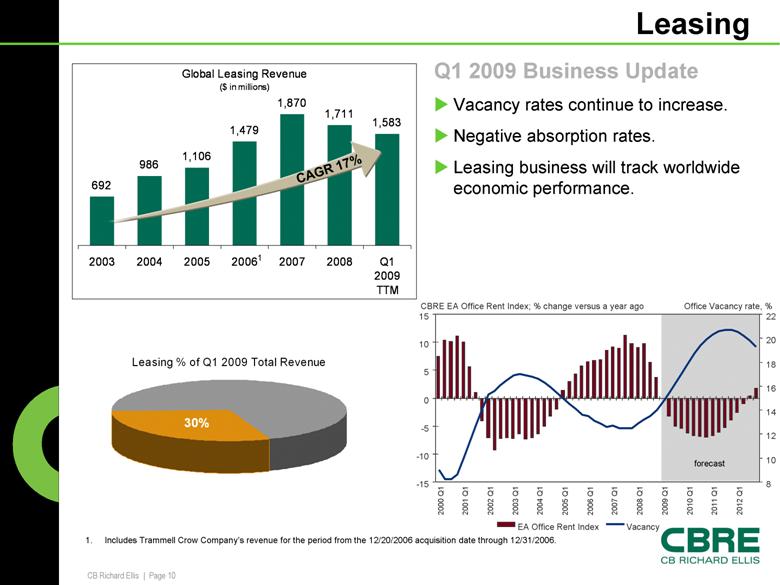
Leasing Q1 2009 Business Update Vacancy rates continue to increase. Negative absorption rates. Leasing business will track worldwide economic performance. 1 Includes Trammell Crow Company’s revenue for the period from the 12/20/2006 acquisition date through 12/31/2006. CAGR 17% forecast -15 -10 -5 0 5 10 15 2000 Q1 2001 Q1 2002 Q1 2003 Q1 2004 Q1 2005 Q1 2006 Q1 2007 Q1 2008 Q1 2009 Q1 2010 Q1 2011 Q1 2012 Q1 8 10 12 14 16 18 20 22 EA Office Rent Index Vacancy CBRE EA Office Rent Index; % change versus a year ago Office Vacancy rate, % Global Leasing Revenue ($ in millions) 692 986 1,106 1,479 1,870 1,711 1,583 2003 2004 2005 2006 1 2007 2008 Q1 2009 TTM Leasing % of Q1 2009 Total Revenue 30% |
|
|
Sales Q1 2009 Business Update Credit markets remain challenging. Declining property market fundamentals due to weak leasing environment. Asset values continue to decline. Wide bid ask spread continues to exist. CAGR 7% 1. Includes Trammell Crow Company’s revenue for the period from the 12/20/2006 acquisition date through 12/31/2006. CAGR 7% Global Sales Revenue ($ in millions) 513 807 1,078 1,246 1,660 870 720 2003 2004 2005 2006 1 2007 2008 Q1 2009 TTM Institutional Ownership of Real Estate ($ in billions) 423 479 520 606 719 607 2003 2004 2005 2006 2007 2008 Sales % of Q1 2009 Total Revenue 9% |
|
|
Global Investment Management ($ in billions) ($ in millions) Combination with CBRE platform creates competitive advantage. CAGR 19% CAGR 20.2% ($ in millions) Co-investments totaled $67 million at March 31, 2009 Annual Revenue 57.1 68.4 94.0 99.3 126.3 259.2 160.8 28.0 101.7 88.7 0.4 57.1 68.4 94.0 127.3 228.0 347.9 161.2 2002 2003 2004 2005 2006 2007 2008 Assets Under Management 11.4 14.4 15.1 17.3 28.6 37.8 38.5 36.0 2002 2003 2004 2005 2006 2007 2008 Q1 2009 Global Investment Management % of Q1 2009 Total Revenue 4% Investment Management Carried Interest Asset Management Acquisition, Disposition & Incentive Q1 Revenue 32.8 33.6 6.7 3.7 37.3 39.5 Q1 2008 Q1 2009 |
|
|
Global Investment Programs Description Q1 2009 Statistics Typical Fee Structure Separate Accounts $16.0 billion of assets under management Management fees Transaction fees Incentive fees Sponsored Funds $16.0 billion of assets under management Management fees Transaction fees LP profits Carried Interest Unlisted Securities $2.7 billion of assets under management Management fees Incentive fees Listed Securities $1.3 billion of assets under management Management fees Incentive fees Geography/Strategy Assets Under Management ($ in billions) % North America 20.8 58 Europe 8.7 24 Asia Pacific 2.5 7 Total Direct 32.0 89 Total Indirect 4.0 11 Total 36.0 100 |
|
|
Development Services Develops properties for user / investor clients on a fee and / or co-investment basis $96 million co-invested at March 31, 2009 $4.6 million in recourse debt to CBRE at March 31, 2009 Includes Trammell Crow Company’s operations prior to the acquisition on 12/20/06. Reflects full year pro-forma results for Development Services, including the impact of $61.6 million of gains which could not be recognized under purchase accounting rules. 1. 2. Normalized EBITDA ($ in millions) 15.9 31.3 34.8 37.3 73.9 17.9 22.8 2003 2004 2005 2006 1 2007 2 2008 Q1 2009 TTM Projects In Process/Pipeline ($ in billions) 2.2 3.8 5.0 4.9 3.6 2.8 2.6 3.6 5.4 6.5 5.6 5.4 2.3 1.4 2.0 2.3 1.4 1.5 2.5 2.7 3.0 2.7 2.5 1.5 4Q98 4Q99 4Q00 4Q01 4Q02 4Q03 4Q04 4Q05 4Q06 4Q07 4Q08 1Q09 In Process Pipeline Development Services % of Q1 2009 Total Revenue 2% |
|
|
Financial Overview |
|
|
Consistent Long Term Growth1 Average Annual Organic Growth = 10% ($ in millions) No reimbursements are included for the period 1992 through 1996, as amounts were immaterial. Reimbursements for 1997 through 2001 have been estimated. For 2002 and forward, reimbursements are included. Includes TCC activity for the period December 20, 2006 through December 31, 2006. Includes revenue from discontinued operations, which totaled $2.1 million for the year ended December 31, 2007. Includes revenue from discontinued operations, which totaled $1.3 million for the year ended December 31, 2008 and for the trailing twelve months ending March 31, 2009. Normalized EBITDA margin excludes merger-related and other non-recurring costs, integration costs related to acquisitions, cost containment expenses, one-time IPO-related compensation expense, gains/losses on trading securities acquired in the TCC acquisition and the write-down of impaired assets. 2 3 4 5 4 5.6% 6.6% 7.9% 8.9% 10.6% 11.9% 10.7% 8.4% 9.9% 8.4% 9.6% 10.1% 11.3% 14.4% 16.2% 16.1% 11.7% 11.5% 360 392 429 469 583 759 1,187 1,403 1,518 1,362 1,362 1,810 2,647 3,194 4,032 6,036 5,130 4,790 1992 1993 1994 1995 1996 1997 1998 1999 2000 2001 2002 2003 2004 2005 2006 2007 2008 Q1 2009 TTM Organic Revenue Revenue From Acquisitions Normalized EBITDA Margin 1. 2. 3. 4. 5. |
|
|
Q1 2009 Business Overview Worldwide economic conditions remain weak, impacting absorption and vacancy rates – causing leasing results to suffer Challenging credit markets and declining property market fundamentals continue to pressure investment sales Outsourcing portfolio and number of clients growing despite some near term revenue challenges Aggressively reduced more operating expenses in Q1 – raising total structural operating expense reduction target to $475 - $500 million Cost reductions will continue while challenging business conditions exist Credit agreement successfully amended, providing greater flexibility to manage our business and our balance sheet |
|
|
Q1 2009 Performance Overview Q1 2008 Q1 2009 $104.6 million $54.1 million Normalized EBITDA3 8.5% 6.1% Normalized EBITDA Margin3 $88.5 million $38.4 million EBITDA GAAP $0.10 Adjusted $0.15 GAAP ($0.14) Adjusted ($0.03) EPS1,2 GAAP $20.5 million Adjusted $31.7 million GAAP ($36.7) million Adjusted ($7.5) million Net (Loss) Income1 $1,230.9 million $890.4 million Revenue Adjusted net income and adjusted EPS exclude the write-off of financing costs incurred in connection with the credit agreement amendment entered into March 24, 2009, amortization expense related to customer relationships resulting from acquisitions, integration costs related to acquisitions, cost containment expenses and the write-down of impaired assets. All EPS information is based upon diluted shares. Normalized EBITDA and normalized EBITDA margin exclude integration costs related to acquisitions, cost containment expenses and the write-down of impaired assets. 1. 2. 3. |
|
|
Cost Cutting Initiatives Previously announced $385 million cost savings plans implemented Raising structural operating expense savings target by another approximate $100 million to a total of $475 - $500 million annually versus full year 2007 Expect to realize approximately $435 million of these savings in 2009 versus full year 2007 due to timing of implementation These are structural changes to operating expenses that are in addition to variable expense declines from lower revenue Incurred one-time cost containment expenses of $7.9 million in Q1 2009; total of $35.3 million incurred in trailing 12 months Also expect low 2009 capital expenditures of $30 million |
|
|
Credit Agreement Amendment Amended agreement completed March 24, 2009 Leverage ratio increased to 4.25x from 3.75x for eight quarters Interest coverage ratio decreased to 2.00x from 2.25x for eight quarters Up to $225 million in covenant EBITDA add backs: Up to $75 million related to one-time cost containment expense add backs Up to $150 million for run rate savings add backs Ability to buy back term loans at discount Ability to make loan modification offers to individual classes of existing debt holders $105.5 million pre-paid at closing Expected effective interest rate for 2009 similar to actual 2008 rate Post amendment interest rate at end of Q1 2009 was 5.6%, excluding swaps |
|
|
CBRE Debt Covenants & Maturity Schedule Covenant Hurdle 9/30/08 12/31/08 3/31/09 Leverage Ratio <4.25x1 3.16 3.28 2.782 Interest Coverage Ratio >2.00x1 5.63 4.72 5.89 Year Amount Due 2009 $111 million remaining 2010 ~ $75 million per quarter Debt Covenants Debt Maturity Schedule Effective March 24, 2009. Significant reduction due to $185 million of add backs as part of amended credit agreement. 1. 2. |
|
|
Debt Highlights Normalized EBITDA excludes merger-related and other non-recurring costs, integration costs related to acquisitions, cost containment expenses, one-time IPO related compensation expense, gains/losses on trading securities acquired in the TCC acquisition and the write-down of impaired assets. 2006 combined normalized EBITDA includes $106.8 million for TCC for the period January 1, 2006 through December 20, 2006. 2007 normalized EBITDA includes $61.6 million of Development Services gains, which could not be recognized under purchase accounting rules. Total debt excludes non-recourse debt. ($ in millions) 1 2 3 4 Combined Normalized 1 EBITDA: $115 $131 $183 $300 $461 $759 $1,032 $601 $551 $486 $450 $635 $378 $128 $1,997 $1,693 $1,874 $1,950 2.9x 3.0x 2.7x 2.3x 2.8x 1.9x 1.3x 0.4x 3.3x $2,421 $544 $530 $798 $635 $577 $2,118 $2,036 $2,109 2001 2002 2003 2004 2005 2006 2007 2008 TTM Q1 2009 Net Debt Total Debt Covenant Leverage Ratio 1. 2. 3. 4. |
|
|
Capitalization 1. Represents notes payable on real estate in Development Services that are recourse to the company. 2. Excludes non-recourse notes payable on real estate of $618.0 million and $613.6 million at March 31, 2009 and December 31, 2008, respectively. Excludes $276.3 million and $210.5 million of non-recourse warehouse facility at March 31, 2009 and December 31, 2008, respectively, as well as $8.1 million and $8.0 million of non-recourse revolving credit facility in Development Services at March 31, 2009 and December 31, 2008, respectively. As of ($ in millions) 3/31/2009 12/31/2008 Variance Cash 423.5 158.8 264.7 Revolving credit facility 444.3 25.8 418.5 Senior secured term loan A 736.7 827.0 (90.3) Senior secured term loan B 943.5 949.0 (5.5) Senior secured term loan A-1 288.0 297.8 (9.8) Notes payable on real estate1 4.6 4.1 0.5 Other debt2 3.8 5.5 (1.7) Total debt 2,420.9 2,109.2 311.7 Stockholders’ equity 64.0 114.7 (50.7) Total capitalization 2,484.9 2,223.9 261.0 Total net debt 1,997.4 1,950.4 47.0 |
|
|
Business Outlook Market conditions continue to make providing guidance unrealistic Investment sales remain weak; distressed sales may pick up in 2009 Leasing expected to remain weak until economies begin to improve Outsourcing results will be mixed as new client growth is offset by spending restraint of clients (reducing outsourced staffing levels, which lowers reimbursement revenue), higher vacancies as well as client bankruptcies and consolidations Global Investment Management and Development Services results will remain soft while asset values remain low and sales are slow Our strategy during the downturn remains consistent: Provide great client service Continue aggressive focus on cost containment Focus on improving balance sheet Continue to aggressively grow market share |
|
|
Appendix |
|
|
Reconciliation of Normalized EBITDA to EBITDA to Net (Loss) Income Notes: Includes EBITDA related to discontinued operations of $1.2 million in our Development Services segment. Includes interest income related to discontinued operations of $0.1 million in our Development Services segment. Includes depreciation and amortization related to discontinued operations of $0.1 million in our Development Services segment. Includes interest expense related to discontinued operations of $0.6 million in our Development Services segment. Includes provision for income taxes related to discontinued operations of $6.0 million in our Development Services segment. Includes revenue related to discontinued operations of $1.3 million in our Development Services segment. Trailing Twelve Months Ended March 31, 2009 ($ in millions) Consolidated Americas EMEA Asia Pacific Global Investment Management Development Services Normalized EBITDA $550.7 $348.4 $102.4 $41.9 $35.2 $22.8 Less: Integration costs related to acquisitions 12.6 12.2 0.4 - - - Cost containment expenses 35.3 14.6 11.3 5.4 0.1 3.9 Write-down of impaired assets 95.9 4.1 - - 41.7 50.1 EBITDA1 406.9 317.5 90.7 36.5 (6.6) (31.2) Add: Interest income2 15.0 6.2 2.2 0.6 1.2 4.8 Less: Depreciation and amortization3 104.4 59.8 12.6 9.4 4.6 18.0 Interest expense4 159.6 122.6 3.6 5.1 2.8 25.5 Royalty and management service (income) expense - (17.0) 10.0 6.0 1.0 - Write-off of financing costs 29.3 29.3 - - - - Goodwill and other intangible asset impairments 1,159.4 805.2 - 138.6 - - - 44.9 - 170.7 Provision (benefit) for income taxes5 38.5 16.7 28.3 9.6 9.5 (25.6) Net (loss) income $(1,069.3) $(692.9) $(100.2) $7.0 $(68.2) $(215.0) Revenue6 4,789.6 3,003.3 1,000.1 513.9 159.0 113.3 Normalized EBITDA Margin 11.5% 11.6% 10.2% 8.2% 22.1% 20.1% |
|
|
Reconciliation of Normalized EBITDA to EBITDA to Net (Loss) Income Notes: Includes EBITDA related to discontinued operations of $1.2 million for year ended December 31, 2008 and $6.5 million for the year ended December 31, 2007. Includes interest income related to discontinued operations of $0.1 million for the year ended December 31, 2008 and $0.01 million for the year ended December 31, 2007. Includes depreciation and amortization related to discontinued operations of $0.1 million for the year ended December 31, 2008 and $0.4 million for the year ended December 31, 2007. Includes interest expense related to discontinued operations of $0.6 million for the year ended December 31, 2008 and $1.8 million for the year ended December 31, 2007. Includes provision for income taxes related to discontinued operations of $6.0 million the year ended December 31, 2008 and $1.6 million for the year ended December 31, 2007. Includes revenue related to discontinued operations of $1.3 million for the year ended December 31, 2008 and $2.1 million for the year ended December 31, 2007. Year Ended December 31, ($ in millions) 2008 2007 2006 2005 2004 Normalized EBITDA $ 601.2 $ 970.1 $ 652.5 $ 461.3 $ 300.3 Less: Merger-related charges - 56.9 - - 25.6 Integration costs related to acquisitions 16.4 45.2 7.6 7.1 14.4 Loss (gain) on trading securities acquired in the Trammell Crow Company acquisition - 33.7 (8.6) - - Write-down of impaired assets 100.4 - - - - Cost containment expenses 27.4 One-time compensation expense related to the initial public offering - - - - 15.0 EBITDA1 457.0 834.3 653.5 454.2 245.3 Add: Interest income2 17.9 29.0 9.8 9.3 4.3 Less: Depreciation and amortization3 102.9 113.7 67.6 45.5 54.9 Interest expense4 167.8 164.8 45.0 54.3 65.4 Write-off of financing costs - - 33.8 7.4 21.1 Goodwill and other intangible asset impairments 1,159.4 - - - - Provision for income taxes5 56.9 194.3 198.3 138.9 43.5 Net (loss) income $ (1,012.1) $ 390.5 $ 318.6 $ 217.3 $ 64.7 Revenue6 5,130.1 6,036.3 4,032.0 3,194.0 2,647.1 Normalized EBITDA Margin 11.7% 16.1% 16.2% 14.4% 11.3% |
|
|
Reconciliation of Net (Loss) Income to Net (Loss) Income, As Adjusted Three Months Ended March 31, ($ in millions, except for share data) 2009 2008 Net (loss) income attributable to CB Richard Ellis Group, Inc. $ (36.7) $ 20.5 Cost containment expenses, net of tax 4.8 - Write-down of impaired assets, net of tax 3.7 6.2 Amortization expense related to customer relationships acquired, net of tax 1.8 1.7 Integration costs related to acquisitions, net of tax 1.0 3.3 Write-off of financing costs, net of tax 17.9 - Net (loss) income attributable to CB Richard Ellis Group, Inc., as adjusted $ (7.5) $ 31.7 Diluted (loss) income per share, as adjusted $ (0.03) $ 0.15 Weighted average shares outstanding for diluted (loss) income per share 261,999,151 207,730,837 |
|
|
Reconciliation of Normalized EBITDA to EBITDA to Net (Loss) Income Three Months Ended March 31, ($ in millions) 2009 2008 Normalized EBITDA $ 54.1 $ 104.6 Adjustments: Integration costs related to acquisitions 1.7 5.5 Cost containment expenses 7.9 - Write-down of impaired assets 6.1 10.6 EBITDA 38.4 88.5 Add: Interest income 2.3 5.2 Less: Depreciation and amortization 25.3 23.8 Interest expense 34.8 43.0 Write-off of financing costs 29.3 - (Benefit) provision for income taxes (12.0) 6.4 Net (loss) income attributable to CB Richard Ellis Group, Inc. (36.7) 20.5 Revenue $ 890.4 $ 1,230.9 Normalized EBITDA Margin 6.1% 8.5% |