Exhibit 99.2
|
|
Fourth Quarter and Fiscal Year 2008 Earnings Conference Call February 11, 2009 CB Richard Ellis Group, Inc. |
Exhibit 99.2
|
|
Fourth Quarter and Fiscal Year 2008 Earnings Conference Call February 11, 2009 CB Richard Ellis Group, Inc. |
|
|
Forward Looking Statements This presentation contains statements that are forward looking within the meaning of the Private Securities Litigation Reform Act of 1995, including statements regarding our momentum in and possible scenarios for 2009, future operations, expenses, financial performance, performance under our credit facilities, our ability to renegotiate the terms of our credit agreement and cost savings. These statements should be considered as estimates only and actual results may ultimately differ from these estimates. Except to the extent required by applicable securities laws, we undertake no obligation to update or publicly revise any of the forward-looking statements that you may hear today. Please refer to our current annual report on Form 10-K and our current quarterly report on Form 10-Q, in particular any discussion of Risk Factors, which are filed with the SEC and available at the SEC’s website (http://www.sec.gov), for a full discussion of the risks and other factors that may impact any estimates that you may hear today. We may make certain statements during the course of this presentation which include references to “non-GAAP financial measures,” as defined by SEC regulations. As required by these regulations, we have provided reconciliations of these measures to what we believe are the most directly comparable GAAP measures, which are attached hereto within the appendix. |
|
|
Conference Call Participants Brett White President & Chief Executive Officer Gil Borok Executive Vice President & Interim Chief Financial Officer Nick Kormeluk Senior Vice President, Investor Relations |
|
|
Business Overview Throughout the fourth quarter significant challenges impacted economies around the world We believe that these challenging economic conditions will continue to impact capital markets activities and leasing conditions in 2009 We maintained profitability in 2008 due to our broad service offering and global scale Q4 2008 normalized EBITDA was $223 million and $601 million for the full year 2008 2008 Normalized EBITDA ranked 3rd best in our firm’s 100+ year history Solid results were achieved through market share gains and cost cuts Balance Sheet management is a high priority for us and we will likely seek an amendment or waiver to certain covenants |
|
|
GCS Strength in Q4 2008 6 account renewals 7 account expansions 5 new accounts US transaction management, lease administration expanded to include EMEA. IBM: EMEA transaction management client expanded to US and Asia. Lexmark International: Cross Selling Examples CAGR 11% 1. Represents combined data for CBRE and TCC; does not include joint ventures and affiliates 1 Global Square Footage Managed (SF in billions) 1.2 1.3 1.4 1.6 1.8 2004 2005 2006 2007 2008 |
|
|
Q4 CBRE Wins UNITED STATES Panattoni Development Company CBRE was selected to manage 17 million SF of office and industrial properties; 14 million SF located in Sacramento, Reno and Irvine. The assignment represents nearly half of Panattoni’s US portfolio. CHINA Various clients CBRE won two property management assignments. CBRE will manage 1 million SF for The Center; and 8.9 million SF for Hong Qiao Traffic Center. NEW YORK Viacom CBRE assisted in the 1.3 million SF expansion of Viacom’s corporate headquarters. This transaction was the third largest office lease in Manhattan history. AUSTRALIA Westin Melbourne CBRE arranged the sale of Melbourne’s finest 5-star hotel. The 262 room property was sold for $107 million. ATLANTA Wendy’s/Arby’s CBRE completed a 184,251 SF lease for the restaurant group. The deal represents one of the largest office leases in 2008. THAILAND Total Access Communications CBRE negotiated a 656,360 SF lease. This transaction was four times larger than any other office lease in Thailand’s history. KANSAS CITY Kansas City Aviation Department TCC broke ground on Phase I of an 800-acre multi-use development at the Kansas City International Airport. The project will feature four buildings of approximately 1.8 million SF of commercial space. UNITED KINGDOM HSBC CBRE advised in the repurchase of HSBC’s headquarters in London. Originally sold in 2007 as a sales-leaseback, the client repurchased the iconic 210-metre tower for $1.2 billion. |
|
|
US Market Statistics 7.7% 9.5% 12.6% 4Q06 22.7 206.8 82.8 2006 -3.5 -0.6 13.9 11.3% 10.4% 8.7% Retail -103.2 -94.1 166.7 12.6% 11.4% 9.5% Industrial -50.0 17.8 55.8 16.8% 14.0% 12.6% Office 2009 F 2008 2007 4Q09 F 4Q08 4Q07 US Absorption Trends (in millions of square feet) US Vacancy Source: TWR Outlooks Spring 2009 +140 to 190 bps Cap Rates Up At Lower Volumes Cap Rate Growth1 4Q06 4Q07 4Q08 2009 F Office Volume ($B) 36.2 27.2 7.1 Cap Rate 6.8% 7.1% 7.3% +130 to 200 bps Industrial Volume ($B) 12.3 10.2 2.6 Cap Rate 7.4% 7.2% 7.9% +140 to 200 bps Retail Volume ($B) 14.3 11.9 2.7 Cap Rate 6.7% 6.7% 7.3% +140 to 190 bps Source: RCA January 2009 1. TWR estimates |
|
|
2008 Performance Overview $369 million or 38% lower than prior year $601 million Normalized EBITDA4 $377 million or 45% lower than prior year $457 million2 EBITDA Decreased 77% as compared to $1.66 EPS in prior year Decreased 54% as compared to $2.11 EPS in prior year GAAP $0.392 Adjusted $0.97 EPS3 $307 million or 79% lower than prior year $288 million or 58% lower than prior year GAAP $83.9 million2 Adjusted $208.7 million Net Income $906 million or 15% lower than prior year $5.1 billion Revenue1 1. Includes revenue from discontinued operations of $1.3 million and $2.1 million for the twelve months ended December 31, 2008 and 2007, respectively. 2. Excludes the impact of significant pending goodwill and non-amortizable intangible asset impairment charges. 3. All EPS information is based upon diluted shares. 4. Normalized EBITDA excludes merger-related charges, integration costs related to acquisitions, cost containment and the write-down of impaired assets. |
|
|
Q4 2008 Financial Results 1. Includes activity reported as “discontinued operations” including $2.1 million of revenue, $0.8 million of operating expenses, $2.7 million of minority interest expense and $7.9 million of gain on disposition of real estate. 2. Excludes the impact of significant pending goodwill and non-amortizable intangible asset impairment charges. EBITDA2 ($ in millions) 2008 20071 % Change Revenue 1,283.3 1,839.2 (30) Cost of Services 729.7 967.6 (25) Operating, Administrative & Other 425.5 639.4 (33) Merger-Related Charges - 17.1 (100) Equity (Loss) Income from Unconsolidated Subsidiaries (54.2) 28.8 (289) Minority Interest (Income) Expense (45.8) 2.1 (2,259) Other Loss (3.1) - n/a Gain on Disposition of Real Estate 4.9 16.1 (69) 121.5 257.9 (53) One Time Items: Integration Costs 3.8 10.8 (65) Cost Containment 24.1 - n/a Write-down of Impaired Assets 73.8 - n/a Merger-Related Charges - 17.1 (100) Normalized EBITDA 223.2 285.8 (22) Normalized EBITDA Margin 17.4% 15.5% |
|
|
Full Year 2008 Financial Results 1. Includes activity reported as “discontinued operations” including $1.3 million of revenue, $0.7 million of operating expenses, $16.5 million of minority interest expense and $32.8 million of gain on disposition of real estate. 2. Includes activity reported as “discontinued operations” including $2.1 million of revenue, $0.8 million of operating expenses, $2.7 million of minority interest expense and $7.9 million of gain on disposition of real estate. 3. Excludes the impact of significant pending goodwill and non-amortizable intangible asset impairment charges. EBITDA3 ($ in millions) 20081 20072 % Change Revenue 5,130.1 6,036.3 (15) Cost of Services 2,926.7 3,200.7 (9) Operating, Administrative & Other 1,747.8 1,989.5 (12) Merger-Related Charges - 56.9 n/a Equity (Loss) Income from Unconsolidated Subsidiaries (80.1) 64.9 (223) Minority Interest (Income) Expense (37.7) 14.5 (360) Other Loss (7.7) (37.5) (80) Gain on Disposition of Real Estate 51.5 32.2 60 457.0 834.3 (45) One Time Items: Integration Costs 16.4 45.2 (64) Cost Containment 27.4 - n/a Loss on Trading Securities Acquired in the Trammell - 33.7 n/a Crow Company Acquisition Write-down of Impaired Assets 100.4 - n/a Merger-Related Charges - 56.9 (100) Normalized EBITDA 601.2 970.1 (38) Normalized EBITDA Margin 11.7% 16.1% |
|
|
Revenue Breakdown 4th Quarter 2008 1. Includes revenue from discontinued operations, which totaled $2.1 million for the three and twelve months ended December 31, 2007. 2. Includes revenue from discontinued operations, which totaled $1.3 million for the twelve months ended December 31, 2008. 35% 35% 13% 7% 3% 2% 1% 4% Property & Facilities Management Leasing Sales Appraisal & Valuation Investment Management Development Services Commercial Mortgage Brokerage Other ($ in millions) 2008 2007 1 % Change 2008 2 2007 1 % Change 450.9 427.1 6 1,720.1 1,395.6 23 443.6 615.3 -28 1,710.7 1,869.7 -9 163.8 469.1 -65 869.7 1,659.9 -48 91.8 111.6 -18 355.0 386.3 -8 39.8 78.0 -49 165.0 352.1 -53 25.3 69.0 -63 110.6 125.6 -12 18.7 38.7 -52 90.5 162.9 -44 49.4 30.4 63 108.5 84.2 29 Total 1,283.3 1,839.2 -30 5,130.1 6,036.3 -15 Three months ended December 31, Twelve months ended December 31, |
|
|
Sales and Leasing Revenue - Americas ($ in millions) Sales Leasing (49%) (11%) (62%) (26%) 2008 2007 $1,024.5 $520.8 YTD Q4 $1,240.8 $1,103.9 $246.5 $93.6 Fourth Quarter $396.8 $294.4 |
|
|
Sales and Leasing Revenue – EMEA ($ in millions) Sales Leasing (47%) (8%) (70%) (28%) 2008 2007 $426.4 $392.3 $458.3 $243.2 YTD Q4 $141.6 $101.6 $158.9 $48.3 Fourth Quarter |
|
|
Sales and Leasing Revenue – Asia Pacific ($ in millions) Sales Leasing (40%) (64%) 6% (38%) 2008 2007 $173.1 $104.0 YTD Q4 $201.1 $213.8 $60.6 $21.5 Fourth Quarter $76.4 $47.5 |
|
|
Development Services Balance Sheet Participation $94 million co-invested in development services at quarter end. $4.1 million in recourse debt to CBRE. 1. Includes revenue from discontinued operations of $1.3 million for the twelve months ended December 31, 2008. 2. Includes EBITDA from discontinued operations of $16.9 million for the twelve months ended December 31, 2008. 14.9% 24.1% Normalized EBITDA Margin 17.9 7.1 Normalized EBITDA2 49.2 49.2 Write-down of impaired assets 3.1 3.1 Cost Containment Add Back: (34.4) (45.2) EBITDA2 120.1 29.4 Revenue1 12/31/2008 12/31/2008 ($ in millions) Year Ended Quarter Ended Projects In Process/Pipeline ($ in billions) 2.2 3.8 5.0 4.9 3.6 2.8 2.6 3.6 5.4 6.5 6.3 6.2 6.3 5.6 2.3 1.4 2.0 2.3 1.4 1.5 2.5 2.7 3.0 2.7 2.8 3.7 3.4 2.5 4Q98 4Q99 4Q00 4Q01 4Q02 4Q03 4Q04 4Q05 4Q06 4Q07 1Q08 2Q08 3Q08 4Q08 In Process Pipeline |
|
|
Global Investment Management ($ in billions) ($ in millions) CBRE’s co-investments totaled $72 million at the end of December 2008. CAGR 19% CAGR 22.5% ($ in millions) ($ in millions) 79.4 39.1 347.9 161.2 Q4 Revenue 33.6 32.7 38.6 6.4 7.2 2007 2008 YTD Revenue 120.4 140.7 138.8 20.1 88.7 0.4 2007 2008 Annual Revenue 57.1 68.4 94.0 99.3 126.3 259.2 160.8 - - - 28.0 101.7 88.7 0.4 57.1 68.4 94.0 127.3 228.0 347.9 161.2 2002 2003 2004 2005 2006 2007 2008 Investment Management Carried Interest Asset Management Acquisition, Disposition & Incentive Carried Interest Assets Under Management 11.4 14.4 15.1 17.3 28.6 37.8 38.5 2002 2003 2004 2005 2006 2007 2008 |
|
|
Global Investment Management Carried interest pertains to certain real estate investment funds from which CBRE earns an additional share of the profits from the fund, once its performance meets certain financial hurdles. Dedicated fund team leaders and executives in our investment management company have been granted a right to participate in the carried interest, with participation rights vesting over time. During the year ended December 31, 2008, the company recognized $0.4 million of revenue (none of which came from the three months ended December 31, 2008) from funds liquidating, also known as carried interest revenue. For the year ended December 31, 2008, the company recorded a net reversal of carried interest incentive compensation expense of $33.1 million ($25.8 million for the three months ended December 31, 2008.) The impact on segment EBITDA of the reversed incentive compensation expense related to carried interest revenue not yet recognized is reflected, as follows: Carried Interest As of December 31, 2008, the company maintained a cumulative remaining accrual of such compensation expense of approximately $23 million, which pertains to anticipated future carried interest revenue. Three Months Ended December 31, Year Ended December 31, ($ in millions) 2008 2007 2008 2007 EBITDA (10.1) 9.8 (7.6) 113.1 Add Back: Write-down of investments 24.7 - 36.5 - Normalized EBITDA 14.6 9.8 28.9 113.1 Add Back: (Reversed) accrued incentive compensation expense related to carried interest revenue not yet recognized (25.8) 8.4 (33.1) 42.9 Pro-forma Normalized EBITDA (11.2) 18.2 (4.2) 156.0 Pro-forma Normalized EBITDA Margin -29% 23% -3% 45% |
|
|
2008 Impairments Quarter to Date Year to Date ($ in millions) Americas CBRE Investors Development Services Total Americas CBRE Investors Development Services Total Operating, Administrative & Other - - 59.3 59.3 - - 59.3 59.3 Equity Loss from Unconsolidated Subsidiaries - 24.8 28.0 52.8 14.7 32.1 28.0 74.8 Minority Interest Income - (3.3) (38.1) (41.4) - (3.3) (38.1) (41.4) Other Loss - 3.1 - 3.1 - 7.7 - 7.7 Total - 24.6 49.2 73.8 14.7 36.5 49.2 100.4 |
|
|
Cost Cutting Initiatives Update on Previous $190 million Plan Total permanent run rate savings of $190 million realized as announced on the Q3 2008 call Additionally 2008 incentive compensation was reduced by over $350 million due to weaker operating results Additional $195 million Cost Reduction Efforts Expect additional $195 million in run rate savings for 2009 Areas: Staff reductions / Compensation ~ $180 million Business promotion / Advertising Travel & Entertainment ~ $15 million Office operations costs All actions to realize savings expected to be completed in the first part of 2009 Currently expect approximately $20 million in associated one time expenses in 2009 - $27 million taken in 2008 TOTAL COST SAVINGS Total cost savings of approximately $385 million for 2009 versus full year 2007 Capital expenditure target for 2009 is $30 million |
|
|
Capitalization 1. Represents notes payable on real estate in Development Services that are recourse to the company. Excludes non-recourse notes payable on real estate of $613.6 million and $459.4 million at December 31, 2008 and 2007, respectively. 2. Excludes $210.5 million and $255.8 million of non-recourse warehouse facility at December 31, 2008 and 2007, respectively, as well as $8.0 million and $42.6 million of non-recourse revolving credit facility in Development Services at December 31, 2008 and 2007, respectively. As of ($ in millions) 12/31/2008 12/31/2007 Variance Cash 158.8 342.9 (184.1) Revolving credit facility 25.8 227.1 (201.3) Senior secured term loan A 827.0 827.0 - Senior secured term loan B 949.0 960.0 (11.0) Senior secured term loan A-1 297.8 - 297.8 Notes payable on real estate1 4.1 6.6 (2.5) Other debt2 5.5 15.0 (9.5) Total debt 2,109.2 2,035.7 73.5 Stockholders' equity 1,210.7 988.5 222.2 Total capitalization 3,319.9 3,024.2 295.7 Total net debt 1,950.4 1,692.8 257.6 |
|
|
CBRE Debt Covenants & Maturity Schedule Covenant Hurdle 6/30/08 9/30/08 12/31/08 Leverage Ratio <3.75x 2.91 3.16 3.28 Interest Coverage Ratio >2.25x 6.20 5.63 4.72 Year Amount Due 2009 ~ $52 million per quarter 2010 ~ $75 million per quarter Debt Covenants Debt Maturity Schedule |
|
|
Internal Cash Flow Cap Ex D&A Net Income, as adjusted 2008 Normalized Internal Cash Flow Strong cash flow generator Low capital intensity Utilization of internal cash flow 1. Debt reduction 2. Co-investment activities 209 90 (40) 259 1 1. Represents capital expenditures, net of concessions ($ millions) |
|
|
Business Outlook With the continued uncertainty, it remains unrealistic to provide earnings guidance: In investment sales, we expect the environment to remain weak, but believe we may see modest improvement by year end We anticipate leasing will remain weak until global economies show signs of stabilizing Outsourcing should continue to grow, approaching $2 billion annually Our asset based businesses, Global Investment Management and Development Services, will continue to face significant challenges in the short term due to dropping asset values Our strategy during the downturn remains consistent: Continue to aggressively manage expenses Manage covenant compliance risk through actions and negotiation with lenders Grow market share through aggressive pursuit of new client mandates Remain prepared with contingency plans |
|
|
GAAP Reconciliation Tables |
|
|
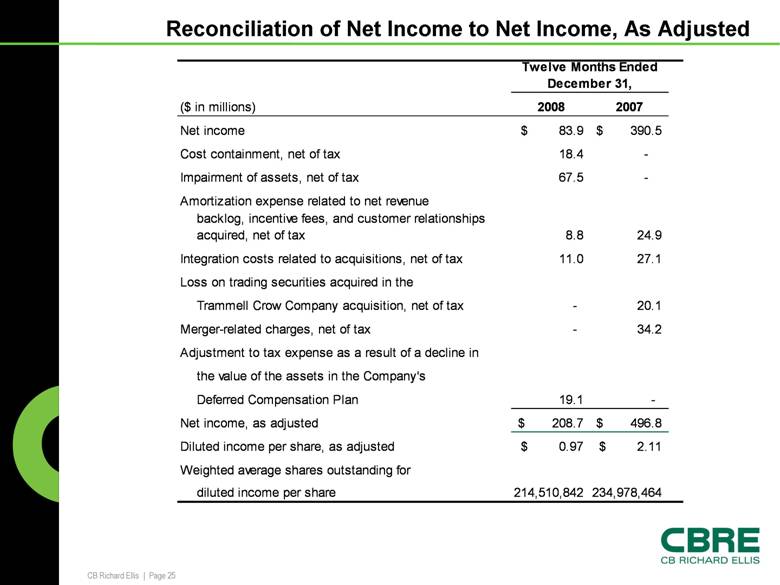
Reconciliation of Net Income to Net Income, As Adjusted 234,978,464 214,510,842 diluted income per share Weighted average shares outstanding for $ 2.11 $ 0.97 Diluted income per share, as adjusted $ 496.8 $ 208.7 Net income, as adjusted - 19.1 Deferred Compensation Plan the value of the assets in the Company's Adjustment to tax expense as a result of a decline in 34.2 - Merger-related charges, net of tax 20.1 - Trammell Crow Company acquisition, net of tax Loss on trading securities acquired in the 27.1 11.0 Integration costs related to acquisitions, net of tax 24.9 8.8 backlog, incentive fees, and customer relationships acquired, net of tax Amortization expense related to net revenue - 67.5 Impairment of assets, net of tax - 18.4 Cost containment, net of tax $ 390.5 $ 83.9 Net income 2007 2008 ($ in millions) Twelve Months Ended December 31, |
|
|
Reconciliation of Normalized EBITDA to EBITDA to Net Income 1. Includes EBITDA related to discontinued operations of $16.9 million for the twelve months ended December 31, 2008 and $6.5 million for the three and twelve months ended December 31, 2007. 2. Includes interest income related to discontinued operations of $0.1 million for the twelve months ended December 31, 2008 and $0.01 million for the three and twelve months ended December 31, 2007. 3. Includes depreciation and amortization related to discontinued operations of $0.1 million for the twelve months ended December 31, 2008 and $0.4 million for the three and twelve months ended December 31, 2007. 4. Includes interest expense related to discontinued operations of $0.6 million for the twelve months ended December 31, 2008 and $1.8 million for the three and twelve months ended December 31, 2007. 5. Includes provision for income taxes related to discontinued operations of $6.0 million for the twelve months ended December 31, 2008 and $1.6 million for the three and twelve months ended December 31, 2007. 16.1% 11.7% 15.5% 17.4% Normalized EBITDA Margin $ 6,036.3 $ 5,130.1 $ 1,839.2 $ 1,283.3 Revenue $ 390.5 $ 83.9 $ 122.4 $ 6.5 Net Income 194.3 120.3 72.8 49.7 Provision for income taxes5 164.8 167.8 40.3 40.3 Interest expense4 113.7 102.9 30.5 28.6 Depreciation and amortization3 Less: 29.0 17.9 8.1 3.6 Interest income2 Add: 834.3 457.0 257.9 121.5 EBITDA1 56.9 - 17.1 - Merger-related charges Trammell Crow Company acquisition 33.7 - - - Loss on trading securities acquired in the - 100.4 - 73.8 Write down of impaired assets - 27.4 - 24.1 Cost containment 45.2 16.4 10.8 3.8 Integration costs related to acquisitions Adjustments: $ 970.1 $ 601.2 $ 285.8 $ 223.2 Normalized EBITDA 2007 2008 2007 2008 ($ in millions) Twelve Months Ended December 31, Three Months Ended December 31, |