Exhibit 99.1
|
|
Investor Presentation May 2008 CB Richard Ellis Group, Inc. |
Exhibit 99.1
|
|
Investor Presentation May 2008 CB Richard Ellis Group, Inc. |
|
|
CB Richard Ellis | Page 2 Forward Looking Statements This presentation contains statements that are forward looking within the meaning of the Private Securities Litigation Reform Act of 1995, including statements regarding our growth momentum in 2008, future operations and future financial performance. These statements should be considered as estimates only and actual results may ultimately differ from these estimates. Except to the extent required by applicable securities laws, we undertake no obligation to update or publicly revise any of the forward-looking statements that you may hear today. Please refer to our current annual report on Form 10-K (in particular, “Risk Factors”) and our current quarterly report on Form 10-Q which are filed with the SEC and available at the SEC’s website (http://www.sec.gov), for a full discussion of the risks and other factors, that may impact any estimates that you may hear today. We may make certain statements during the course of this presentation which include references to “non-GAAP financial measures,” as defined by SEC regulations. As required by these regulations, we have provided reconciliations of these measures to what we believe are the most directly comparable GAAP measures, which are attached hereto within the appendix. |
|
|
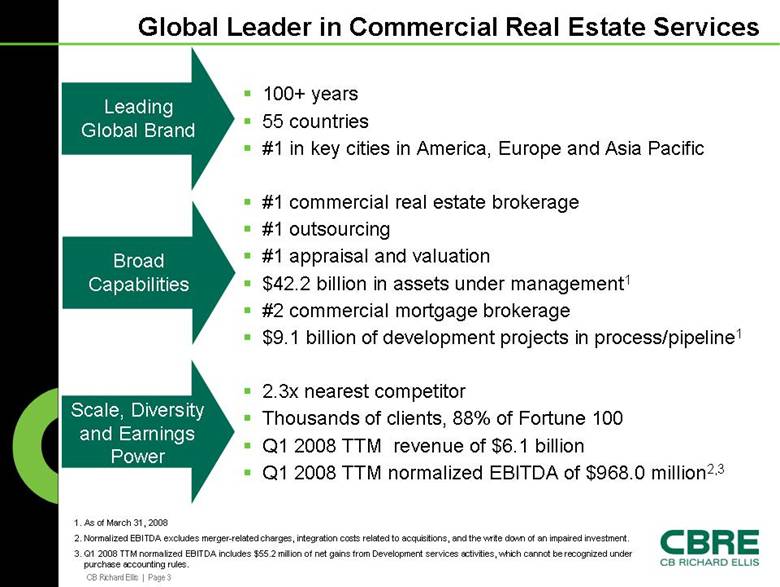
CB Richard Ellis | Page 3 Global Leader in Commercial Real Estate Services 100+ years 55 countries #1 in key cities in America, Europe and Asia Pacific #1 commercial real estate brokerage #1 outsourcing #1 appraisal and valuation $42.2 billion in assets under management1 #2 commercial mortgage brokerage $9.1 billion of development projects in process/pipeline1 2.3x nearest competitor Thousands of clients, 88% of Fortune 100 Q1 2008 TTM revenue of $6.1 billion Q1 2008 TTM normalized EBITDA of $968.0 million2,3 Leading Global Brand Broad Capabilities Scale, Diversity and Earnings Power 1. As of March 31, 2008 2. Normalized EBITDA excludes merger-related charges, integration costs related to acquisitions, and the write down of an impaired investment. 3. Q1 2008 TTM normalized EBITDA includes $55.2 million of net gains from Development services activities, which cannot be recognized under purchase accounting rules. |
|
|
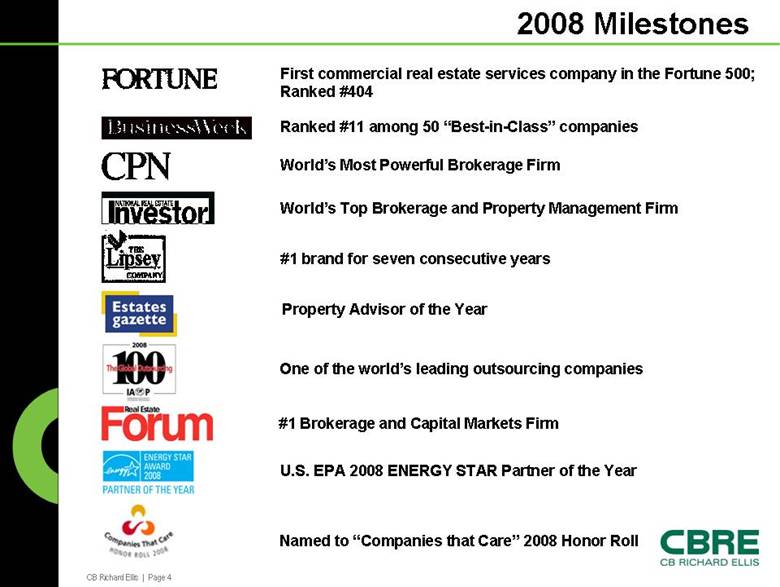
CB Richard Ellis | Page 4 2008 Milestones One of the world’s leading outsourcing companies #1 brand for seven consecutive years World’s Most Powerful Brokerage Firm World’s Top Brokerage and Property Management Firm #1 Brokerage and Capital Markets Firm U.S. EPA 2008 ENERGY STAR Partner of the Year Property Advisor of the Year First commercial real estate services company in the Fortune 500; Ranked #404 Ranked #11 among 50 “Best-in-Class” companies Named to “Companies that Care” 2008 Honor Roll |
|
|
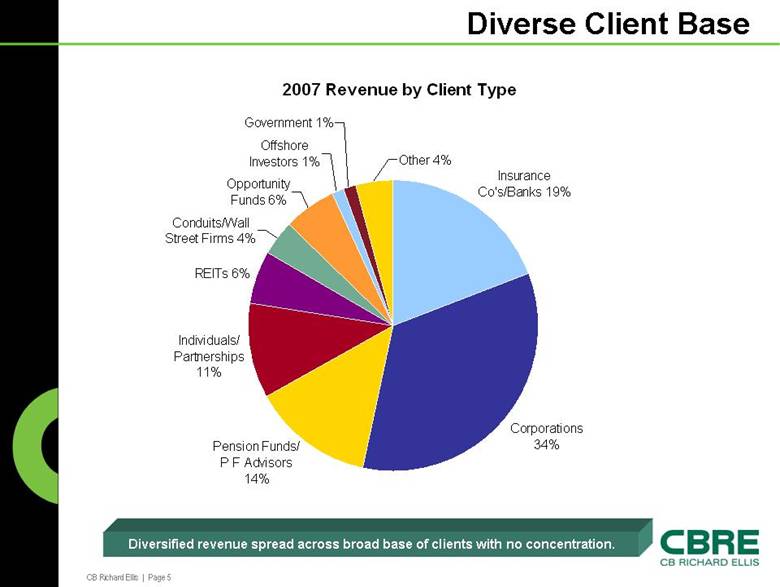
CB Richard Ellis | Page 5 Diverse Client Base 2007 Revenue by Client Type Corporations 34% Individuals/ Partnerships 11% REITs 6% Conduits/Wall Street Firms 4% Opportunity Funds 6% Offshore Investors 1% Pension Funds/ P F Advisors 14% Insurance Co’s/Banks 19% Other 4% Government 1% Diversified revenue spread across broad base of clients with no concentration. |
|
|
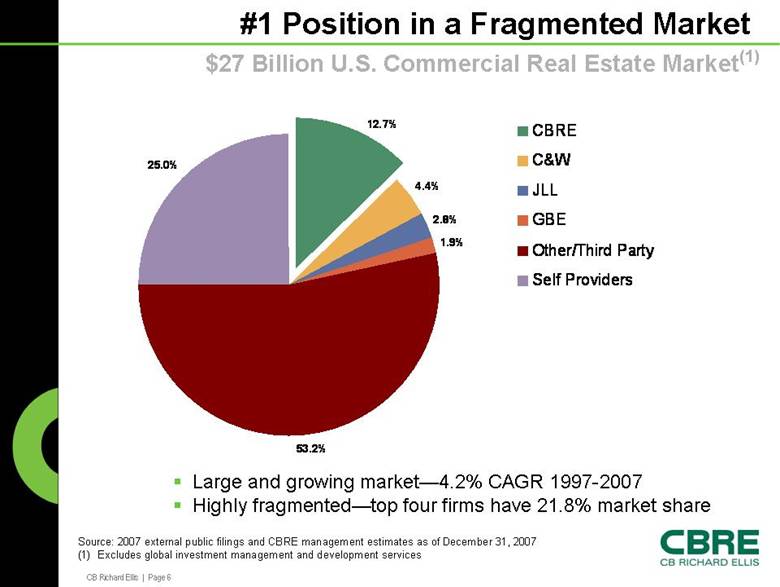
CB Richard Ellis | Page 6 #1 Position in a Fragmented Market 4.4% 2.8% 1.9% 53.2% 25.0% 12.7% CBRE C&W JLL GBE Other/Third Party Self Providers $27 Billion U.S. Commercial Real Estate Market(1) Large and growing market—4.2% CAGR 1997-2007 Highly fragmented—top four firms have 21.8% market share Source: 2007 external public filings and CBRE management estimates as of December 31, 2007 (1) Excludes global investment management and development services |
|
|
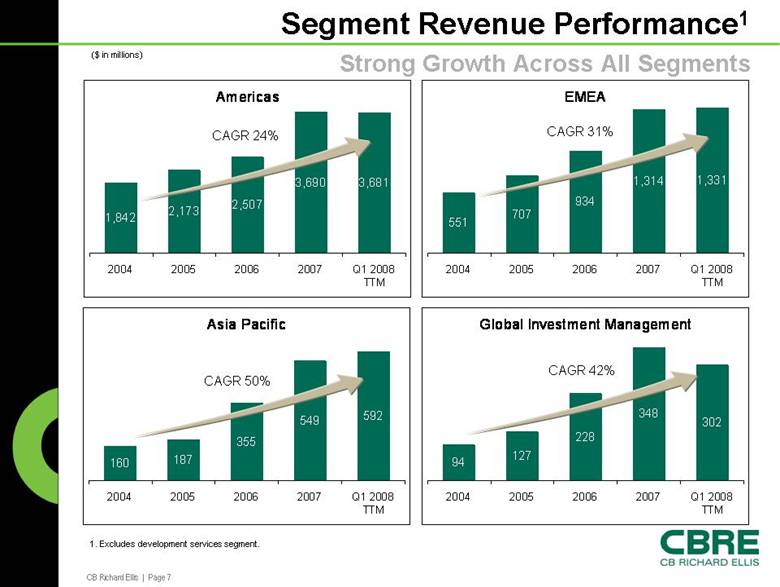
CB Richard Ellis | Page 7 Segment Revenue Performance1 Americas 1,842 2,173 2,507 3,690 3,681 2004 2005 2006 2007 Q1 2008 TTM Strong Growth Across All Segments EMEA 551 707 934 1,314 1,331 2004 2005 2006 2007 Q1 2008 TTM Global Investment Management 94 127 228 348 302 2004 2005 2006 2007 Q1 2008 TTM Asia Pacific 160 187 355 549 592 2004 2005 2006 2007 Q1 2008 TTM CAGR 42% CAGR 24% CAGR 31% CAGR 50% 1. Excludes development services segment. ($ in millions) |
|
|
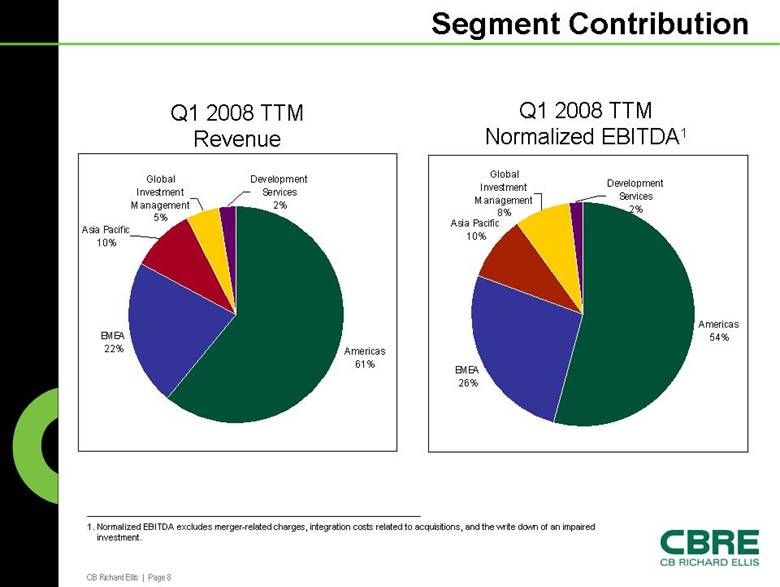
CB Richard Ellis | Page 8 Segment Contribution Q1 2008 TTM Revenue Q1 2008 TTM Normalized EBITDA1 1. Normalized EBITDA excludes merger-related charges, integration costs related to acquisitions, and the write down of an impaired investment. Americas 61% EMEA 22% Asia Pacific 10% Global Investment Management 5% Development Services 2% Americas 54% EMEA 26% Asia Pacific 10% Global Investment Management 8% Development Services 2% |
|
|
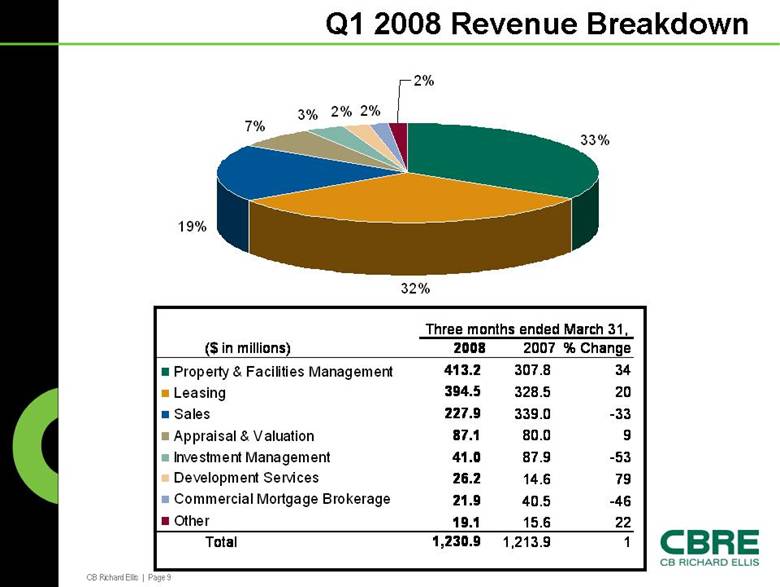
CB Richard Ellis | Page 9 Q1 2008 Revenue Breakdown 33% 32% 19% 7% 3% 2% 2% 2% Property & Facilities Management Leasing Sales Appraisal & Valuation Investment Management Development Services Commercial Mortgage Brokerage Other ($ in millions) 2008 2007 % Change 413.2 307.8 34 394.5 328.5 20 227.9 339.0 -33 87.1 80.0 9 41.0 87.9 -53 26.2 14.6 79 21.9 40.5 -46 19.1 15.6 22 Total 1,230.9 1,213.9 1 Three months ended March 31, |
|
|
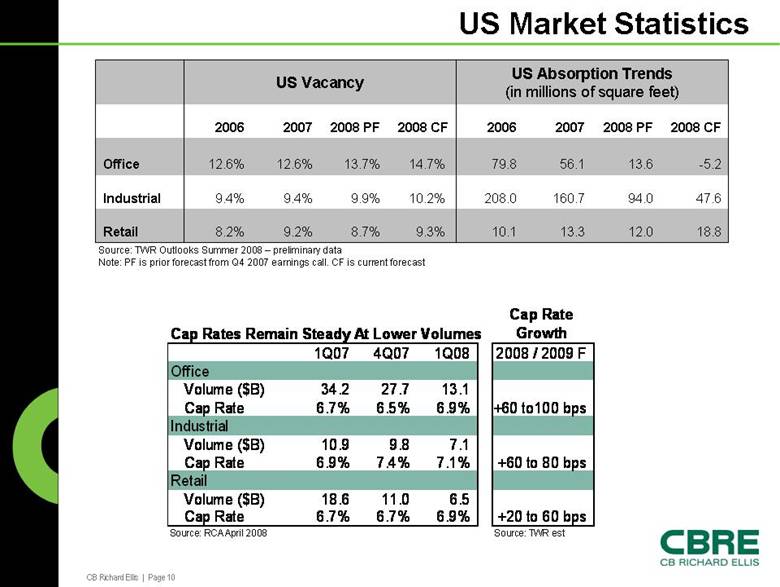
CB Richard Ellis | Page 10 US Market Statistics US Vacancy US Absorption Trends (in millions of square feet) 2006 2007 2008 PF 2008 CF 2006 2007 2008 PF 2008 CF Office 12.6% 12.6% 13.7% 14.7% 79.8 56.1 13.6 -5.2 Industrial 9.4% 9.4% 9.9% 10.2% 208.0 160.7 94.0 47.6 Retail 8.2% 9.2% 8.7% 9.3% 10.1 13.3 12.0 18.8 Source: TWR Outlooks Summer 2008 – preliminary data Note: PF is prior forecast from Q4 2007 earnings call. CF is current forecast Cap Rates Remain Steady At Lower Volumes Cap Rate Growth 1Q07 4Q07 1Q08 2008 / 2009 F Office Volume ($B) 34.2 27.7 13.1 Cap Rate 6.7% 6.5% 6.9% +60 to100 bps Industrial Volume ($B) 10.9 9.8 7.1 Cap Rate 6.9% 7.4% 7.1% +60 to 80 bps Retail Volume ($B) 18.6 11.0 6.5 Cap Rate 6.7% 6.7% 6.9% +20 to 60 bps Source: RCA April 2008 Source: TWR est |
|
|
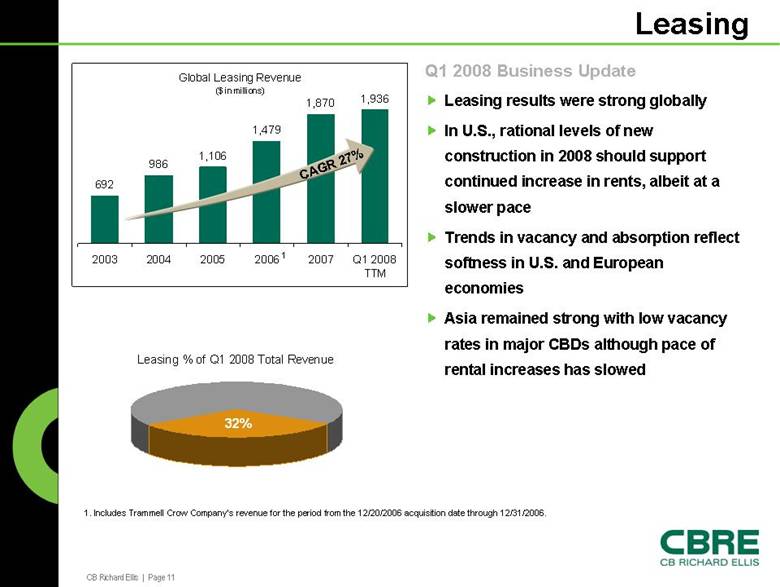
CB Richard Ellis | Page 11 Leasing Q1 2008 Business Update Leasing results were strong globally In U.S., rational levels of new construction in 2008 should support continued increase in rents, albeit at a slower pace Trends in vacancy and absorption reflect softness in U.S. and European economies Asia remained strong with low vacancy rates in major CBDs although pace of rental increases has slowed Global Leasing Revenue ($ in millions) 692 986 1,106 1,479 1,870 1,936 2003 2004 2005 2006 2007 Q1 2008 TTM Leasing % of Q1 2008 Total Revenue 32% 1 1. Includes Trammell Crow Company’s revenue for the period from the 12/20/2006 acquisition date through 12/31/2006. CAGR 27% |
|
|
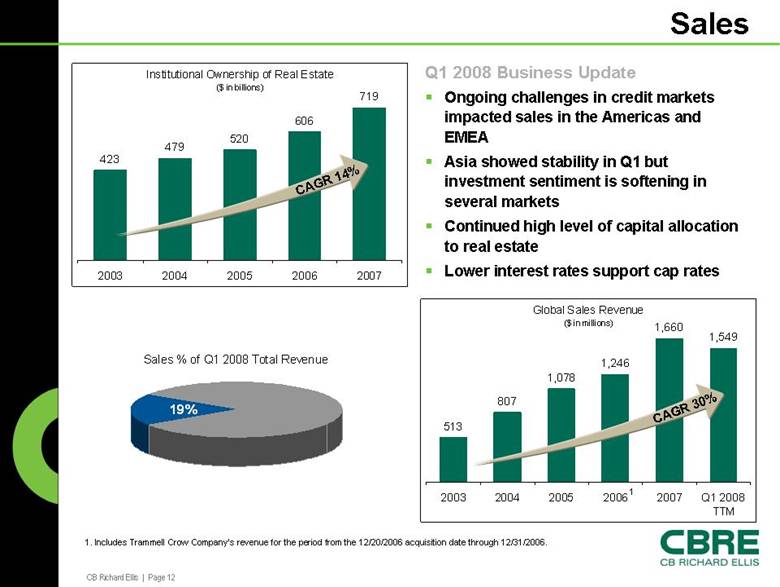
CB Richard Ellis | Page 12 Sales Q1 2008 Business Update Ongoing challenges in credit markets impacted sales in the Americas and EMEA Asia showed stability in Q1 but investment sentiment is softening in several markets Continued high level of capital allocation to real estate Lower interest rates support cap rates Global Sales Revenue ($ in millions) 513 807 1,078 1,246 1,660 1,549 2003 2004 2005 2006 2007 Q1 2008 TTM CAGR 30% Sales % of Q1 2008 Total Revenue 19% 1 1. Includes Trammell Crow Company’s revenue for the period from the 12/20/2006 acquisition date through 12/31/2006. Institutional Ownership of Real Estate ($ in billions) 423 479 520 606 719 2003 2004 2005 2006 2007 CAGR 14% |
|
|
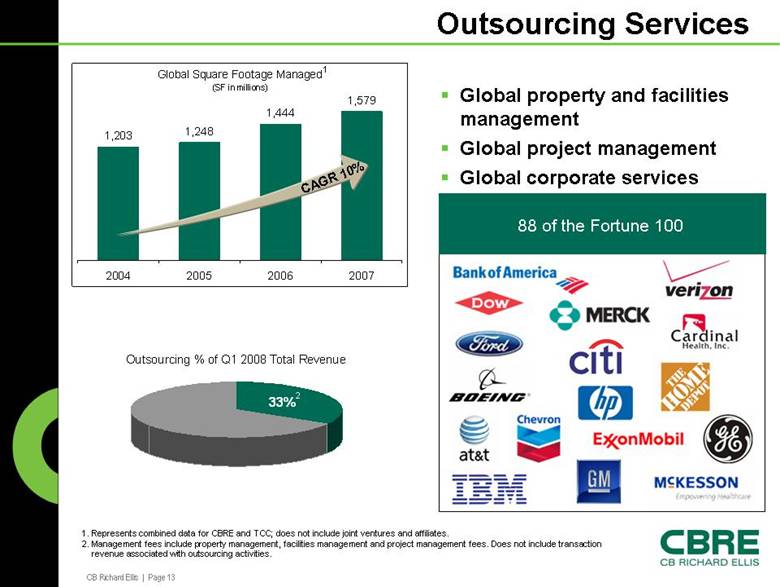
CB Richard Ellis | Page 13 Outsourcing Services Global property and facilities management Global project management Global corporate services Global Square Footage Managed (SF in millions) 1,203 1,248 1,444 1,579 2004 2005 2006 2007 Outsourcing % of Q1 2008 Total Revenue 33% 1 88 of the Fortune 100 1. Represents combined data for CBRE and TCC; does not include joint ventures and affiliates. 2. Management fees include property management, facilities management and project management fees. Does not include transaction revenue associated with outsourcing activities. 2 CAGR 10% |
|
|
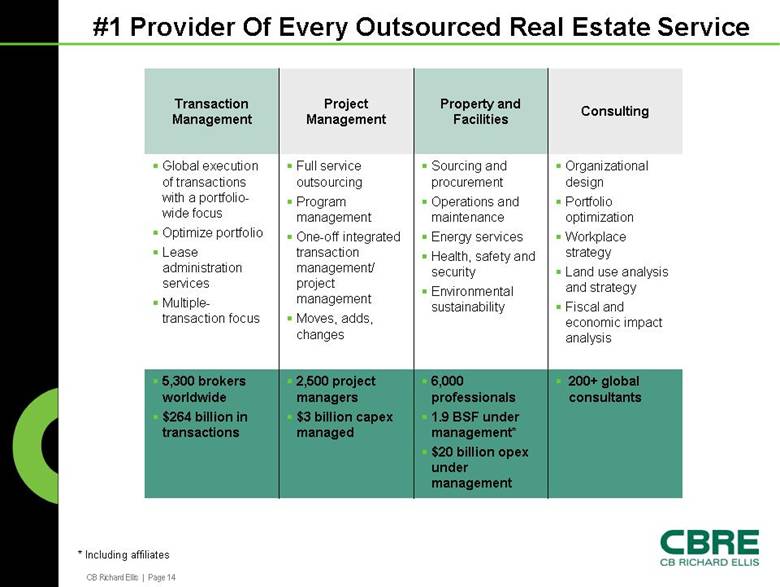
CB Richard Ellis | Page 14 #1 Provider Of Every Outsourced Real Estate Service * Including affiliates Transaction Management Project Management Property and Facilities Consulting Global execution of transactions with a portfolio-wide focus Optimize portfolio Lease administration services Multiple-transaction focus Full service outsourcing Program management One-off integrated transaction management/ project management Moves, adds, changes Sourcing and procurement Operations and maintenance Energy services Health, safety and security Environmental sustainability Organizational design Portfolio optimization Workplace strategy Land use analysis and strategy Fiscal and economic impact analysis 5,300 brokers worldwide $264 billion in transactions 2,500 project managers $3 billion capex managed 6,000 professionals 1.9 BSF under management* $20 billion opex under management 200+ global consultants |
|
|
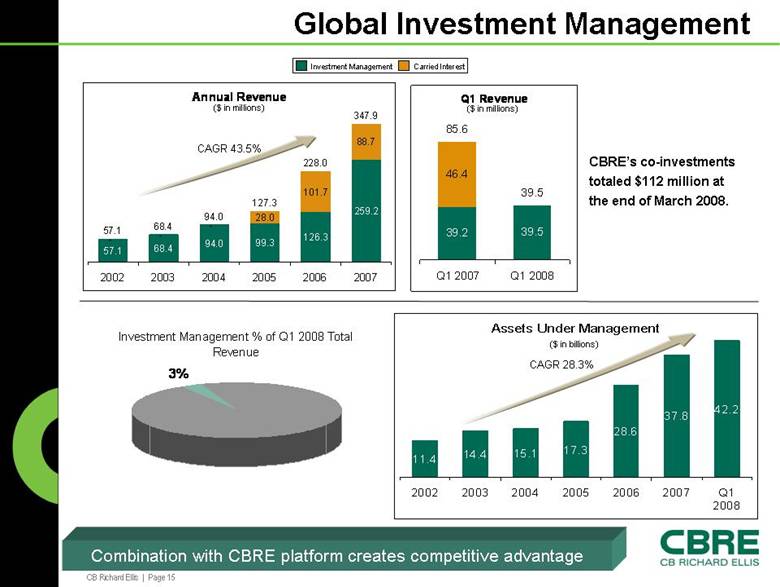
CB Richard Ellis | Page 15 Global Investment Management Annual Revenue 57.1 68.4 94.0 99.3 126.3 259.2 - - - 28.0 101.7 88.7 57.1 68.4 94.0 127.3 228.0 347.9 2002 2003 2004 2005 2006 2007 Assets Under Management 11.4 14.4 15.1 17.3 28.6 37.8 42.2 2002 2003 2004 2005 2006 2007 Q1 2008 Q1 Revenue 39.2 39.5 46.4 85.6 39.5 Q1 2007 Q1 2008 ($ in billions) Investment Management Carried Interest ($ in millions) CBRE’s co-investments totaled $112 million at the end of March 2008. CAGR 43.5% CAGR 28.3% Investment Management % of Q1 2008 Total Revenue 3% ($ in millions) Combination with CBRE platform creates competitive advantage |
|
|
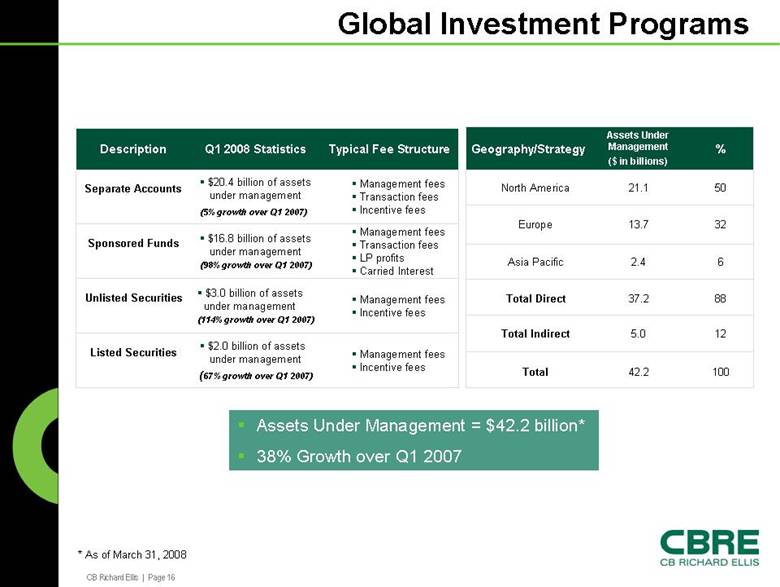
CB Richard Ellis | Page 16 Global Investment Programs Description Q1 2008 Statistics Typical Fee Structure Separate Accounts $20.4 billion of assets under management (5% growth over Q1 2007) Management fees Transaction fees Incentive fees Sponsored Funds $16.8 billion of assets under management (98% growth over Q1 2007) Management fees Transaction fees LP profits Carried Interest Unlisted Securities $3.0 billion of assets under management (114% growth over Q1 2007) Management fees Incentive fees Listed Securities $2.0 billion of assets under management (67% growth over Q1 2007) Management fees Incentive fees Geography/Strategy Assets Under Management ($ in billions) % North America 21.1 50 Europe 13.7 32 Asia Pacific 2.4 6 Total Direct 37.2 88 Total Indirect 5.0 12 Total 42.2 100 Assets Under Management = $42.2 billion* 38% Growth over Q1 2007 * As of March 31, 2008 |
|
|
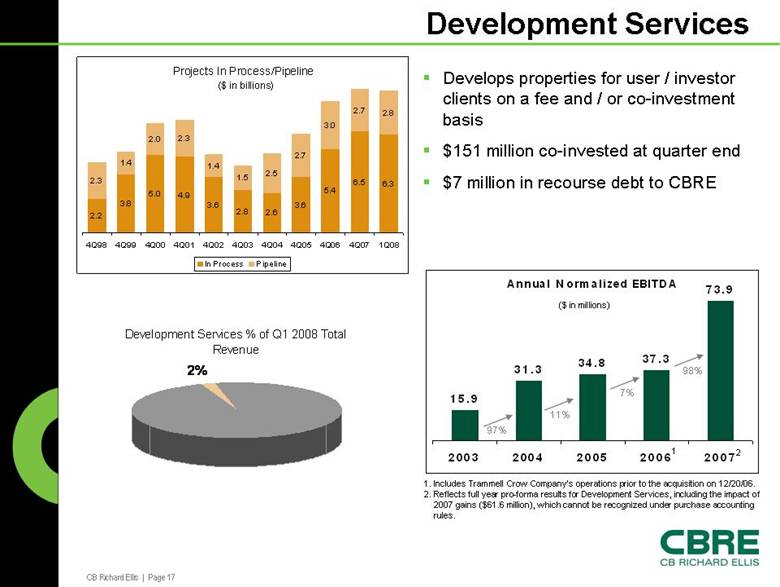
CB Richard Ellis | Page 17 Development Services Develops properties for user / investor clients on a fee and / or co-investment basis $151 million co-invested at quarter end $7 million in recourse debt to CBRE Projects In Process/Pipeline ($ in billions) 2.2 3.8 5.0 4.9 3.6 2.8 2.6 3.6 5.4 6.5 6.3 2.3 1.4 2.0 2.3 1.4 1.5 2.5 2.7 3.0 2.7 2.8 4Q98 4Q99 4Q00 4Q01 4Q02 4Q03 4Q04 4Q05 4Q06 4Q07 1Q08 In Process Pipeline Development Services % of Q1 2008 Total Revenue 2% Annual Normalized EBITDA 15.9 31.3 34.8 37.3 73.9 2003 2004 2005 2006 2007 1. Includes Trammell Crow Company’s operations prior to the acquisition on 12/20/06. 2. Reflects full year pro-forma results for Development Services, including the impact of 2007 gains ($61.6 million), which cannot be recognized under purchase accounting rules. 97% 11% 7% 98% 1 2 ($ in millions) |
|
|
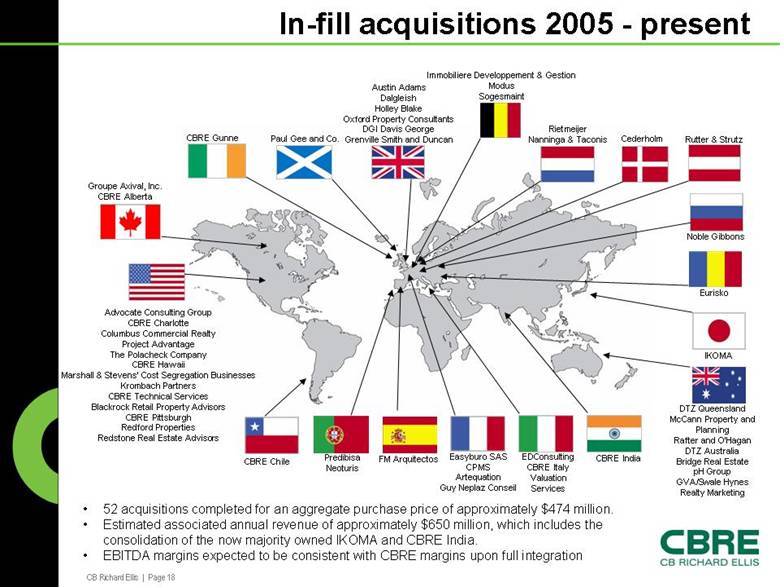
CB Richard Ellis | Page 18 In-fill acquisitions 2005 - present Groupe Axival, Inc. CBRE Alberta Advocate Consulting Group CBRE Charlotte Columbus Commercial Realty Project Advantage The Polacheck Company CBRE Hawaii Marshall & Stevens’ Cost Segregation Businesses Krombach Partners CBRE Technical Services Blackrock Retail Property Advisors CBRE Pittsburgh Redford Properties Redstone Real Estate Advisors CBRE Chile CBRE Gunne Paul Gee and Co. Austin Adams Dalgleish Holley Blake Oxford Property Consultants DGI Davis George Grenville Smith and Duncan Immobiliere Developpement & Gestion Modus Sogesmaint Cederholm Rietmeijer Nanninga & Taconis Rutter & Strutz Eurisko Noble Gibbons IKOMA DTZ Queensland McCann Property and Planning Rafter and O’Hagan DTZ Australia Bridge Real Estate pH Group GVA/Swale Hynes Realty Marketing CBRE India EDConsulting CBRE Italy Valuation Services Easyburo SAS CPMS Artequation Guy Neplaz Conseil FM Arquitectos Predibisa Neoturis • 52 acquisitions completed for an aggregate purchase price of approximately $474 million. • Estimated associated annual revenue of approximately $650 million, which includes the consolidation of the now majority owned IKOMA and CBRE India. • EBITDA margins expected to be consistent with CBRE margins upon full integration |
|
|
CB Richard Ellis | Page 19 Financial Overview |
|
|
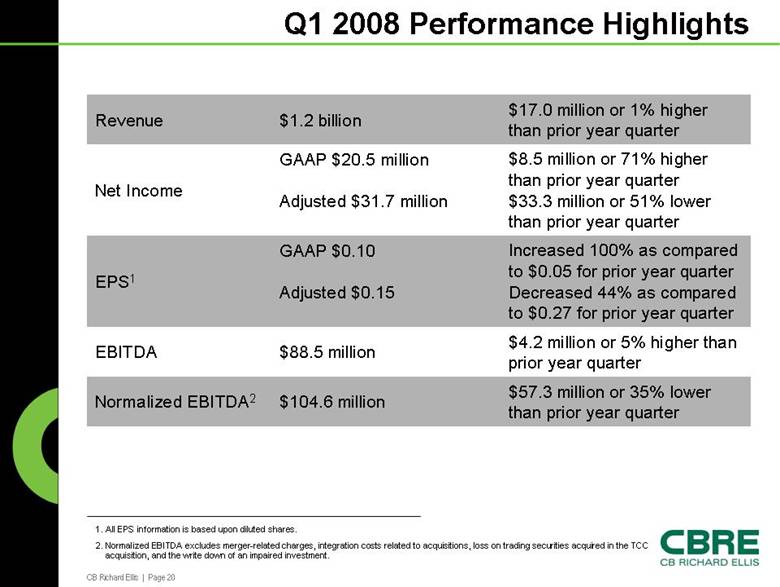
CB Richard Ellis | Page 20 Q1 2008 Performance Highlights Revenue $1.2 billion $17.0 million or 1% higher than prior year quarter Net Income GAAP $20.5 million Adjusted $31.7 million $8.5 million or 71% higher than prior year quarter $33.3 million or 51% lower than prior year quarter EPS1 GAAP $0.10 Adjusted $0.15 Increased 100% as compared to $0.05 for prior year quarter Decreased 44% as compared to $0.27 for prior year quarter EBITDA $88.5 million $4.2 million or 5% higher than prior year quarter Normalized EBITDA2 $104.6 million $57.3 million or 35% lower than prior year quarter 1. All EPS information is based upon diluted shares. 2. Normalized EBITDA excludes merger-related charges, integration costs related to acquisitions, loss on trading securities acquired in the TCC acquisition, and the write down of an impaired investment. |
|
|
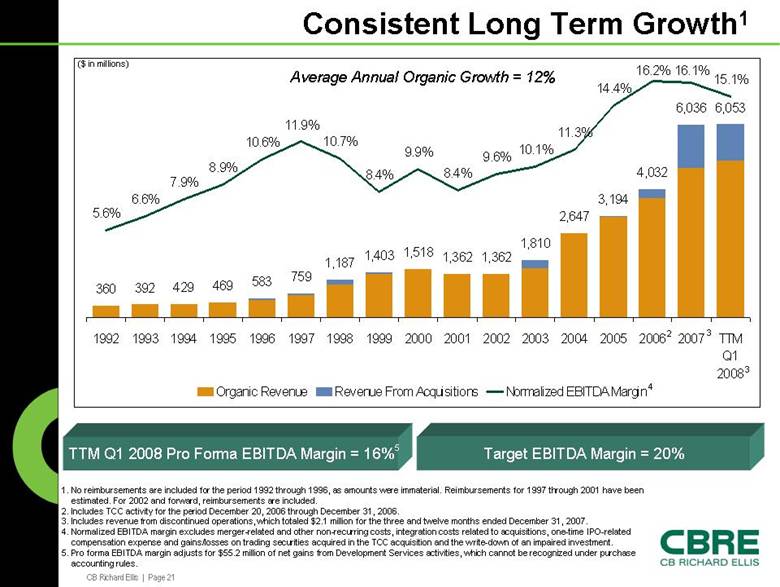
CB Richard Ellis | Page 21 Consistent Long Term Growth1 5.6% 6.6% 7.9% 8.9% 10.6% 11.9% 10.7% 8.4% 9.9% 8.4% 9.6% 10.1% 11.3% 14.4% 16.2% 16.1% 15.1% 360 392 429 469 583 759 1,187 1,403 1,518 1,362 1,362 1,810 2,647 3,194 4,032 6,036 6,053 1992 1993 1994 1995 1996 1997 1998 1999 2000 2001 2002 2003 2004 2005 2006 2007 TTM Q1 2008 Organic Revenue Revenue From Acquisitions Normalized EBITDA Margin . Average Annual Organic Growth = 12% ($ in millions) TTM Q1 2008 Pro Forma EBITDA Margin = 16% Target EBITDA Margin = 20% 1. No reimbursements are included for the period 1992 through 1996, as amounts were immaterial. Reimbursements for 1997 through 2001 have been estimated. For 2002 and forward, reimbursements are included. 2. Includes TCC activity for the period December 20, 2006 through December 31, 2006. 3. Includes revenue from discontinued operations, which totaled $2.1 million for the three and twelve months ended December 31, 2007. 4. Normalized EBITDA margin excludes merger-related and other non-recurring costs, integration costs related to acquisitions, one-time IPO-related compensation expense and gains/losses on trading securities acquired in the TCC acquisition and the write-down of an impaired investment. 5. Pro forma EBITDA margin adjusts for $55.2 million of net gains from Development Services activities, which cannot be recognized under purchase accounting rules. 2 3 4 5 3 |
|
|
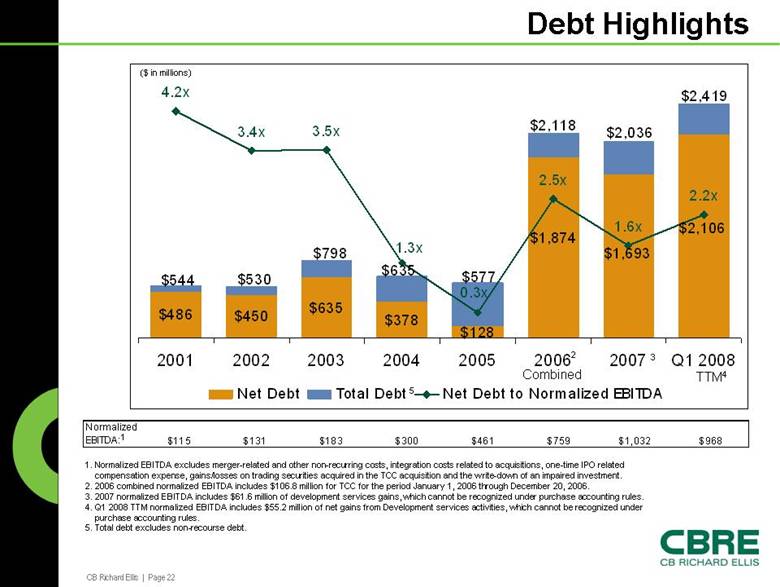
CB Richard Ellis | Page 22 $486 $450 $635 $378 $128 $1,693 $1,874 $2,106 4.2x 3.4x 3.5x 2.5x 2.2x 1.6x 1.3x 0.3x $544 $530 $798 $635 $577 $2,118 $2,036 $2,419 2001 2002 2003 2004 2005 2006 2007 Q1 2008 Net Debt Total Debt Net Debt to Normalized EBITDA . Debt Highlights Normalized EBITDA: $115 $131 $183 $300 $461 $759 $1,032 $968 1. Normalized EBITDA excludes merger-related and other non-recurring costs, integration costs related to acquisitions, one-time IPO related compensation expense, gains/losses on trading securities acquired in the TCC acquisition and the write-down of an impaired investment. 2. 2006 combined normalized EBITDA includes $106.8 million for TCC for the period January 1, 2006 through December 20, 2006. 3. 2007 normalized EBITDA includes $61.6 million of development services gains, which cannot be recognized under purchase accounting rules. 4. Q1 2008 TTM normalized EBITDA includes $55.2 million of net gains from Development services activities, which cannot be recognized under purchase accounting rules. 5. Total debt excludes non-recourse debt. ($ in millions) 1 2 3 TTM4 5 Combined |
|
|
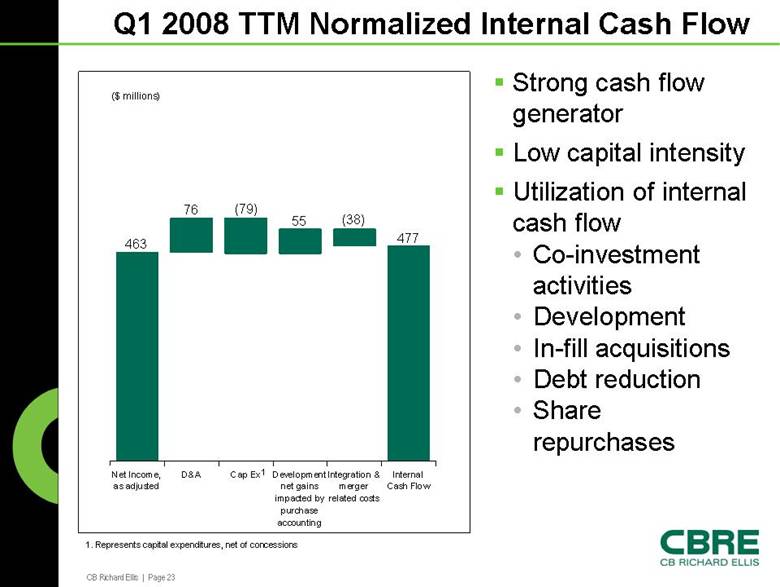
CB Richard Ellis | Page 23 Q1 2008 TTM Normalized Internal Cash Flow Strong cash flow generator Low capital intensity Utilization of internal cash flow • Co-investment activities • Development • In-fill acquisitions • Debt reduction • Share repurchases Internal Cash Flow Integration & merger related costs Development net gains impacted by purchase accounting Cap Ex D&A Net Income, as adjusted ($ millions) 463 76 (79) 55 (38) 477 1 1. Represents capital expenditures, net of concessions |
|
|
CB Richard Ellis | Page 24 Key Investment Points Uniquely positioned to thrive in tough market – Most diversified revenue base (geography and services) – Strong balance sheet – Variable cost structure – Strong cash flow generation Opportunity to gain share / grow – Cross selling – Industry consolidation – Acquisition opportunities – Attracting and retaining talent |
|
|
CB Richard Ellis | Page 25 GAAP Reconciliation Tables |
|
|
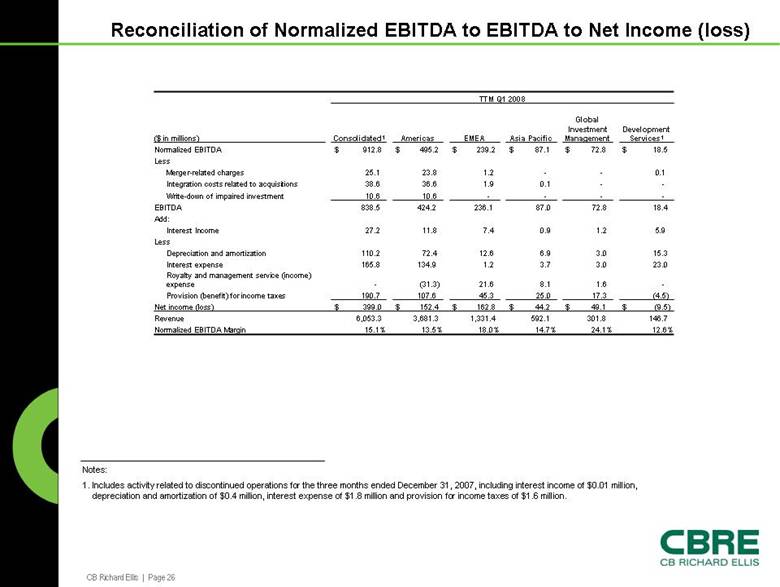
CB Richard Ellis | Page 26 Reconciliation of Normalized EBITDA to EBITDA to Net Income (loss) Notes: 1. Includes activity related to discontinued operations for the three months ended December 31, 2007, including interest income of $0.01 million, depreciation and amortization of $0.4 million, interest expense of $1.8 million and provision for income taxes of $1.6 million. TTM Q1 2008 ($ in millions) Consolidated1 Americas EMEA Asia Pacific Global Investment Management Development Services1 Normalized EBITDA $ 912.8 $ 495.2 $ 239.2 $ 87.1 $ 72.8 $ 18.5 Less Merger-related charges 25.1 23.8 1.2 - - 0.1 Integration costs related to acquisitions 38.6 36.6 1.9 0.1 - - Write-down of impaired investment 10.6 10.6 - - - - EBITDA 838.5 424.2 236.1 87.0 72.8 18.4 Add: Interest Income 27.2 11.8 7.4 0.9 1.2 5.9 Less Depreciation and amortization 110.2 72.4 12.6 6.9 3.0 15.3 Interest expense 165.8 134.9 1.2 3.7 3.0 23.0 Royalty and management service (income) expense - (31.3) 21.6 8.1 1.6 - Provision (benefit) for income taxes 190.7 107.6 45.3 25.0 17.3 (4.5) Net income (loss) $ 399.0 $ 152.4 $ 162.8 $ 44.2 $ 49.1 $ (9.5) Revenue 6,053.3 3,681.3 1,331.4 592.1 301.8 146.7 Normalized EBITDA Margin 15.1% 13.5% 18.0% 14.7% 24.1% 12.6% |
|
|
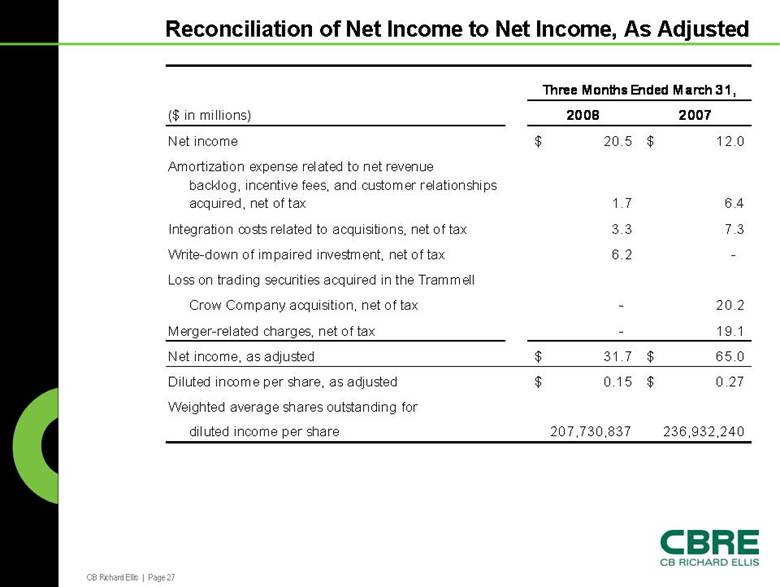
CB Richard Ellis | Page 27 Reconciliation of Net Income to Net Income, As Adjusted ($ in millions) 2008 2007 Net income 20.5 $ 12.0 $ Amortization expense related to net revenue backlog, incentive fees, and customer relationships acquired, net of tax 1.7 6.4 Integration costs related to acquisitions, net of tax 3.3 7.3 Write-down of impaired investment, net of tax 6.2 - Loss on trading securities acquired in the Trammell Crow Company acquisition, net of tax - 20.2 Merger-related charges, net of tax - 19.1 Net income, as adjusted 31.7 $ 65.0 $ Diluted income per share, as adjusted 0.15 $ 0.27 $ Weighted average shares outstanding for diluted income per share 207,730,837 236,932,240 Three Months Ended March 31, |
|
|
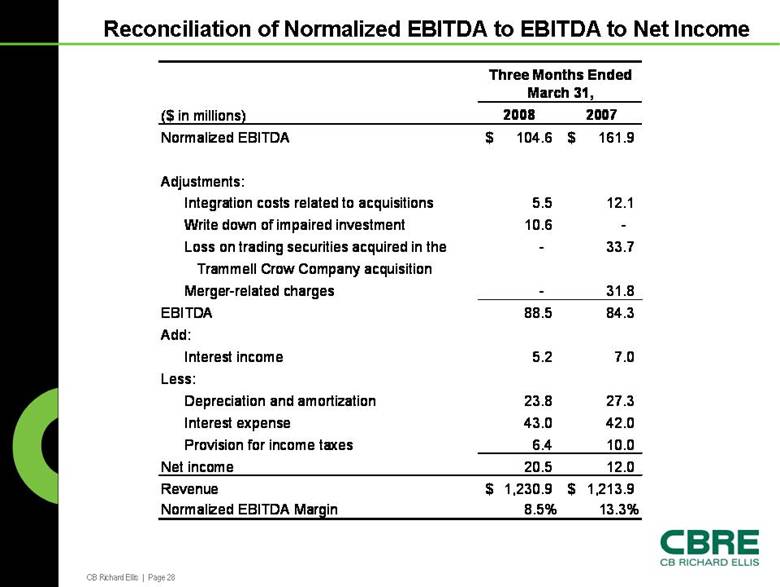
CB Richard Ellis | Page 28 Reconciliation of Normalized EBITDA to EBITDA to Net Income ($ in millions) 2008 2007 Normalized EBITDA 104.6 $ 161.9 $ Adjustments: Integration costs related to acquisitions 5.5 12.1 Write down of impaired investment 10.6 - Loss on trading securities acquired in the - 33.7 Trammell Crow Company acquisition Merger-related charges - 31.8 EBITDA 88.5 84.3 Add: Interest income 5.2 7.0 Less: Depreciation and amortization 23.8 27.3 Interest expense 43.0 42.0 Provision for income taxes 6.4 10.0 Net income 20.5 12.0 Revenue 1,230.9 $ 1,213.9 $ Normalized EBITDA Margin 8.5% 13.3% Three Months Ended March 31, |
|
|
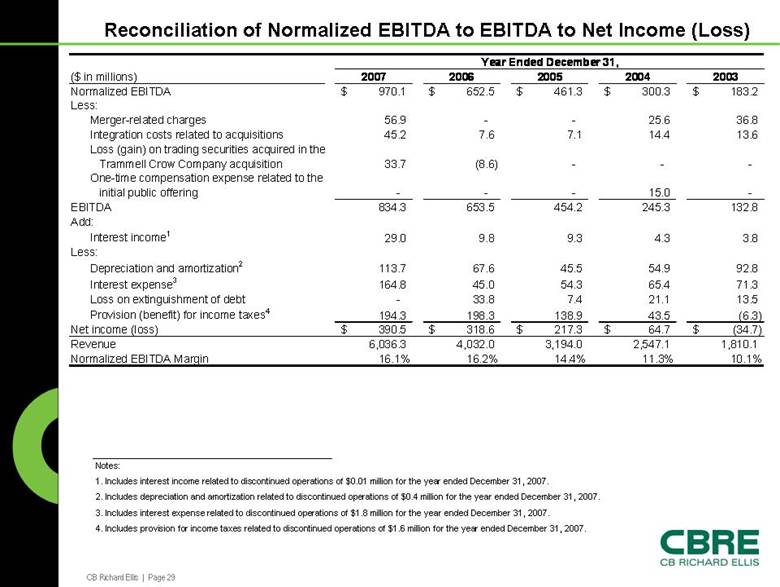
CB Richard Ellis | Page 29 Reconciliation of Normalized EBITDA to EBITDA to Net Income (Loss) Notes: 1. Includes interest income related to discontinued operations of $0.01 million for the year ended December 31, 2007. 2. Includes depreciation and amortization related to discontinued operations of $0.4 million for the year ended December 31, 2007. 3. Includes interest expense related to discontinued operations of $1.8 million for the year ended December 31, 2007. 4. Includes provision for income taxes related to discontinued operations of $1.6 million for the year ended December 31, 2007. ($ in millions) 2007 2006 2005 2004 2003 Normalized EBITDA 970.1 $ 652.5 $ 461.3 $ 300.3 $ 183.2 $ Less: Merger-related charges 56.9 - - 25.6 36.8 Integration costs related to acquisitions 45.2 7.6 7.1 14.4 13.6 Loss (gain) on trading securities acquired in the Trammell Crow Company acquisition 33.7 (8.6) - - - One-time compensation expense related to the initial public offering - - - 15.0 - EBITDA 834.3 653.5 454.2 245.3 132.8 Add: Interest income1 29.0 9.8 9.3 4.3 3.8 Less: Depreciation and amortization2 113.7 67.6 45.5 54.9 92.8 Interest expense3 164.8 45.0 54.3 65.4 71.3 Loss on extinguishment of debt - 33.8 7.4 21.1 13.5 Provision (benefit) for income taxes4 194.3 198.3 138.9 43.5 (6.3) Net income (loss) 390.5 $ 318.6 $ 217.3 $ 64.7 $ (34.7) $ Revenue 6,036.3 4,032.0 3,194.0 2,547.1 1,810.1 Normalized EBITDA Margin 16.1% 16.2% 14.4% 11.3% 10.1% Year Ended December 31, |
|
|
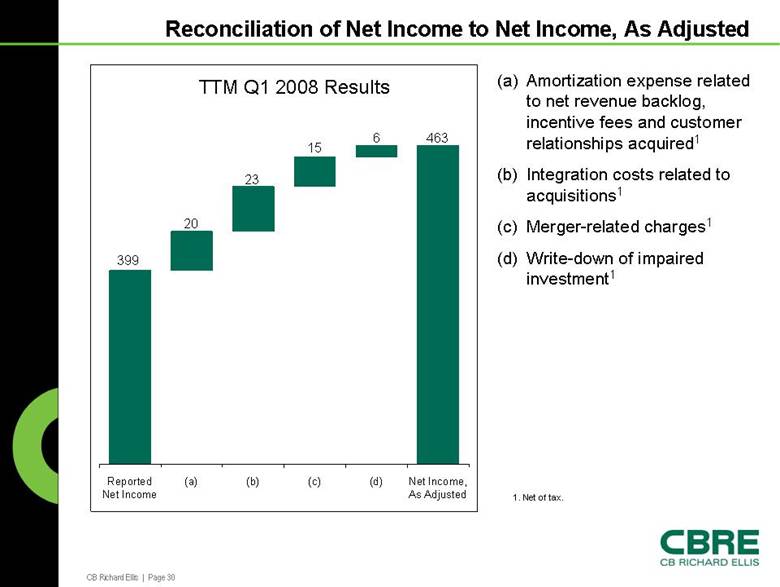
CB Richard Ellis | Page 30 Reconciliation of Net Income to Net Income, As Adjusted Net Income, As Adjusted (d) (c) (b) (a) Reported Net Income TTM Q1 2008 Results 399 20 23 15 6 463 (a) Amortization expense related to net revenue backlog, incentive fees and customer relationships acquired1 (b) Integration costs related to acquisitions1 (c) Merger-related charges1 (d) Write-down of impaired investment1 1. Net of tax. |