Exhibit 99.2
|
|
First Quarter 2008 Earnings Conference Call April 30, 2008 CB Richard Ellis Group, Inc. |
Exhibit 99.2
|
|
First Quarter 2008 Earnings Conference Call April 30, 2008 CB Richard Ellis Group, Inc. |
|
|
CB Richard Ellis | Page 2 Forward Looking Statements This presentation contains statements that are forward looking within the meaning of the Private Securities Litigation Reform Act of 1995, including statements regarding our growth momentum in 2008, future operations, future expenses, and future financial performance. These statements should be considered as estimates only and actual results may ultimately differ from these estimates. Except to the extent required by applicable securities laws, we undertake no obligation to update or publicly revise any of the forward-looking statements that you may hear today. Please refer to our current annual report on Form 10-K (in particular, Risk Factors) which is filed with the SEC and available at the SEC’s website (http://www.sec.gov), for a full discussion of the risks and other factors that may impact any estimates that you may hear today. We may make certain statements during the course of this presentation which include references to “non-GAAP financial measures,” as defined by SEC regulations. As required by these regulations, we have provided reconciliations of these measures to what we believe are the most directly comparable GAAP measures, which are attached hereto within the appendix. |
|
|
CB Richard Ellis | Page 3 Conference Call Participants Brett White President & Chief Executive Officer Kenneth J. Kay Senior Executive Vice President & Chief Financial Officer Bill Concannon Vice Chairman, Global Corporate Services Nick Kormeluk Senior Vice President, Investor Relations |
|
|
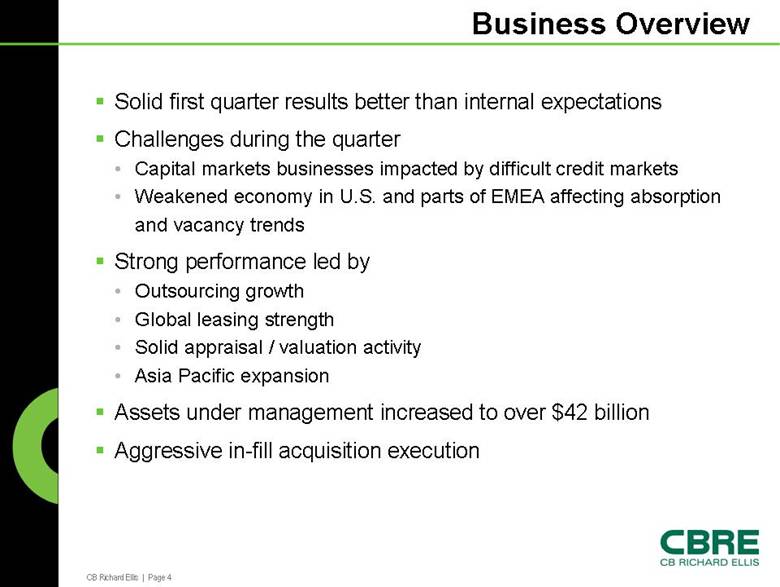
CB Richard Ellis | Page 4 Business Overview Solid first quarter results better than internal expectations Challenges during the quarter • Capital markets businesses impacted by difficult credit markets • Weakened economy in U.S. and parts of EMEA affecting absorption and vacancy trends Strong performance led by • Outsourcing growth • Global leasing strength • Solid appraisal / valuation activity • Asia Pacific expansion Assets under management increased to over $42 billion Aggressive in-fill acquisition execution |
|
|
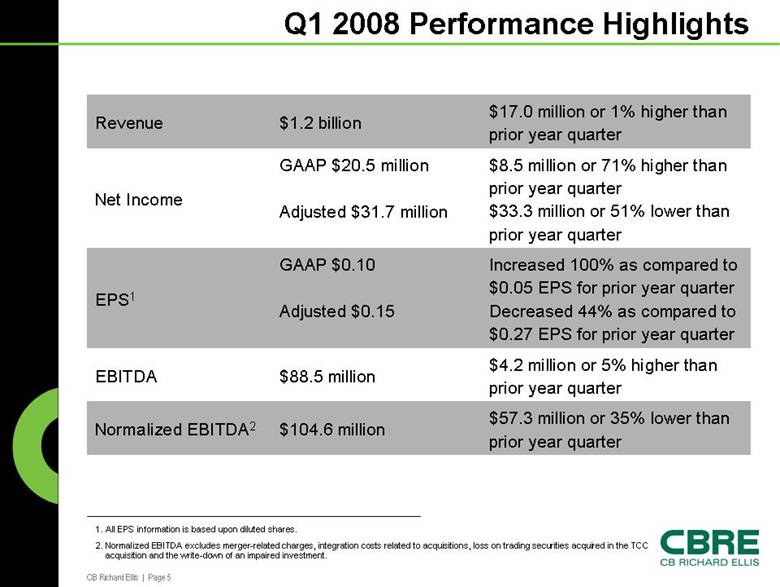
CB Richard Ellis | Page 5 Q1 2008 Performance Highlights $57.3 million or 35% lower than prior year quarter $104.6 million Normalized EBITDA2 $4.2 million or 5% higher than prior year quarter $88.5 million EBITDA Increased 100% as compared to $0.05 EPS for prior year quarter Decreased 44% as compared to $0.27 EPS for prior year quarter GAAP $0.10 Adjusted $0.15 EPS1 $8.5 million or 71% higher than prior year quarter $33.3 million or 51% lower than prior year quarter GAAP $20.5 million Adjusted $31.7 million Net Income $17.0 million or 1% higher than prior year quarter $1.2 billion Revenue 1. All EPS information is based upon diluted shares. 2. Normalized EBITDA excludes merger-related charges, integration costs related to acquisitions, loss on trading securities acquired in the TCC acquisition and the write-down of an impaired investment. |
|
|
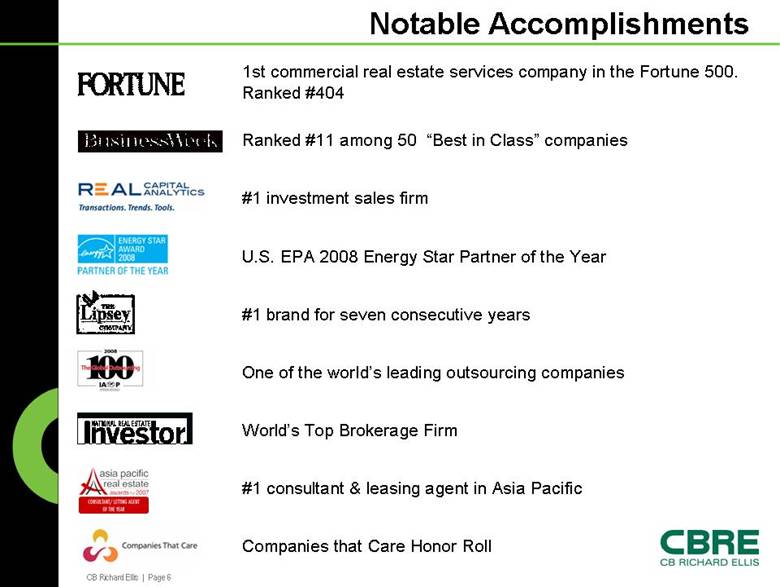
CB Richard Ellis | Page 6 Notable Accomplishments #1 investment sales firm Companies that Care Honor Roll #1 consultant & leasing agent in Asia Pacific World’s Top Brokerage Firm One of the world’s leading outsourcing companies #1 brand for seven consecutive years U.S. EPA 2008 Energy Star Partner of the Year Ranked #11 among 50 “Best in Class” companies 1st commercial real estate services company in the Fortune 500. Ranked #404 |
|
|
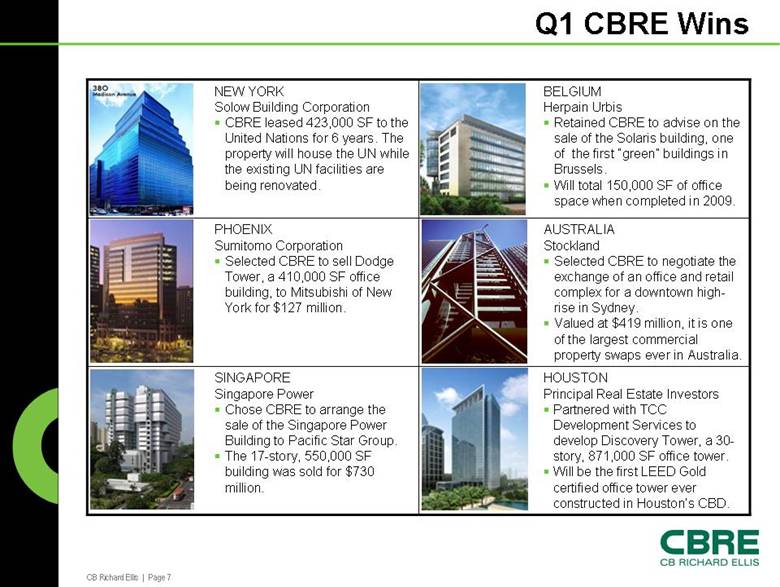
CB Richard Ellis | Page 7 Q1 CBRE Wins HOUSTON Principal Real Estate Investors Partnered with TCC Development Services to develop Discovery Tower, a 30-story, 871,000 SF office tower. Will be the first LEED Gold certified office tower ever constructed in Houston’s CBD. SINGAPORE Singapore Power Chose CBRE to arrange the sale of the Singapore Power Building to Pacific Star Group. The 17-story, 550,000 SF building was sold for $730 million. AUSTRALIA Stockland Selected CBRE to negotiate the exchange of an office and retail complex for a downtown high-rise in Sydney. Valued at $419 million, it is one of the largest commercial property swaps ever in Australia. PHOENIX Sumitomo Corporation Selected CBRE to sell Dodge Tower, a 410,000 SF office building, to Mitsubishi of New York for $127 million. BELGIUM Herpain Urbis Retained CBRE to advise on the sale of the Solaris building, one of the first “green” buildings in Brussels. Will total 150,000 SF of office space when completed in 2009. NEW YORK Solow Building Corporation CBRE leased 423,000 SF to the United Nations for 6 years. The property will house the UN while the existing UN facilities are being renovated. |
|
|
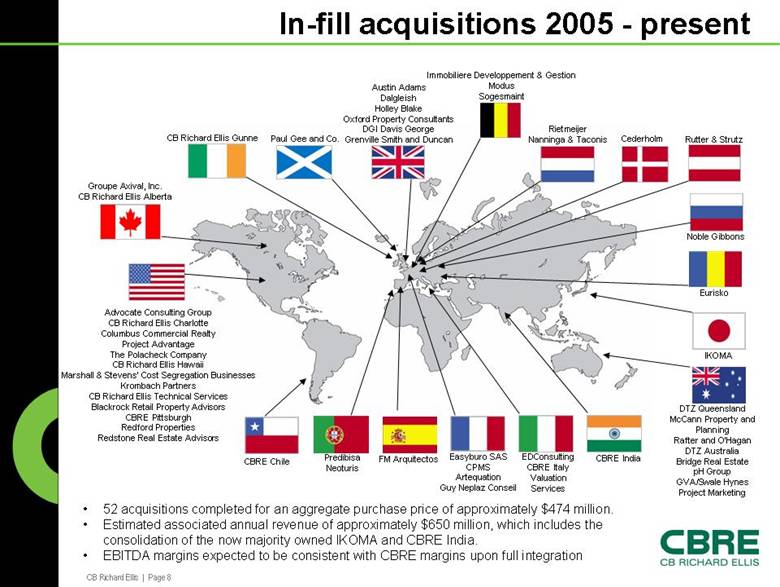
CB Richard Ellis | Page 8 In-fill acquisitions 2005 - present Groupe Axival, Inc. CB Richard Ellis Alberta Advocate Consulting Group CB Richard Ellis Charlotte Columbus Commercial Realty Project Advantage The Polacheck Company CB Richard Ellis Hawaii Marshall & Stevens’ Cost Segregation Businesses Krombach Partners CB Richard Ellis Technical Services Blackrock Retail Property Advisors CBRE Pittsburgh Redford Properties Redstone Real Estate Advisors CBRE Chile CB Richard Ellis Gunne Paul Gee and Co. Austin Adams Dalgleish Holley Blake Oxford Property Consultants DGI Davis George Grenville Smith and Duncan Immobiliere Developpement & Gestion Modus Sogesmaint Cederholm Rietmeijer Nanninga & Taconis Rutter & Strutz Eurisko Noble Gibbons IKOMA DTZ Queensland McCann Property and Planning Rafter and O’Hagan DTZ Australia Bridge Real Estate pH Group GVA/Swale Hynes Project Marketing CBRE India EDConsulting CBRE Italy Valuation Services Easyburo SAS CPMS Artequation Guy Neplaz Conseil FM Arquitectos Predibisa Neoturis • 52 acquisitions completed for an aggregate purchase price of approximately $474 million. • Estimated associated annual revenue of approximately $650 million, which includes the consolidation of the now majority owned IKOMA and CBRE India. • EBITDA margins expected to be consistent with CBRE margins upon full integration |
|
|
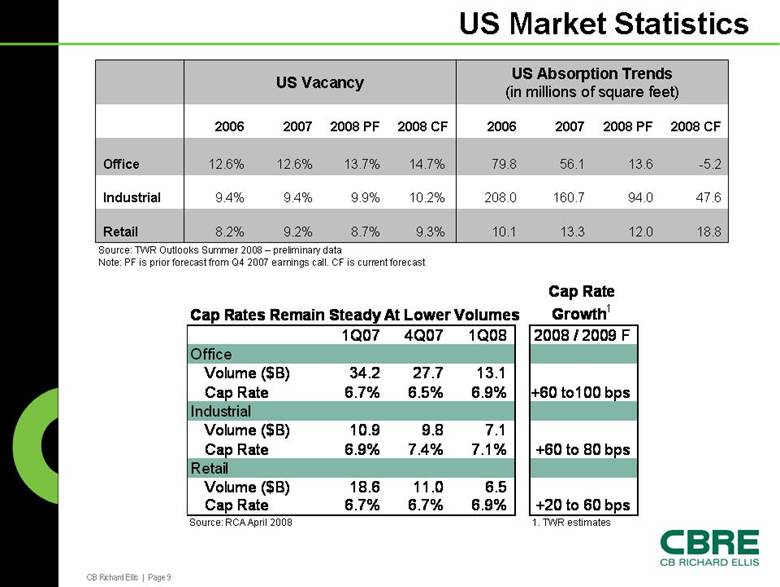
CB Richard Ellis | Page 9 US Market Statistics US Vacancy 12.0 94.0 13.6 2008 PF 8.7% 9.9% 13.7% 2008 PF 8.2% 9.4% 12.6% 2006 10.1 208.0 79.8 2006 18.8 13.3 9.3% 9.2% Retail 47.6 160.7 10.2% 9.4% Industrial -5.2 56.1 14.7% 12.6% Office 2008 CF 2007 2008 CF 2007 US Absorption Trends (in millions of square feet) Source: TWR Outlooks Summer 2008 – preliminary data Note: PF is prior forecast from Q4 2007 earnings call. CF is current forecast Cap Rates Remain Steady At Lower Volumes Cap Rate Growth1 1Q07 4Q07 1Q08 2008 / 2009 F Office Volume ($B) 34.2 27.7 13.1 Cap Rate 6.7% 6.5% 6.9% +60 to100 bps Industrial Volume ($B) 10.9 9.8 7.1 Cap Rate 6.9% 7.4% 7.1% +60 to 80 bps Retail Volume ($B) 18.6 11.0 6.5 Cap Rate 6.7% 6.7% 6.9% +20 to 60 bps Source: RCA April 2008 1. TWR estimates |
|
|
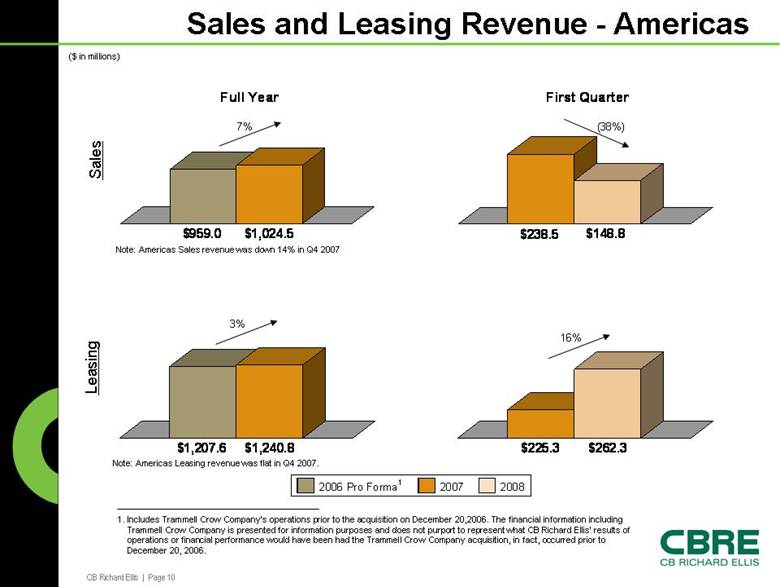
CB Richard Ellis | Page 10 Sales and Leasing Revenue - Americas $959.0 $1,024.5 Full Year $238.5 $148.8 First Quarter $1,207.6 $1,240.8 $225.3 $262.3 ($ in millions) Sales Leasing Note: Americas Sales revenue was down 14% in Q4 2007 Note: Americas Leasing revenue was flat in Q4 2007. 7% 3% (38%) 16% 2006 Pro Forma1 2007 2008 1. Includes Trammell Crow Company’s operations prior to the acquisition on December 20,2006. The financial information including Trammell Crow Company is presented for information purposes and does not purport to represent what CB Richard Ellis’ results of operations or financial performance would have been had the Trammell Crow Company acquisition, in fact, occurred prior to December 20, 2006. |
|
|
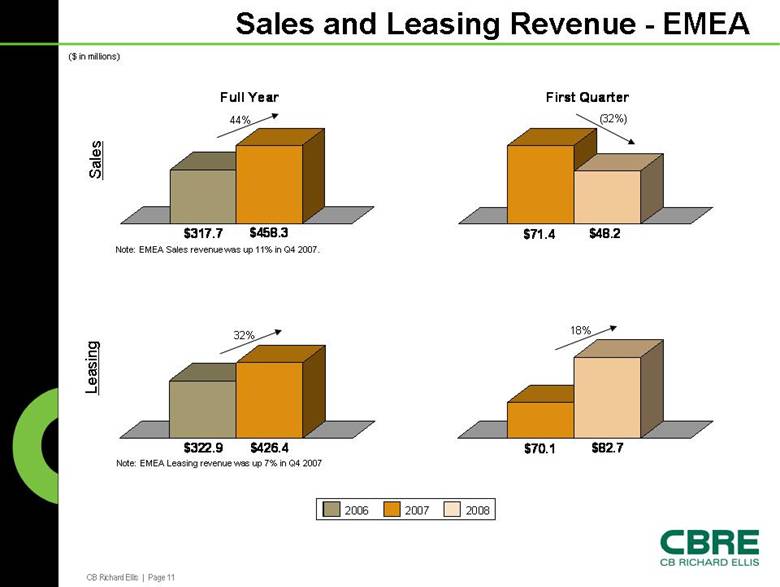
CB Richard Ellis | Page 11 Sales and Leasing Revenue - EMEA $317.7 $458.3 Full Year $71.4 $48.2 First Quarter $322.9 $426.4 $70.1 $82.7 ($ in millions) Sales Leasing Note: EMEA Sales revenue was up 11% in Q4 2007. Note: EMEA Leasing revenue was up 7% in Q4 2007 44% (32%) 32% 18% 2006 2007 2008 |
|
|
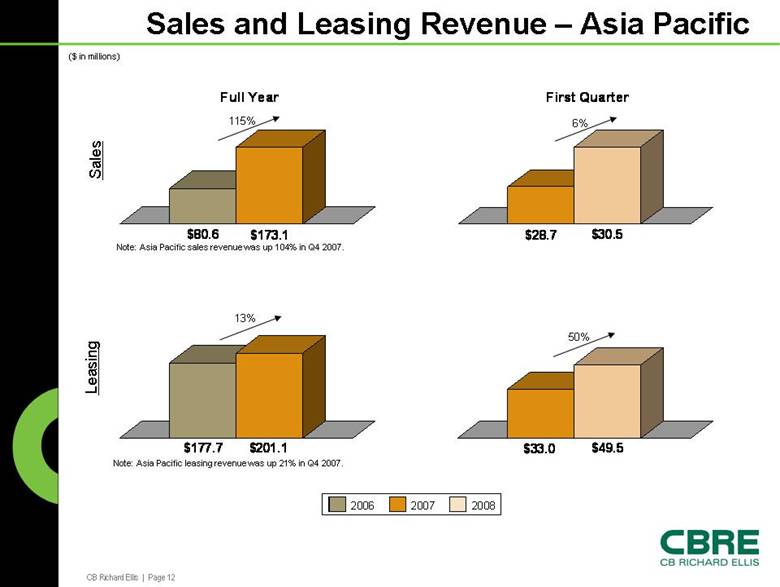
CB Richard Ellis | Page 12 Sales and Leasing Revenue – Asia Pacific $80.6 $173.1 Full Year $28.7 $30.5 First Quarter $177.7 $201.1 $33.0 $49.5 ($ in millions) Sales Leasing Note: Asia Pacific sales revenue was up 104% in Q4 2007. Note: Asia Pacific leasing revenue was up 21% in Q4 2007. 115% 13% 6% 50% 2006 2007 2008 |
|
|
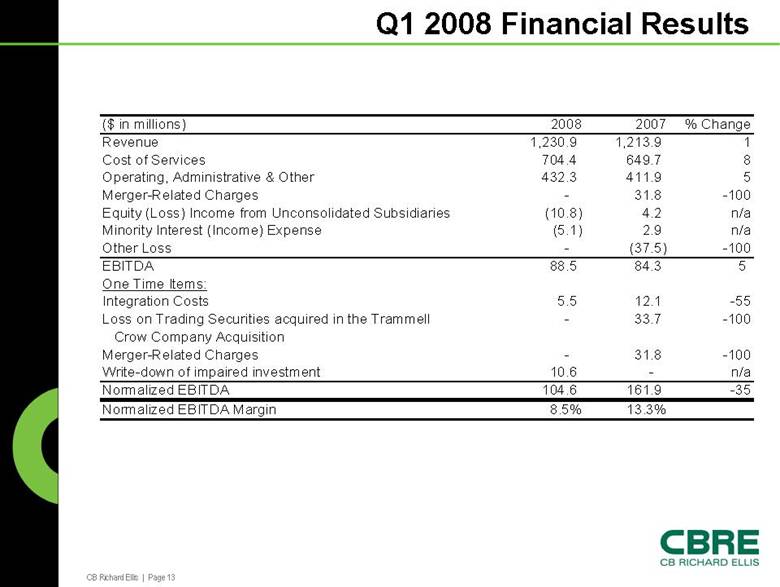
CB Richard Ellis | Page 13 Q1 2008 Financial Results ($ in millions) 2008 2007 % Change Revenue 1,230.9 1,213.9 1 Cost of Services 704.4 649.7 8 Operating, Administrative & Other 432.3 411.9 5 Merger-Related Charges - 31.8 -100 Equity (Loss) Income from Unconsolidated Subsidiaries (10.8) 4.2 n/a Minority Interest (Income) Expense (5.1) 2.9 n/a Other Loss - (37.5) -100 EBITDA 88.5 84.3 5 One Time Items: Integration Costs 5.5 12.1 -55 Loss on Trading Securities acquired in the Trammell - 33.7 -100 Crow Company Acquisition Merger-Related Charges - 31.8 -100 Write-down of impaired investment 10.6 - n/a Normalized EBITDA 104.6 161.9 -35 Normalized EBITDA Margin 8.5% 13.3% |
|
|
CB Richard Ellis | Page 14 Q1 2008 Revenue Breakdown 33% 32% 19% 7% 3% 2% 2% 2% Property & Facilities Management Leasing Sales Appraisal & Valuation Investment Management Development Services Commercial Mortgage Brokerage Other Revenue Breakdown ($ in millions) 2008 2007 % Change 413.2 307.8 34 394.5 328.5 20 227.9 339.0 -33 87.1 80.0 9 41.0 87.9 -53 26.2 14.6 79 21.9 40.5 -46 19.1 15.6 22 Total 1,230.9 1,213.9 1 Three months ended March 31, |
|
|
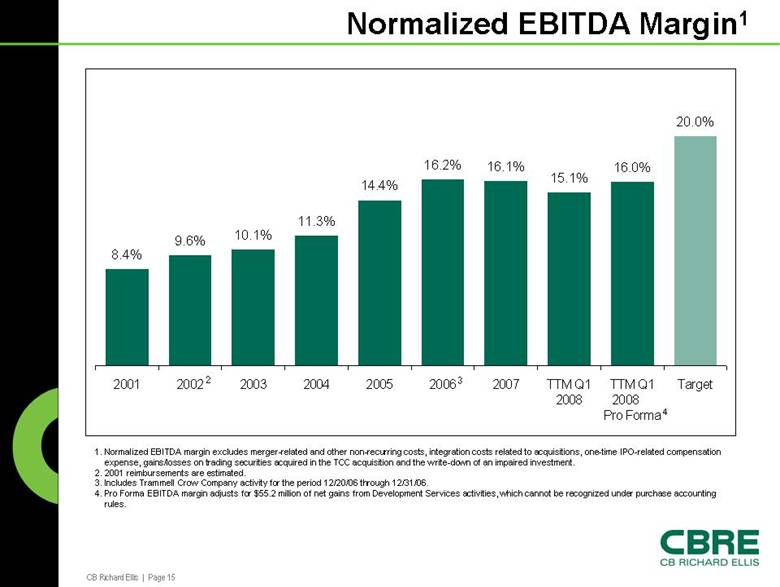
CB Richard Ellis | Page 15 8.4% 9.6% 10.1% 11.3% 14.4% 16.2% 16.1% 15.1% 16.0% 20.0% 2001 2002 2003 2004 2005 2006 2007 TTM Q1 2008 TTM Q1 2008 Pro Forma Target Normalized EBITDA Margin1 1. Normalized EBITDA margin excludes merger-related and other non-recurring costs, integration costs related to acquisitions, one-time IPO-related compensation expense, gains/losses on trading securities acquired in the TCC acquisition and the write-down of an impaired investment. 2. 2001 reimbursements are estimated. 3. Includes Trammell Crow Company activity for the period 12/20/06 through 12/31/06. 4. Pro Forma EBITDA margin adjusts for $55.2 million of net gains from Development Services activities, which cannot be recognized under purchase accounting rules. 2 3 4 |
|
|
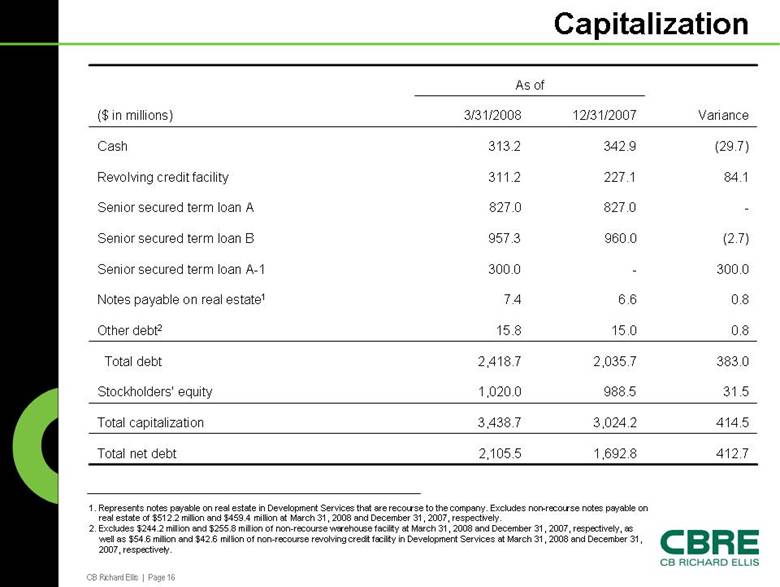
CB Richard Ellis | Page 16 Capitalization 1. Represents notes payable on real estate in Development Services that are recourse to the company. Excludes non-recourse notes payable on real estate of $512.2 million and $459.4 million at March 31, 2008 and December 31, 2007, respectively. 2. Excludes $244.2 million and $255.8 million of non-recourse warehouse facility at March 31, 2008 and December 31, 2007, respectively, as well as $54.6 million and $42.6 million of non-recourse revolving credit facility in Development Services at March 31, 2008 and December 31, 2007, respectively. 412.7 1,692.8 2,105.5 Total net debt 414.5 3,024.2 3,438.7 Total capitalization 31.5 988.5 1,020.0 Stockholders' equity 383.0 2,035.7 2,418.7 Total debt 0.8 15.0 15.8 Other debt2 0.8 6.6 7.4 Notes payable on real estate1 300.0 - 300.0 Senior secured term loan A-1 (2.7) 960.0 957.3 Senior secured term loan B - 827.0 827.0 Senior secured term loan A 84.1 227.1 311.2 Revolving credit facility (29.7) 342.9 313.2 Cash Variance 12/31/2007 3/31/2008 ($ in millions) As of |
|
|
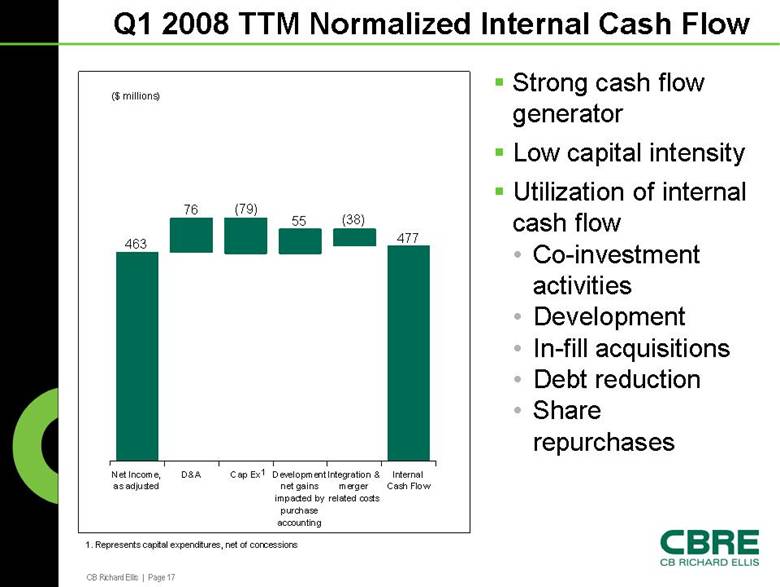
CB Richard Ellis | Page 17 Q1 2008 TTM Normalized Internal Cash Flow Strong cash flow generator Low capital intensity Utilization of internal cash flow • Co-investment activities • Development • In-fill acquisitions • Debt reduction • Share repurchases Internal Cash Flow Integration & merger related costs Development net gains impacted by purchase accounting Cap Ex D&A Net Income, as adjusted ($ millions) 463 76 (79) 55 (38) 477 1 1. Represents capital expenditures, net of concessions |
|
|
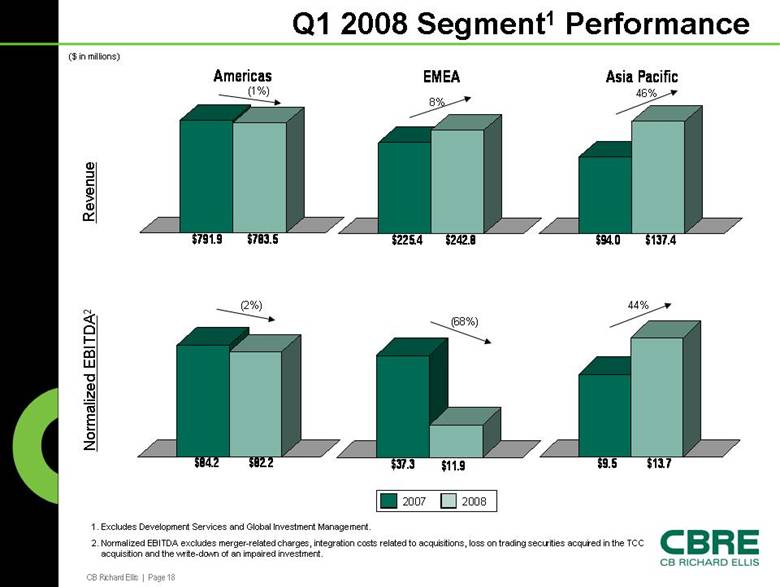
CB Richard Ellis | Page 18 Q1 2008 Segment1 Performance $791.9 $783.5 Americas $84.2 $82.2 $225.4 $242.8 EMEA $37.3 $11.9 $94.0 $137.4 Asia Pacific $9.5 $13.7 ($ in millions) Revenue Normalized EBITDA2 1. Excludes Development Services and Global Investment Management. 2. Normalized EBITDA excludes merger-related charges, integration costs related to acquisitions, loss on trading securities acquired in the TCC acquisition and the write-down of an impaired investment. 2007 2008 (1%) 8% 46% (2%) (68%) 44% |
|
|
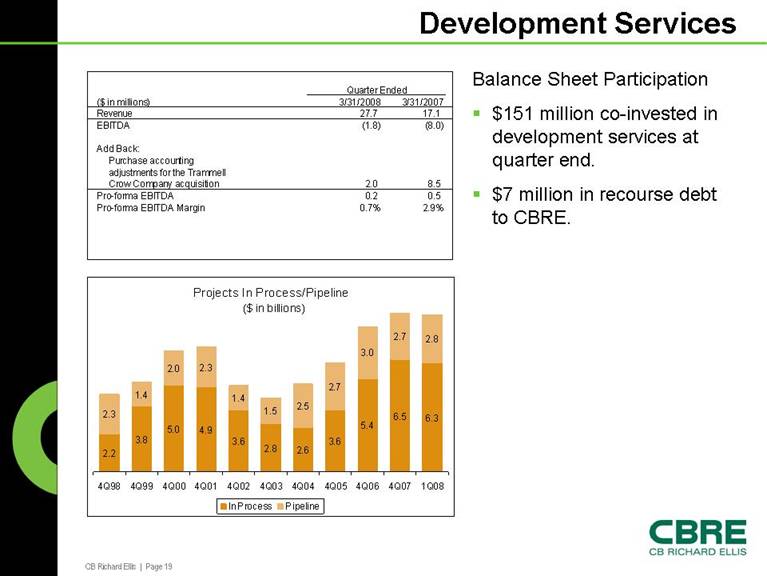
CB Richard Ellis | Page 19 Development Services Balance Sheet Participation $151 million co-invested in development services at quarter end. $7 million in recourse debt to CBRE. ($ in millions) 3/31/2008 3/31/2007 Revenue 27.7 17.1 EBITDA (1.8) (8.0) Add Back: Purchase accounting adjustments for the Trammell Crow Company acquisition 2.0 8.5 Pro-forma EBITDA 0.2 0.5 Pro-forma EBITDA Margin 0.7% 2.9% Quarter Ended Projects In Process/Pipeline ($ in billions) 2.2 3.8 5.0 4.9 3.6 2.8 2.6 3.6 5.4 6.5 6.3 2.3 1.4 2.0 2.3 1.4 1.5 2.5 2.7 3.0 2.7 2.8 4Q98 4Q99 4Q00 4Q01 4Q02 4Q03 4Q04 4Q05 4Q06 4Q07 1Q08 In Process Pipeline |
|
|
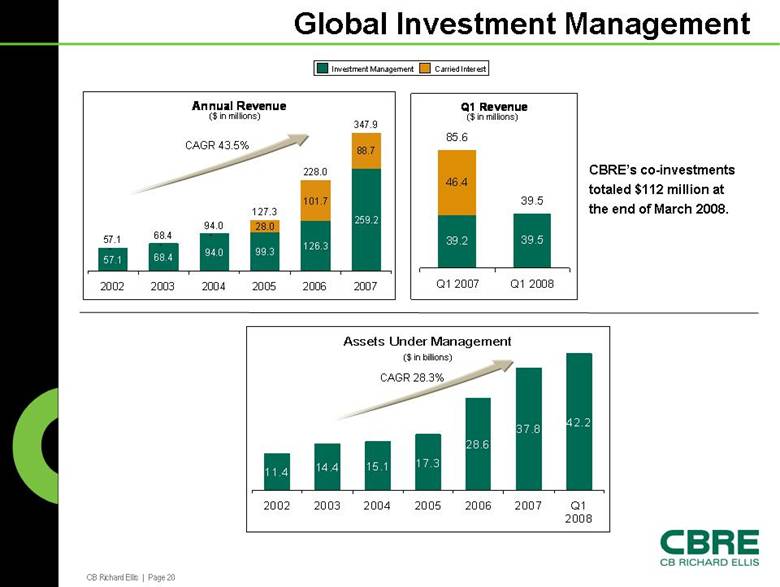
CB Richard Ellis | Page 20 Global Investment Management Annual Revenue 57.1 68.4 94.0 99.3 126.3 259.2 - - - 28.0 101.7 88.7 57.1 68.4 94.0 127.3 228.0 347.9 2002 2003 2004 2005 2006 2007 Assets Under Management 11.4 14.4 15.1 17.3 28.6 37.8 42.2 2002 2003 2004 2005 2006 2007 Q1 2008 Q1 Revenue 39.2 39.5 46.4 85.6 39.5 Q1 2007 Q1 2008 ($ in billions) Investment Management Carried Interest ($ in millions) CBRE’s co-investments totaled $112 million at the end of March 2008. CAGR 43.5% CAGR 28.3% ($ in millions) |
|
|
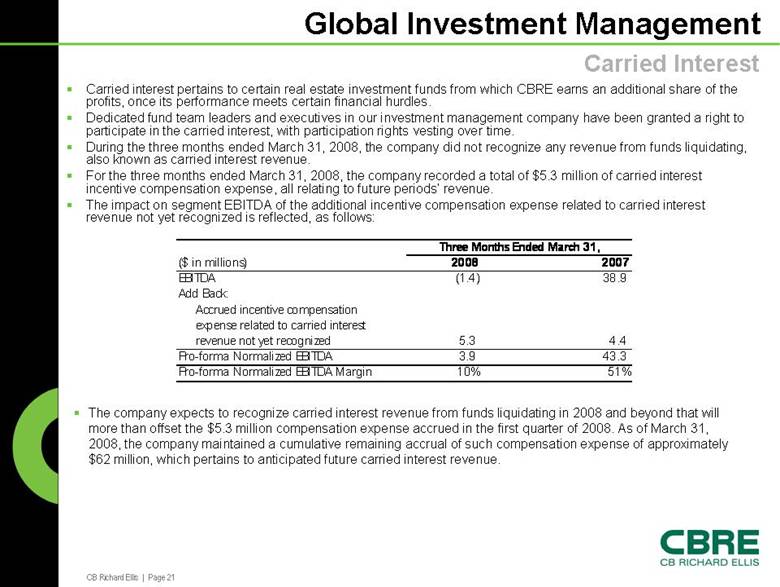
CB Richard Ellis | Page 21 Global Investment Management Carried interest pertains to certain real estate investment funds from which CBRE earns an additional share of the profits, once its performance meets certain financial hurdles. Dedicated fund team leaders and executives in our investment management company have been granted a right to participate in the carried interest, with participation rights vesting over time. During the three months ended March 31, 2008, the company did not recognize any revenue from funds liquidating, also known as carried interest revenue. For the three months ended March 31, 2008, the company recorded a total of $5.3 million of carried interest incentive compensation expense, all relating to future periods’ revenue. The impact on segment EBITDA of the additional incentive compensation expense related to carried interest revenue not yet recognized is reflected, as follows: Carried Interest The company expects to recognize carried interest revenue from funds liquidating in 2008 and beyond that will more than offset the $5.3 million compensation expense accrued in the first quarter of 2008. As of March 31, 2008, the company maintained a cumulative remaining accrual of such compensation expense of approximately $62 million, which pertains to anticipated future carried interest revenue. ($ in millions) 2008 2007 EBITDA (1.4) 38.9 Add Back: Accrued incentive compensation expense related to carried interest revenue not yet recognized 5.3 4.4 Pro-forma Normalized EBITDA 3.9 43.3 Pro-forma Normalized EBITDA Margin 10% 51% Three Months Ended March 31, |
|
|
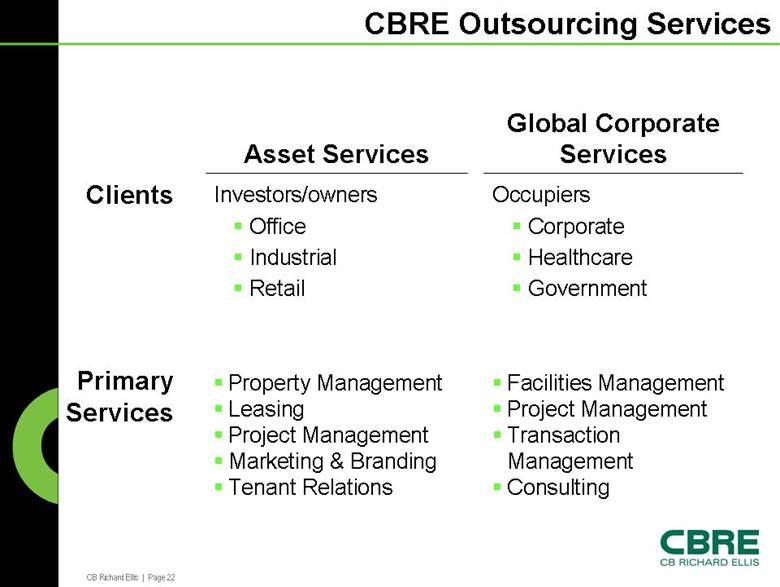
CB Richard Ellis | Page 22 Facilities Management Project Management Transaction Management Consulting Property Management Leasing Project Management Marketing & Branding Tenant Relations Occupiers Corporate Healthcare Government Investors/owners Office Industrial Retail Global Corporate Services Asset Services Clients Primary Services CBRE Outsourcing Services |
|
|
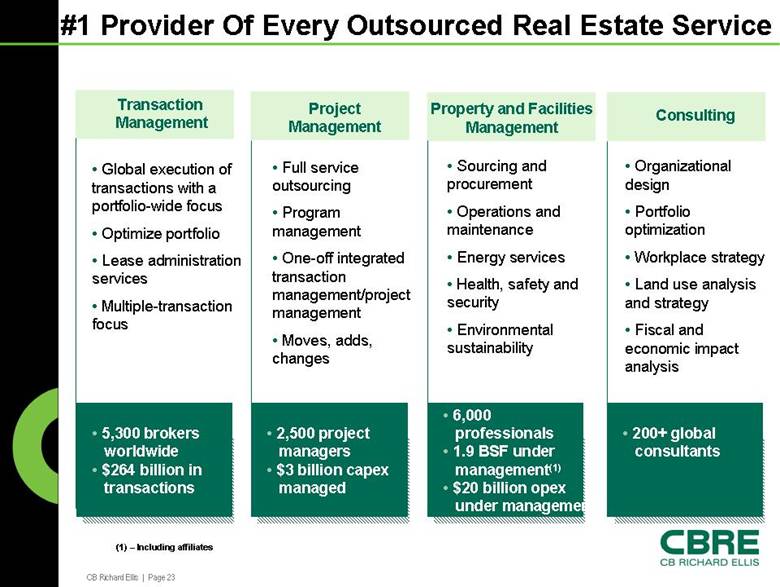
CB Richard Ellis | Page 23 #1 Provider Of Every Outsourced Real Estate Service • 5,300 brokers worldwide • $264 billion in transactions • Global execution of transactions with a portfolio-wide focus • Optimize portfolio • Lease administration services • Multiple-transaction focus • Full service outsourcing • Program management • One-off integrated transaction management/project management • Moves, adds, changes • Sourcing and procurement • Operations and maintenance • Energy services • Health, safety and security • Environmental sustainability • Organizational design • Portfolio optimization • Workplace strategy • Land use analysis and strategy • Fiscal and economic impact analysis Transaction Management • 2,500 project managers • $3 billion capex managed Project Management • 6,000 professionals • 1.9 BSF under management(1) • $20 billion opex under management Property and Facilities Management • 200+ global consultants Consulting (1) – Including affiliates |
|
|
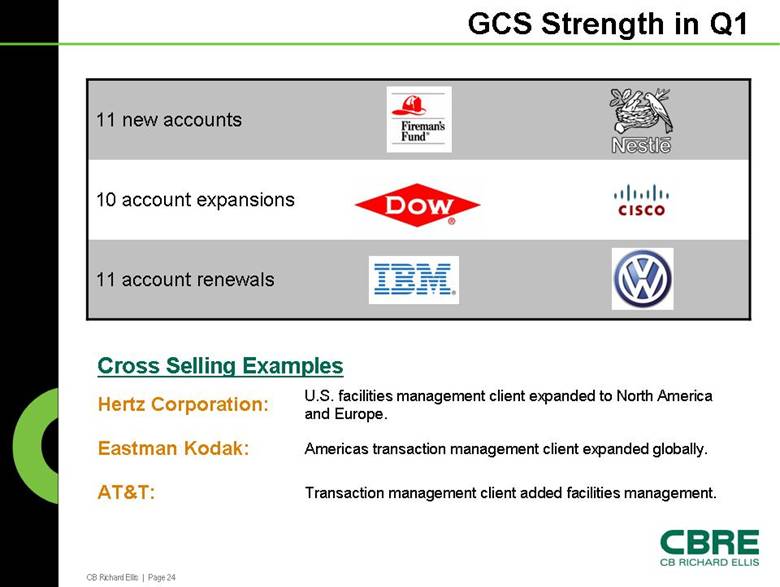
CB Richard Ellis | Page 24 GCS Strength in Q1 11 account renewals 10 account expansions 11 new accounts Transaction management client added facilities management. AT&T: Americas transaction management client expanded globally. Eastman Kodak: U.S. facilities management client expanded to North America and Europe. Hertz Corporation: Cross Selling Examples |
|
|
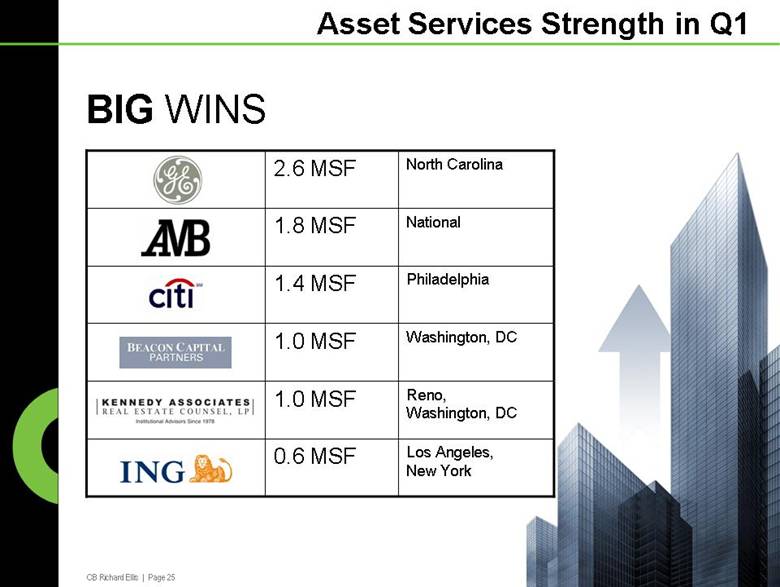
CB Richard Ellis | Page 25 Asset Services Strength in Q1 BIG WINS Los Angeles, New York 0.6 MSF Reno, Washington, DC 1.0 MSF Washington, DC 1.0 MSF Philadelphia 1.4 MSF National 1.8 MSF North Carolina 2.6 MSF |
|
|
CB Richard Ellis | Page 26 Outsourcing Services: CBRE Differentiators Global coverage and local market intelligence Industry’s largest base of global consultants and subject matter experts in each service line Account management approach – integration of services Leading platform infrastructure: accounting, HR, IT, procurement Sophisticated performance management and customer satisfaction |
|
|
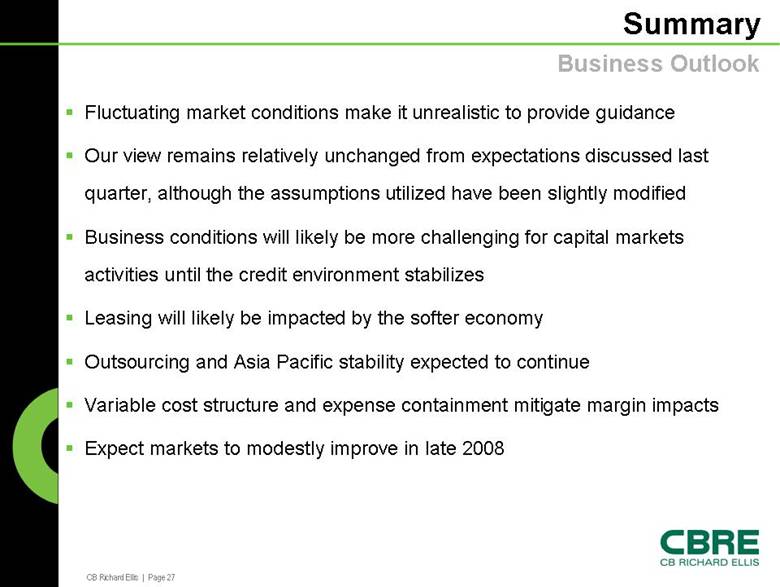
CB Richard Ellis | Page 27 Summary Fluctuating market conditions make it unrealistic to provide guidance Our view remains relatively unchanged from expectations discussed last quarter, although the assumptions utilized have been slightly modified Business conditions will likely be more challenging for capital markets activities until the credit environment stabilizes Leasing will likely be impacted by the softer economy Outsourcing and Asia Pacific stability expected to continue Variable cost structure and expense containment mitigate margin impacts Expect markets to modestly improve in late 2008 Business Outlook |
|
|
CB Richard Ellis | Page 28 GAAP Reconciliation Tables |
|
|
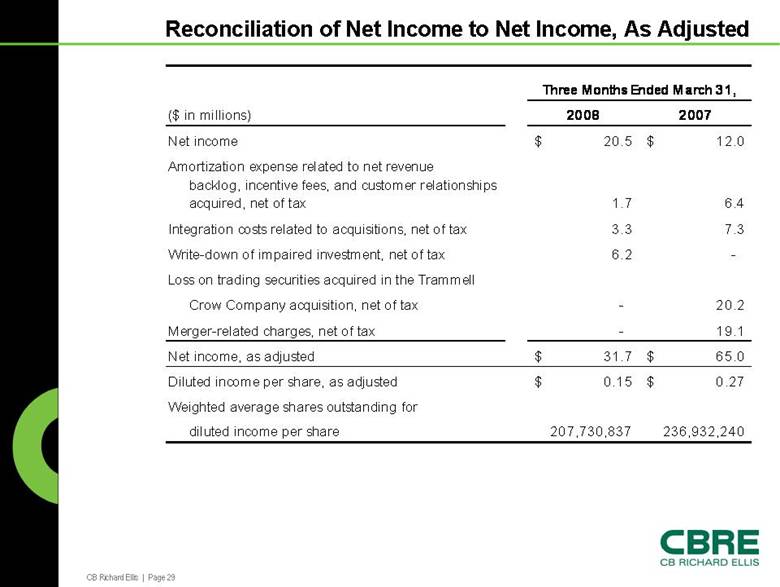
CB Richard Ellis | Page 29 Reconciliation of Net Income to Net Income, As Adjusted ($ in millions) 2008 2007 Net income 20.5 $ 12.0 $ Amortization expense related to net revenue backlog, incentive fees, and customer relationships acquired, net of tax 1.7 6.4 Integration costs related to acquisitions, net of tax 3.3 7.3 Write-down of impaired investment, net of tax 6.2 - Loss on trading securities acquired in the Trammell Crow Company acquisition, net of tax - 20.2 Merger-related charges, net of tax - 19.1 Net income, as adjusted 31.7 $ 65.0 $ Diluted income per share, as adjusted 0.15 $ 0.27 $ Weighted average shares outstanding for diluted income per share 207,730,837 236,932,240 Three Months Ended March 31, |
|
|
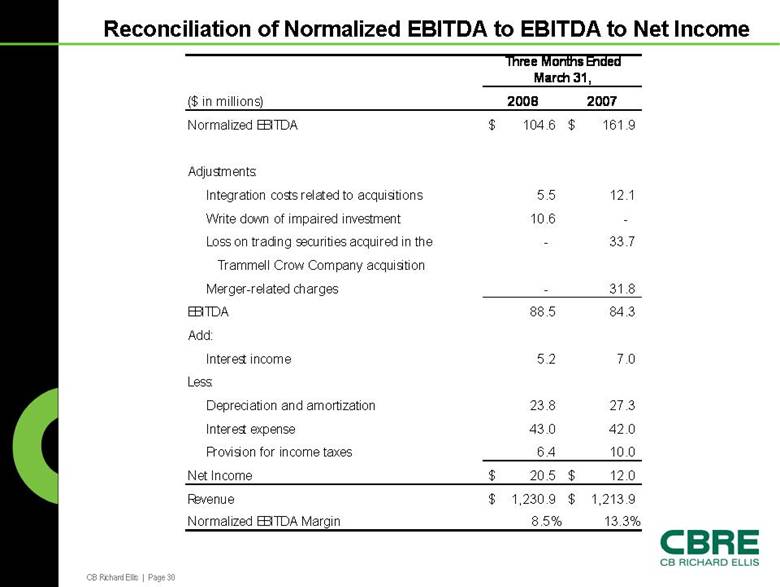
CB Richard Ellis | Page 30 Reconciliation of Normalized EBITDA to EBITDA to Net Income ($ in millions) 2008 2007 Normalized EBITDA 104.6 $ 161.9 $ Adjustments: Integration costs related to acquisitions 5.5 12.1 Write down of impaired investment 10.6 - Loss on trading securities acquired in the - 33.7 Trammell Crow Company acquisition Merger-related charges - 31.8 EBITDA 88.5 84.3 Add: Interest income 5.2 7.0 Less: Depreciation and amortization 23.8 27.3 Interest expense 43.0 42.0 Provision for income taxes 6.4 10.0 Net Income 20.5 $ 12.0 $ Revenue 1,230.9 $ 1,213.9 $ Normalized EBITDA Margin 8.5% 13.3% Three Months Ended March 31, |
|
|
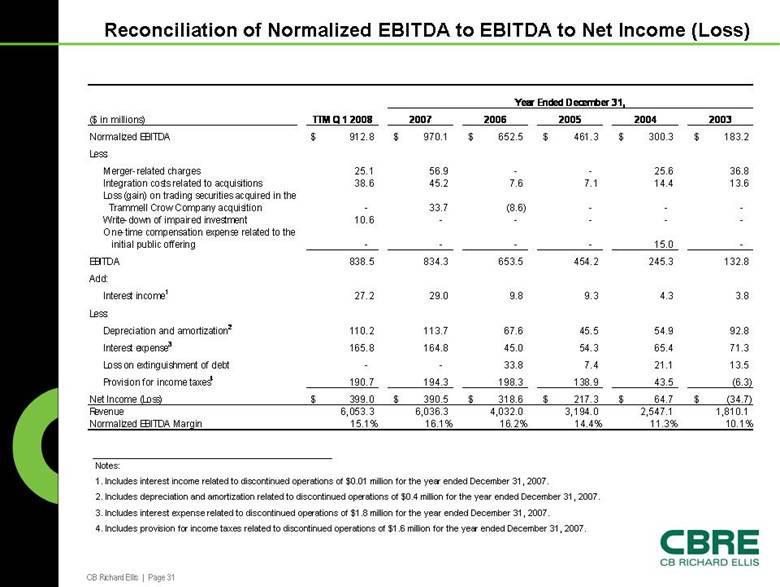
CB Richard Ellis | Page 31 Reconciliation of Normalized EBITDA to EBITDA to Net Income (Loss) ($ in millions) TTM Q1 2008 2007 2006 2005 2004 2003 Normalized EBITDA 912.8 $ 970.1 $ 652.5 $ 461.3 $ 300.3 $ 183.2 $ Less: Merger-related charges 25.1 56.9 - - 25.6 36.8 Integration costs related to acquisitions 38.6 45.2 7.6 7.1 14.4 13.6 Loss (gain) on trading securities acquired in the Trammell Crow Company acquisition - 33.7 (8.6) - - - Write-down of impaired investment 10.6 - - - - - One-time compensation expense related to the initial public offering - - - - 15.0 - EBITDA 838.5 834.3 653.5 454.2 245.3 132.8 Add: Interest income1 27.2 29.0 9.8 9.3 4.3 3.8 Less: Depreciation and amortization2 110.2 113.7 67.6 45.5 54.9 92.8 Interest expense3 165.8 164.8 45.0 54.3 65.4 71.3 Loss on extinguishment of debt - - 33.8 7.4 21.1 13.5 Provision for income taxes4 190.7 194.3 198.3 138.9 43.5 (6.3) Net Income (Loss) 399.0 $ 390.5 $ 318.6 $ 217.3 $ 64.7 $ (34.7) $ Revenue 6,053.3 6,036.3 4,032.0 3,194.0 2,547.1 1,810.1 Normalized EBITDA Margin 15.1% 16.1% 16.2% 14.4% 11.3% 10.1% Year Ended December 31, Notes: 1. Includes interest income related to discontinued operations of $0.01 million for the year ended December 31, 2007. 2. Includes depreciation and amortization related to discontinued operations of $0.4 million for the year ended December 31, 2007. 3. Includes interest expense related to discontinued operations of $1.8 million for the year ended December 31, 2007. 4. Includes provision for income taxes related to discontinued operations of $1.6 million for the year ended December 31, 2007. |
|
|
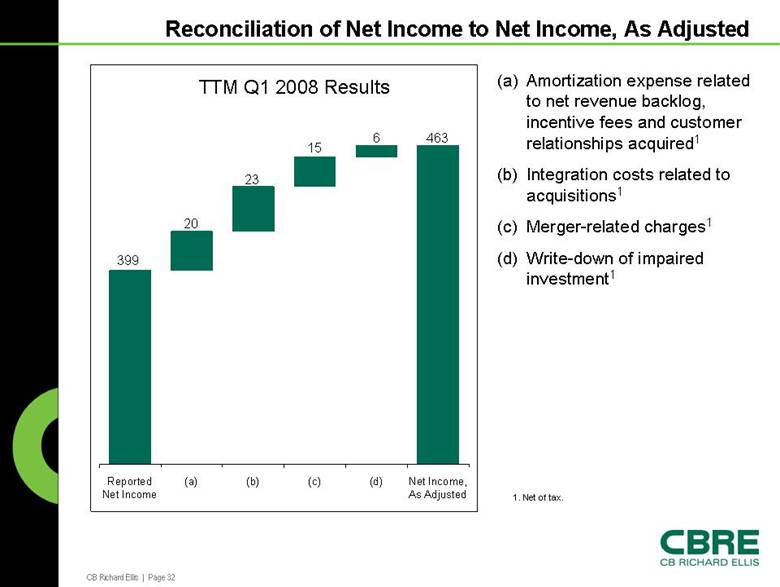
CB Richard Ellis | Page 32 Reconciliation of Net Income to Net Income, As Adjusted Net Income, As Adjusted (d) (c) (b) (a) Reported Net Income TTM Q1 2008 Results 399 20 23 15 6 463 (a) Amortization expense related to net revenue backlog, incentive fees and customer relationships acquired1 (b) Integration costs related to acquisitions1 (c) Merger-related charges1 (d) Write-down of impaired investment1 1. Net of tax. |
|
|
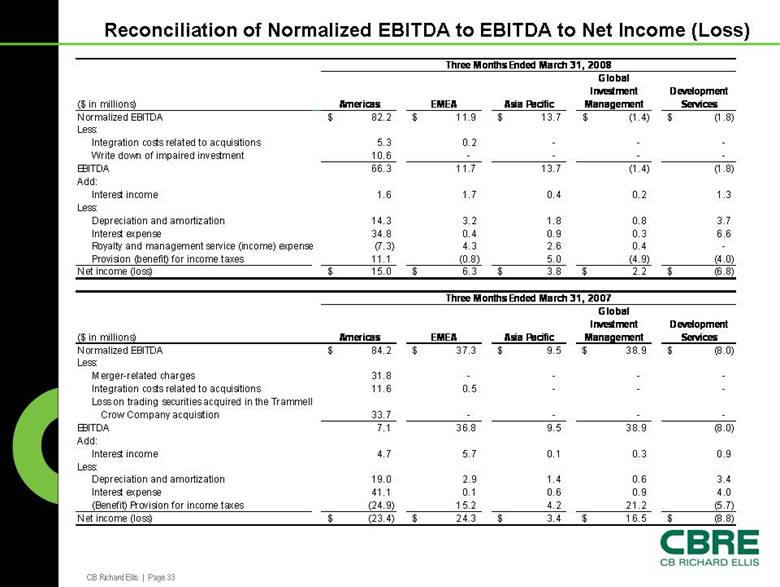
CB Richard Ellis | Page 33 Reconciliation of Normalized EBITDA to EBITDA to Net Income (Loss) ($ in millions) Americas EMEA Asia Pacific Global Investment Management Development Services Normalized EBITDA 82.2 $ 11.9 $ 13.7 $ (1.4) $ (1.8) $ Less: Integration costs related to acquisitions 5.3 0.2 - - - Write down of impaired investment 10.6 - - - - EBITDA 66.3 11.7 13.7 (1.4) (1.8) Add: Interest income 1.6 1.7 0.4 0.2 1.3 Less: Depreciation and amortization 14.3 3.2 1.8 0.8 3.7 Interest expense 34.8 0.4 0.9 0.3 6.6 Royalty and management service (income) expense (7.3) 4.3 2.6 0.4 - Provision (benefit) for income taxes 11.1 (0.8) 5.0 (4.9) (4.0) Net income (loss) 15.0 $ 6.3 $ 3.8 $ 2.2 $ (6.8) $ ($ in millions) Americas EMEA Asia Pacific Global Investment Management Development Services Normalized EBITDA 84.2 $ 37.3 $ 9.5 $ 38.9 $ (8.0) $ Less: Merger-related charges 31.8 - - - - Integration costs related to acquisitions 11.6 0.5 - - - Loss on trading securities acquired in the Trammell Crow Company acquisition 33.7 - - - - EBITDA 7.1 36.8 9.5 38.9 (8.0) Add: Interest income 4.7 5.7 0.1 0.3 0.9 Less: Depreciation and amortization 19.0 2.9 1.4 0.6 3.4 Interest expense 41.1 0.1 0.6 0.9 4.0 (Benefit) Provision for income taxes (24.9) 15.2 4.2 21.2 (5.7) Net income (loss) (23.4) $ 24.3 $ 3.4 $ 16.5 $ (8.8) $ Three Months Ended March 31, 2008 Three Months Ended March 31, 2007 |