Exhibit 99.2
|
|
CB Richard Ellis Group, Inc. February 6, 2008 Fourth Quarter and Full Year 2007 Earnings Conference Call |
Exhibit 99.2
|
|
CB Richard Ellis Group, Inc. February 6, 2008 Fourth Quarter and Full Year 2007 Earnings Conference Call |
|
|
Forward Looking Statements This presentation contains statements that are forward looking within the meaning of the Private Securities Litigation Reform Act of 1995, including statements regarding our growth momentum in 2008, future operations, future expenses, and future financial performance. These statements should be considered as estimates only and actual results may ultimately differ from these estimates. Except to the extent required by applicable securities laws, we undertake no obligation to update or publicly revise any of the forward-looking statements that you may hear today. Please refer to our current annual report on Form 10-K (in particular, Risk Factors) and our current quarterly report on Form 10-Q, which are filed with the SEC and available at the SEC’s website (http://www.sec.gov), for a full discussion of the risks and other factors that may impact any estimates that you may hear today. We may make certain statements during the course of this presentation which include references to “non-GAAP financial measures,” as defined by SEC regulations. As required by these regulations, we have provided reconciliations of these measures to what we believe are the most directly comparable GAAP measures, which are attached hereto within the appendix. |
|
|
CB Richard Ellis | Page 3 Conference Call Participants Brett White Chief Executive Officer Kenneth J. Kay Senior Executive Vice President & Chief Financial Officer Vance G. Maddocks President, CB Richard Ellis Investors Nick Kormeluk Senior Vice President, Investor Relations |
|
|
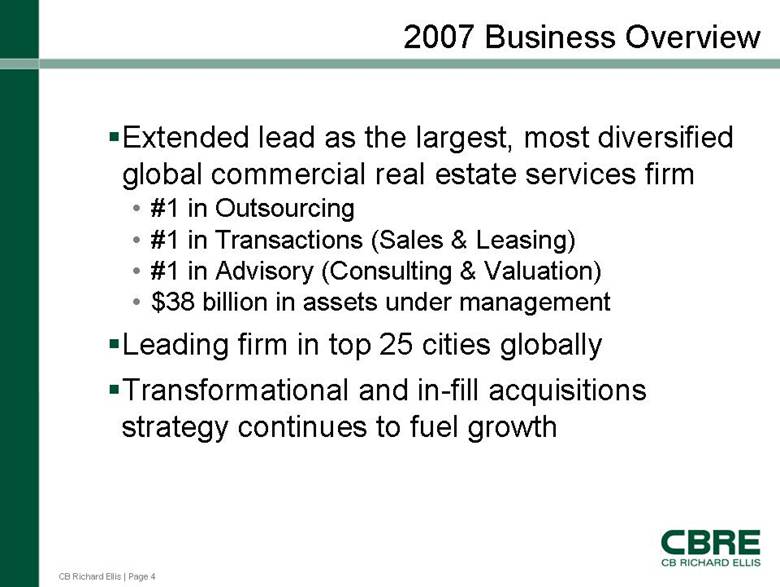
CB Richard Ellis | Page 4 2007 Business Overview Extended lead as the largest, most diversified global commercial real estate services firm • #1 in Outsourcing • #1 in Transactions (Sales & Leasing) • #1 in Advisory (Consulting & Valuation) • $38 billion in assets under management Leading firm in top 25 cities globally Transformational and in-fill acquisitions strategy continues to fuel growth |
|
|
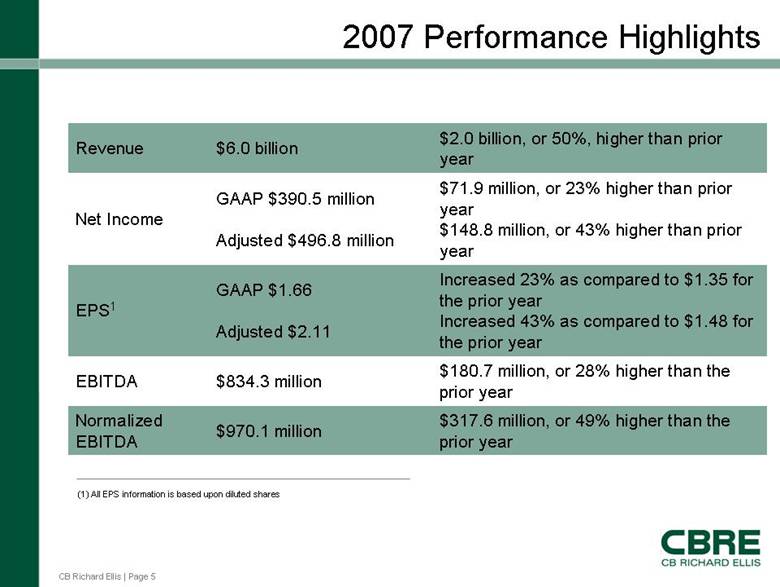
CB Richard Ellis | Page 5 2007 Performance Highlights $317.6 million, or 49% higher than the prior year $970.1 million Normalized EBITDA $180.7 million, or 28% higher than the prior year $834.3 million EBITDA Increased 23% as compared to $1.35 for the prior year Increased 43% as compared to $1.48 for the prior year GAAP $1.66 Adjusted $2.11 EPS1 $71.9 million, or 23% higher than prior year $148.8 million, or 43% higher than prior year GAAP $390.5 million Adjusted $496.8 million Net Income $2.0 billion, or 50%, higher than prior year $6.0 billion Revenue (1) All EPS information is based upon diluted shares |
|
|
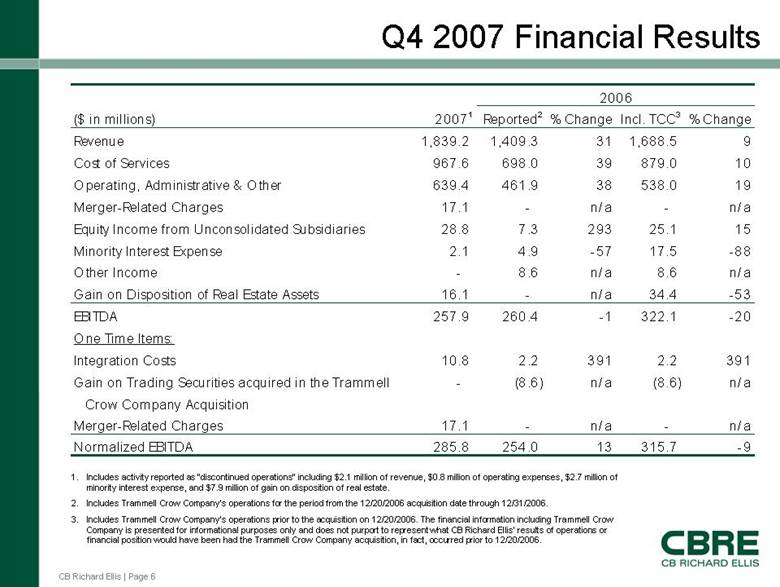
CB Richard Ellis | Page 6 Q4 2007 Financial Results 1. Includes activity reported as “discontinued operations” including $2.1 million of revenue, $0.8 million of operating expenses, $2.7 million of minority interest expense, and $7.9 million of gain on disposition of real estate. 2. Includes Trammell Crow Company’s operations for the period from the 12/20/2006 acquisition date through 12/31/2006. 3. Includes Trammell Crow Company’s operations prior to the acquisition on 12/20/2006. The financial information including Trammell Crow Company is presented for informational purposes only and does not purport to represent what CB Richard Ellis’ results of operations or financial position would have been had the Trammell Crow Company acquisition, in fact, occurred prior to 12/20/2006. ($ in millions) 20071 Reported2 % Change Incl. TCC3 % Change Revenue 1,839.2 1,409.3 31 1,688.5 9 Cost of Services 967.6 698.0 39 879.0 10 Operating, Administrative & Other 639.4 461.9 38 538.0 19 Merger-Related Charges 17.1 - n/ a - n/a Equity Income from Unconsolidated Subsidiaries 28.8 7.3 293 25.1 15 Minority Interest Expense 2.1 4.9 -57 17.5 -88 Other Income - 8.6 n/ a 8.6 n/a Gain on Disposition of Real Estate Assets 16.1 - n/ a 34.4 -53 EBITDA 257.9 260.4 -1 322.1 -20 One Time Items: Integration Costs 10.8 2.2 391 2.2 391 Gain on Trading Securities acquired in the Trammell - (8.6) n/ a (8.6) n/a Crow Company Acquisition Merger-Related Charges 17.1 - n/ a - n/a Normalized EBITDA 285.8 254.0 13 315.7 -9 2006 |
|
|
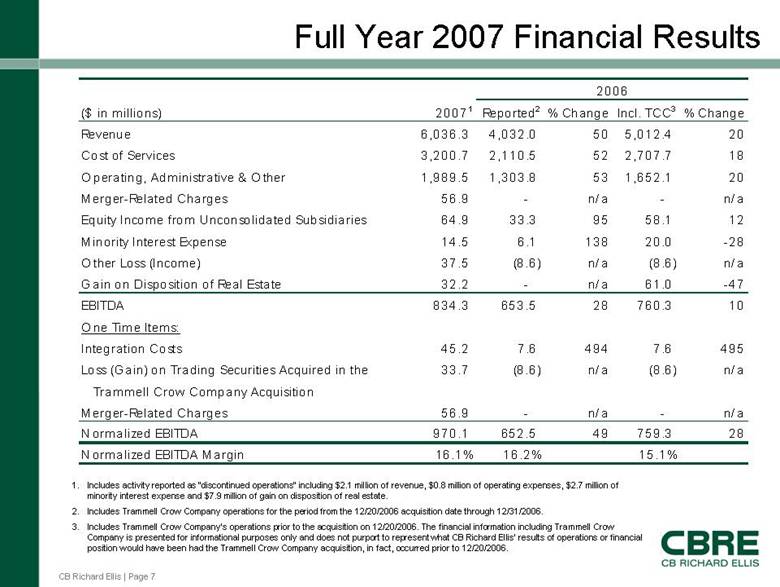
CB Richard Ellis | Page 7 Full Year 2007 Financial Results 1. Includes activity reported as “discontinued operations” including $2.1 million of revenue, $0.8 million of operating expenses, $2.7 million of minority interest expense and $7.9 million of gain on disposition of real estate. 2. Includes Trammell Crow Company operations for the period from the 12/20/2006 acquisition date through 12/31/2006. 3. Includes Trammell Crow Company’s operations prior to the acquisition on 12/20/2006. The financial information including Trammell Crow Company is presented for informational purposes only and does not purport to represent what CB Richard Ellis’ results of operations or financial position would have been had the Trammell Crow Company acquisition, in fact, occurred prior to 12/20/2006. ($ in millions) 20071 Reported2 % Change Incl. TCC3 % Change Revenue 6,036.3 4,032.0 50 5,012.4 20 Cost of Services 3,200.7 2,110.5 52 2,707.7 18 Operating, Administrative & Other 1,989.5 1,303.8 53 1,652.1 20 Merger-Related Charges 56.9 - n/ a - n/ a Equity Income from Unconsolidated Subsidiaries 64.9 33.3 95 58.1 12 Minority Interest Expense 14.5 6.1 138 20.0 -28 Other Loss (Income) 37.5 (8.6) n/ a (8.6) n/ a Gain on Disposition of Real Estate 32.2 - n/ a 61.0 -47 EBITDA 834.3 653.5 28 760.3 10 One Time Items: Integration Costs 45.2 7.6 494 7.6 495 Loss (Gain) on Trading Securities Acquired in the 33.7 (8.6) n/ a (8.6) n/ a Trammell Crow Company Acquisition Merger-Related Charges 56.9 - n/ a - n/ a Normalized EBITDA 970.1 652.5 49 759.3 28 Normalized EBITDA Margin 16.1% 16.2% 15.1% 2006 |
|
|
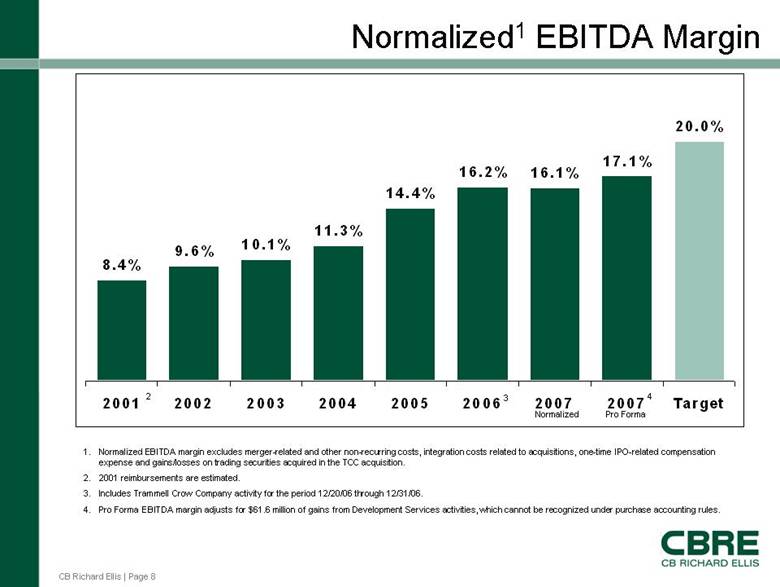
CB Richard Ellis | Page 8 8.4% 9.6% 10.1% 11.3% 14.4% 16.2% 16.1% 17.1% 20.0% 2001 2002 2003 2004 2005 2006 2007 2007 Target Normalized1 EBITDA Margin 1. Normalized EBITDA margin excludes merger-related and other non-recurring costs, integration costs related to acquisitions, one-time IPO-related c ompensation expense and gains/losses on trading securities acquired in the TCC acquisition. 2. 2001 reimbursements are estimated. 3. Includes Trammell Crow Company activity for the period 12/20/06 through 12/31/06. 4. Pro Forma EBITDA margin adjusts for $61.6 million of gains from Development Ser vices activities, which cannot be recognized under purchase accounting rules. 2 3 4 Normalized Pro Forma |
|
|
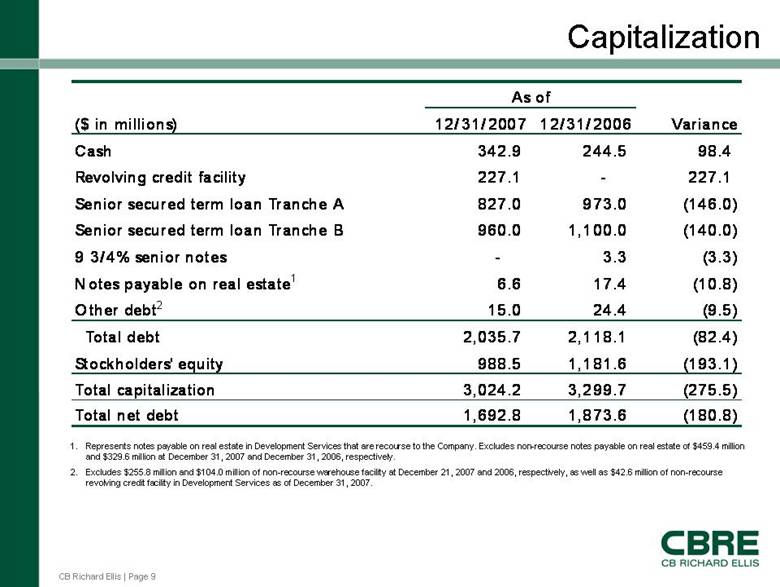
CB Richard Ellis | Page 9 Capitalization 1. Represents notes payable on real estate in Development Ser vices that are recourse to the Company. Excludes non-recourse notes payable on real estate of $459.4 million and $329.6 million at December 31, 2007 and December 31, 2006, respectively. 2. Excludes $255.8 million and $104.0 million of non-recourse warehouse facility at December 21, 2007 and 2006, respectively, as well as $42.6 million of non-recourse revolving credit facility in Development Services as of December 31, 2007. ($ in millions) 12/ 31/2007 12/ 31/2006 Variance Cash 342.9 244.5 98.4 Revolving credit facility 227.1 - 227.1 Senior secured term loan Tranche A 827.0 973.0 (146.0) Senior secured term loan Tranche B 960.0 1,100.0 (140.0) 9 3/4% senior notes - 3.3 (3.3) Notes payable on real estate1 6.6 17.4 (10.8) Other debt2 15.0 24.4 (9.5) Total debt 2,035.7 2,118.1 (82.4) Stockholders' equity 988.5 1,181.6 (193.1) Total capitalization 3,024.2 3,299.7 (275.5) Total net debt 1,692.8 1,873.6 (180.8) As of |
|
|
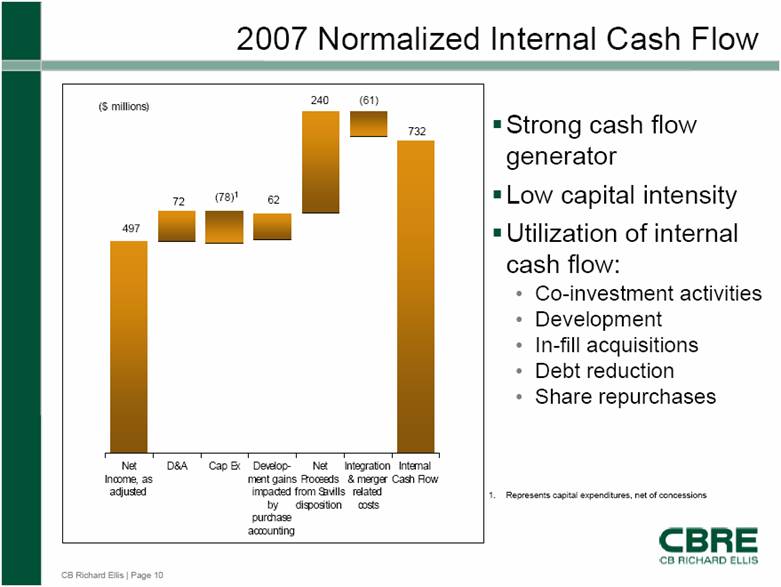
CB Richard Ellis | Page 10 Internal Cash Flow Integration & merger related costs Net Proceeds from Savills disposition Development gains impacted by purchase accounting Cap Ex D&A Net Income, as adjusted ($ millions) 2007 Normalized Internal Cash Flow Strong cash flow generator Low capital intensity Utilization of internal cash flow: • Co-investment activities • Development • In-fill acquisitions • Debt reduction • Share repurchases 497 72 (78)1 1. Represents capital expenditures, net of concessions 62 240 (61) 732 |
|
|
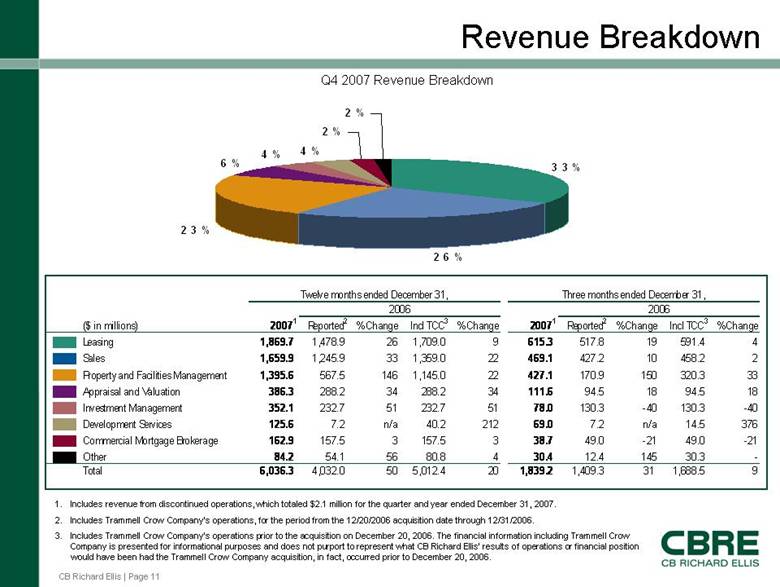
CB Richard Ellis | Page 11 3 3 % 2 6 % 2 3 % 6 % 4 % 4 % 2 % 2 % Revenue Breakdown 1. Includes revenue from discontinued operations, which totaled $2.1 million for the quarter and year ended December 31, 2007. 2. Includes Trammell Crow Company’s operations, for the period from the 12/20/2006 acquisition date through 12/31/2006. 3. Includes Trammell Crow Company’s operations prior to the acquisition on Dec ember 20, 2006. T he financial information including Trammell Crow Company is presented for informational purposes and does not purport to represent what CB Richard Ellis’ results of operations or financial position would have been had the Trammell Crow Company acquisition, in fact, occurred prior to Dec ember 20, 2006. Q4 2007 Revenue Breakdown ($ in millions) 20071 Reported2 % Change Incl TCC3 % Change 20071 Reported2 % Change Incl TCC3 % Change Leasing 1,869.7 1,478.9 26 1,709.0 9 615.3 517.8 19 591.4 4 Sales 1,659.9 1,245.9 33 1,359.0 22 469.1 427.2 10 458.2 2 Property and Facilities Management 1,395.6 567.5 146 1,145.0 22 427.1 170.9 150 320.3 33 Appraisal and Valuation 386.3 288.2 34 288.2 34 111.6 94.5 18 94.5 18 Investment Management 352.1 232.7 51 232.7 51 78.0 130.3 -40 130.3 -40 Development Services 125.6 7.2 n/a 40.2 212 69.0 7.2 n/a 14.5 376 Commercial Mortgage Brokerage 162.9 157.5 3 157.5 3 38.7 49.0 -21 49.0 -21 Other 84.2 54.1 56 80.8 4 30.4 12.4 145 30.3 - Total 6,036.3 4,032.0 50 5,012.4 20 1,839.2 1,409.3 31 1,688.5 9 2006 Twelve months ended December 31, 2006 Three months ended December 31, |
|
|
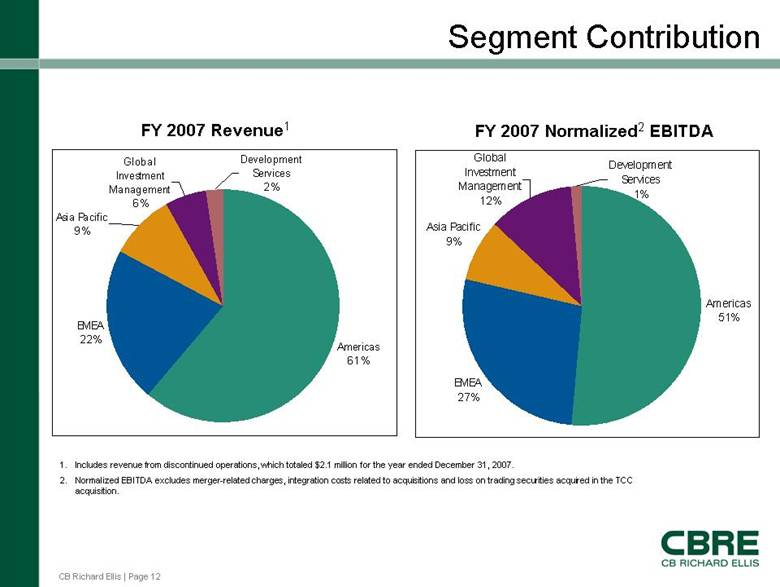
CB Richard Ellis | Page 12 Segment Contribution FY 2007 Revenue1 FY 2007 Normalized2 EBITDA Americas 61% EMEA 22% Asia Pacific 9% Global Investment Management 6% Development Services 2% Americas 51% EMEA 27% Asia Pacific 9% Global Investment Management 12% Development Services 1% 1. Includes revenue from discontinued operations, which totaled $2.1 million for the year ended December 31, 2007. 2. Normalized EBITDA excludes merger-related charges, integration costs related to acquisitions and loss on trading securities acquired in the TCC acquisition. |
|
|
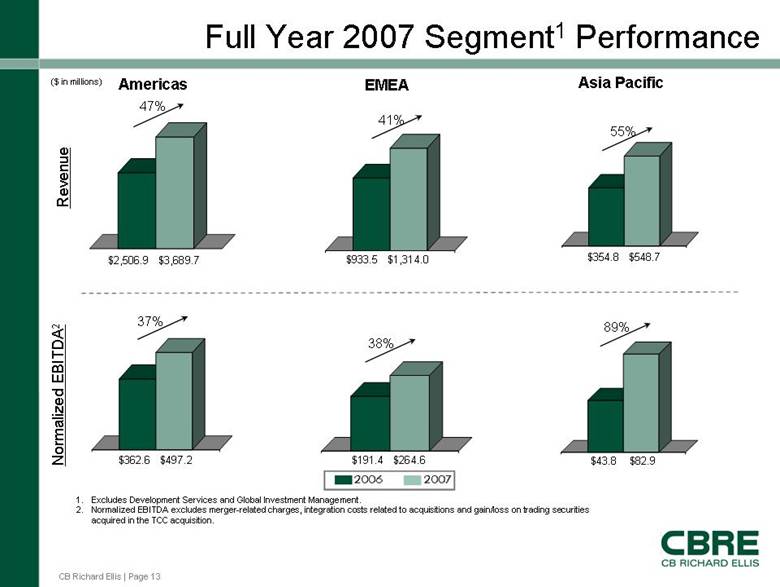
CB Richard Ellis | Page 13 Full Year 2007 Segment1 Performance Americas EMEA Asia Pacific 47% 41% 55% 37% 38% 89% $2,506.9 $3,689.7 $933.5 $1,314.0 $354.8 $548.7 $362.6 $497.2 $191.4 $264.6 $43.8 $82.9 Revenue Normalized EBITDA2 1. Excludes Development Ser vices and Global Investment Management. 2. Normalized EBITDA excludes merger-related charges, integration costs related to acquisitions and gain/loss on trading securities acquired in the TCC acquisition. ($ in millions) |
|
|
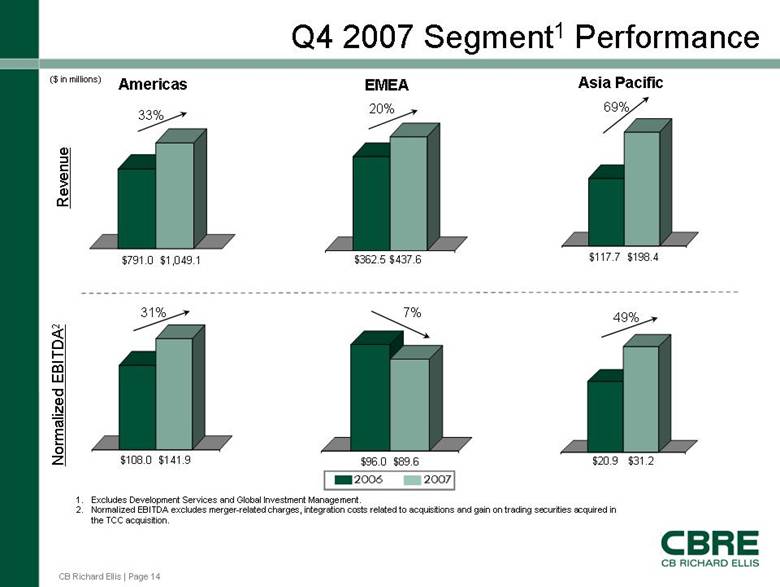
CB Richard Ellis | Page 14 Q4 2007 Segment1 Performance Americas EMEA Asia Pacific 33% 20% 69% 31% 7% 49% $791.0 $1,049.1 $362.5 $437.6 $117.7 $198.4 $108.0 $141.9 $96.0 $89.6 $20.9 $31.2 Revenue Normalized EBITDA2 1. Excludes Development Ser vices and Global Investment Management. 2. Normalized EBITDA excludes merger-related charges, integration costs related to acquisitions and gain on trading securities acquired in the TCC acquisition. ($ in millions) |
|
|
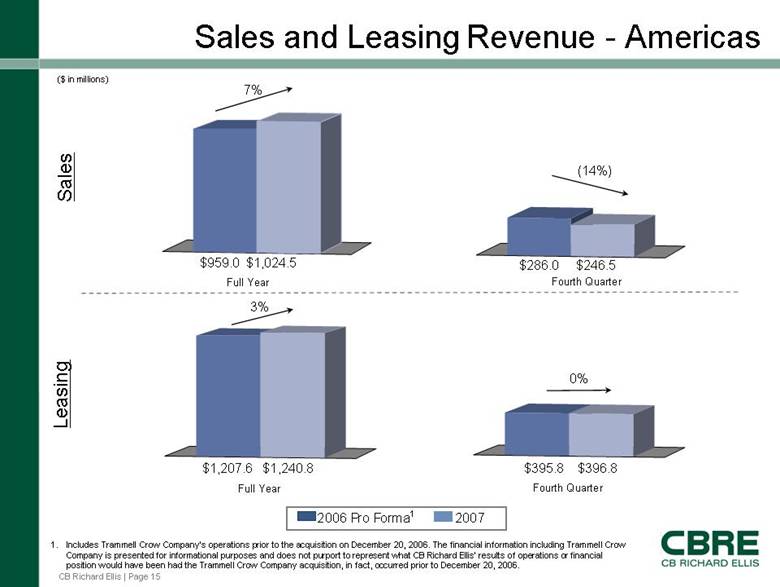
CB Richard Ellis | Page 15 Sales and Leasing Revenue - Americas 7% (14%) 3% 0% Sales Leasing Full Year Full Year Fourth Quarter Fourth Quarter 1. Includes Trammell Crow Company’s operations prior to the acquisition on Dec ember 20, 2006. T he financial information including Trammell Crow Company is presented for informational purposes and does not purport to represent what CB Richard Ellis’ results of operations or financial position would have been had the Trammell Crow Company acquisition, in fact, occurred prior to December 20, 2006. ($ in millions) $959.0 $1,024.5 $286.0 $246.5 $1,207.6 $1,240.8 $395.8 $396.8 2006 Pro Forma1 2007 |
|
|
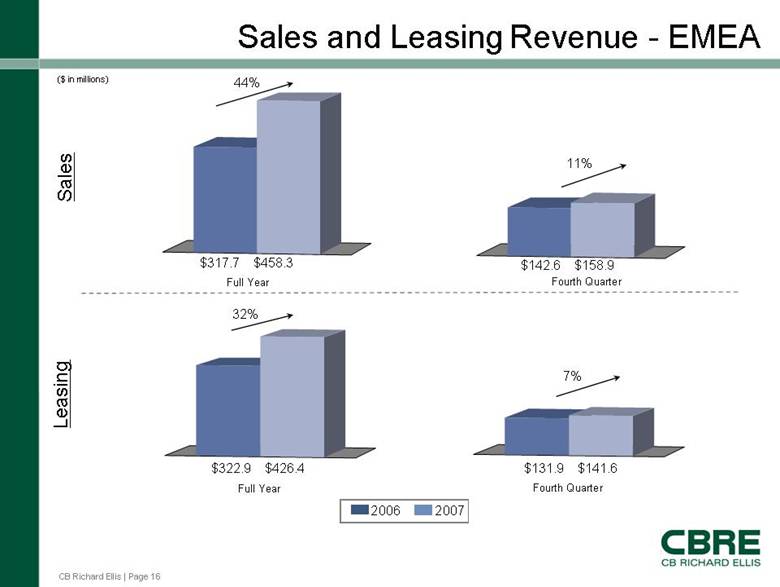
CB Richard Ellis | Page 16 Sales and Leasing Revenue - EMEA 44% 11% 32% 7% Sales Leasing Full Year Full Year Fourth Quarter Fourth Quarter ($ in millions) $317.7 $458.3 $142.6 $158.9 $322.9 $426.4 $131.9 $141.6 2006 2007 |
|
|
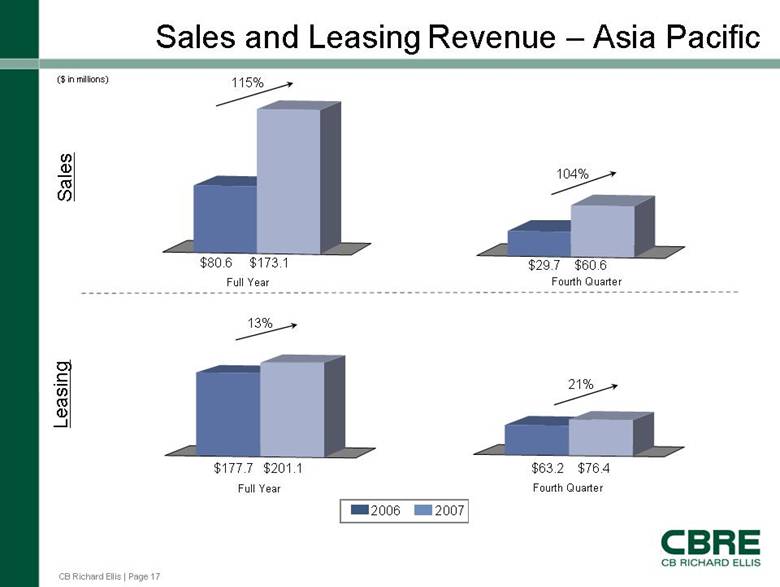
CB Richard Ellis | Page 17 Sales and Leasing Revenue – Asia Pacific 115% 104% 13% 21% Sales Leasing Full Year Full Year Fourth Quarter Fourth Quarter ($ in millions) $80.6 $173.1 $29.7 $60.6 $177.7 $201.1 $63.2 $76.4 2006 2007 |
|
|
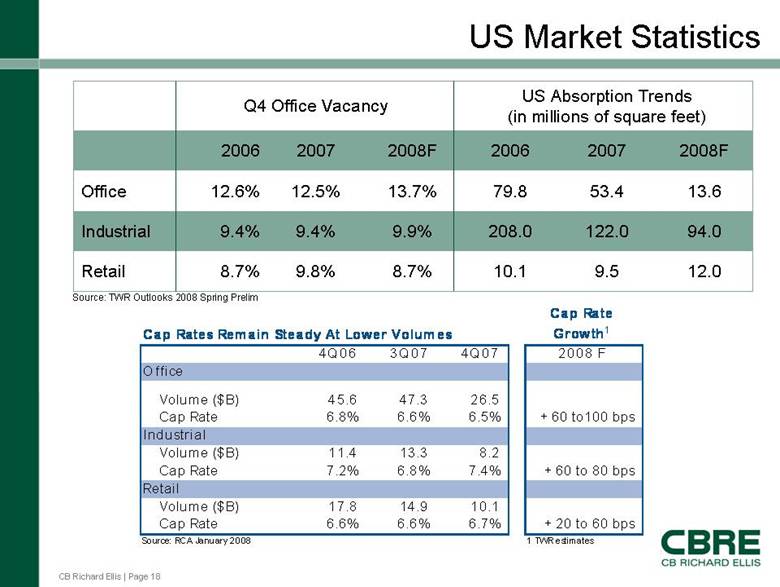
CB Richard Ellis | Page 18 US Market Statistics 9.8% 9.4% 12.5% 2007 8.7% 9.9% 13.7% 2008F 9.5 122.0 53.4 2007 12.0 10.1 8.7% Retail 94.0 208.0 9.4% Industrial 13.6 79.8 12.6% Office 2008F 2006 2006 US Absorption Trends (in millions of square feet) Q4 Office Vacancy Source: TWR Outlooks 2008 Spring Prelim Cap Rates Remain Steady At Lower Volumes Cap Rate Growth1 4Q06 3Q07 4Q07 2008 F Office Volume ($B) 45.6 47.3 26.5 Cap Rate 6.8% 6.6% 6.5% + 60 to100 bps Industrial Volume ($B) 11.4 13.3 8.2 Cap Rate 7.2% 6.8% 7.4% + 60 to 80 bps Retail Volume ($B) 17.8 14.9 10.1 Cap Rate 6.6% 6.6% 6.7% + 20 to 60 bps Source: RCA January 2008 1 TWR estimates |
|
|
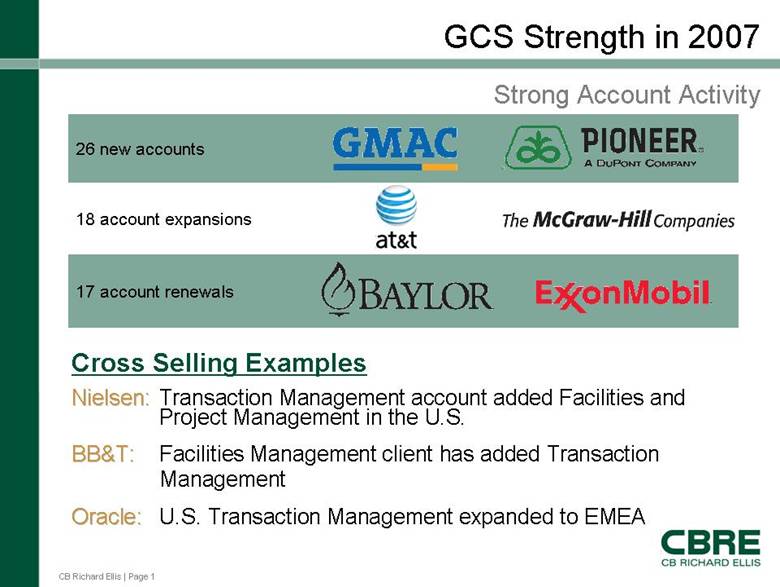
CB Richard Ellis | Page 19 GCS Strength in 2007 17 account renewals 18 account expansions 26 new accounts Strong Account Activity Cross Selling Examples Nielsen: Nielsen: Transaction Management account added Facilities and Project Management in the U.S. BB&T: BB&T: Facilities Management client has added Transaction Management Oracle: Oracle: U.S. Transaction Management expanded to EMEA |
|
|
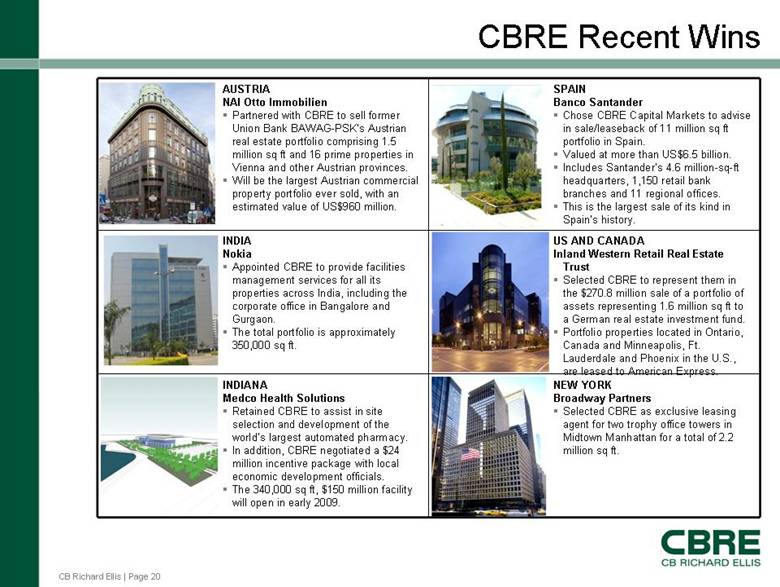
CB Richard Ellis | Page 20 CBRE Recent Wins NEW YORK Broadway Partners Selected CBRE as exclusive leasing agent for two trophy office towers in Midtown Manhattan for a total of 2.2 million sq ft. INDIANA Medco Health Solutions Retained CBRE to assist in site selection and development of the world’s largest automated pharmacy. In addition, CBRE negotiated a $24 million incentive package with local economic development officials. The 340,000 sq ft, $150 million facility will open in early 2009. US AND CANADA Inland Western Retail Real Estate Trust Selected CBRE to represent them in the $270.8 million sale of a portfolio of assets representing 1.6 million sq ft to a German real estate investment fund. Portfolio properties located in Ontario, Canada and Minneapolis, Ft. Lauderdale and Phoenix in the U.S., are leased to American Express. INDIA Nokia Appointed CBRE to provide facilities management services for all its properties across India, including the corporate office in Bangalore and Gurgaon. The total portfolio is approximately 350,000 sq ft. SPAIN Banco Santander Chose CBRE Capital Markets to advise in sale/leaseback of 11 million sq ft portfolio in Spain. Valued at more than US$6.5 billion. Includes Santander’s 4.6 million-sq-ft headquarters, 1,150 retail bank branches and 11 regional offices. This is the largest sale of its kind in Spain’s history. AUSTRIA NAI Otto Immobilien Partnered with CBRE to sell former Union Bank BAWAG-PSK’s Austrian real estate portfolio comprising 1.5 million sq ft and 16 prime properties in Vienna and other Austrian provinces. Will be the largest Austrian commercial property portfolio ever sold, with an estimated value of US$960 million. |
|
|
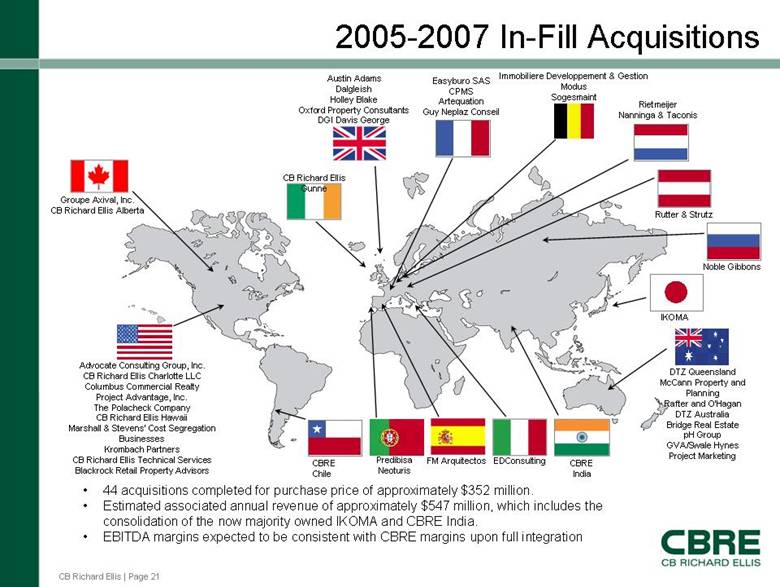
CB Richard Ellis | Page 21 2005-2007 In-Fill Acquisitions Advocate Consulting Group, Inc. CB Richard Ellis Charlotte LLC Columbus Commercial Realty Project Advantage, Inc. The Polacheck Company CB Richard Ellis Hawaii Marshall & Stevens’ Cost Segregation Businesses Krombach Partners CB Richard Ellis Technical Services Blackrock Retail Property Advisors Groupe Axival, Inc. CB Richard Ellis Alberta Austin Adams Dalgleish Holley Blake Oxford Property Consultants DGI Davis George CB Richard Ellis Gunne Rietmeijer Nanninga & Taconis Easyburo SAS CPMS Artequation Guy Neplaz Conseil Immobiliere Developpement & Gestion Modus Sogesmaint Rutter & Strutz Noble Gibbons IKOMA DTZ Queensland McCann Property and Planning Rafter and O’Hagan DTZ Australia Bridge Real Estate pH Group GVA/Swale Hynes Project Marketing Predibisa Neoturis FM Arquitectos EDConsulting CBRE India • 44 acquisitions completed for purchase price of approximately $352 million. • Estimated associated annual revenue of approximately $547 million, which includes the consolidation of the now majority owned IKOMA and CBRE India. • EBITDA margins expected to be consistent with CBRE margins upon full integration CBRE Chile |
|
|
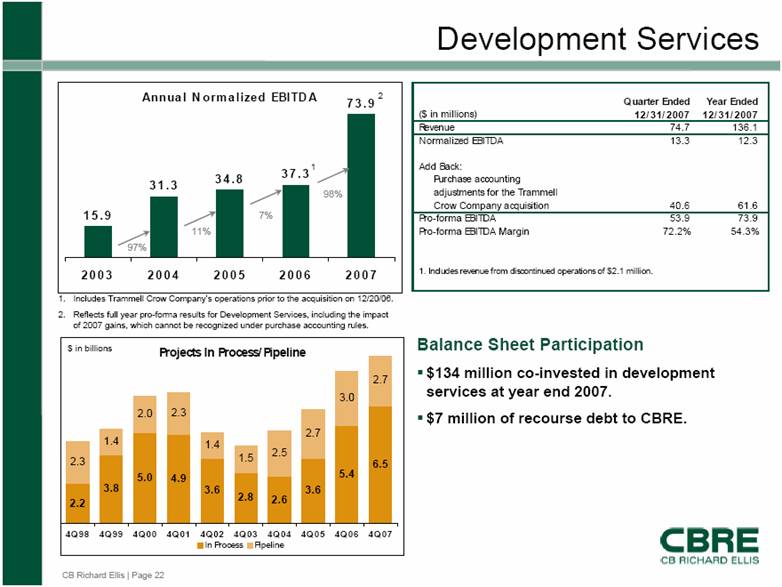
CB Richard Ellis | Page 22 Annual Normalized EBITDA 15.9 31.3 34.8 3 7.3 73.9 2003 2004 2005 2006 2007 Development Services 1. Includes Trammell Crow Company’s operations prior to the acquisition on 12/20/06. 2. Reflects full year pro-forma results for Development Services, including the impact of 2007 gains, which cannot be recognized under purchase accounting rules. 97% 11% 7% Balance Sheet Participation $134 million co-invested in development services at year end 2007. $7 million of recourse debt to CBRE. Projects In Process/Pipeline 2.2 3.8 5.0 4.9 3.6 2.8 2.6 3.6 5.4 6.5 2.3 1.4 2.0 2.3 1.4 1.5 2.5 2.7 3.0 2.7 4Q98 4Q99 4Q00 4Q01 4Q02 4Q03 4Q04 4Q05 4Q06 4Q07 In Process Pipeline $ in billions 98% 2 1 Quarter Ended Year Ended ($ in millions) 12/31/2007 12/31/2007 Revenue 74.7 136.1 Normalized EBITDA 13.3 12.3 Add Back: Purchase accounting adjustments for the Trammell Crow Company acquisition 40.6 61.6 Pro-forma EBITDA 53.9 73.9 Pro-forma EBITDA Margin 72.2% 54.3% 1. Includes revenue from discontinued operations of $2.1 million. |
|
|
CB Richard Ellis | Page 23 CBRE Investors Global real estate investment manager. $38 billion in assets under management. 120 institutional investor partners and clients. Diversified geographically with more than 50% of assets outside of the U.S. Focus Area: INVESTMENT MANAGEMENT |
|
|
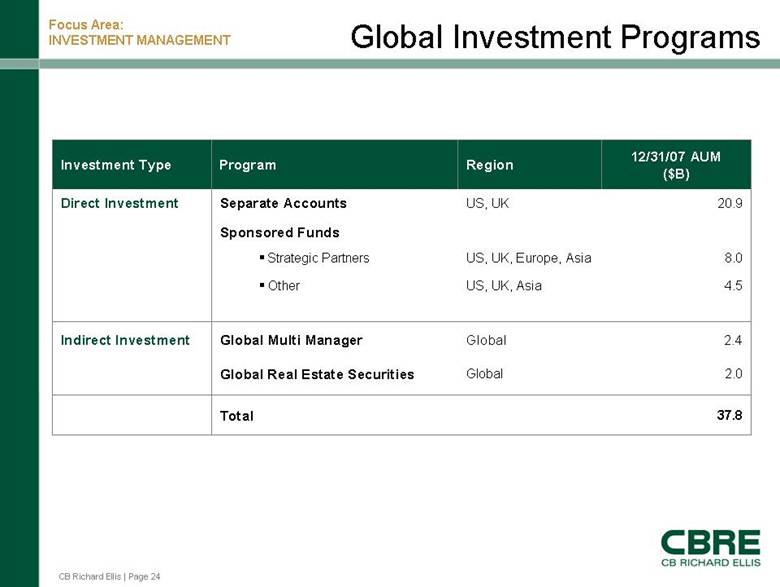
CB Richard Ellis | Page 24 Global Investment Programs 8.0 US, UK, Europe, Asia Strategic Partners Sponsored Funds Global Global US, UK, Asia US, UK Region 37.8 2.0 2.4 4.5 20.9 12/31/07 AUM ($B) Global Real Estate Securities Total Global Multi Manager Indirect Investment Other Separate Accounts Direct Investment Program Investment Type Focus Area: INVESTMENT MANAGEMENT |
|
|
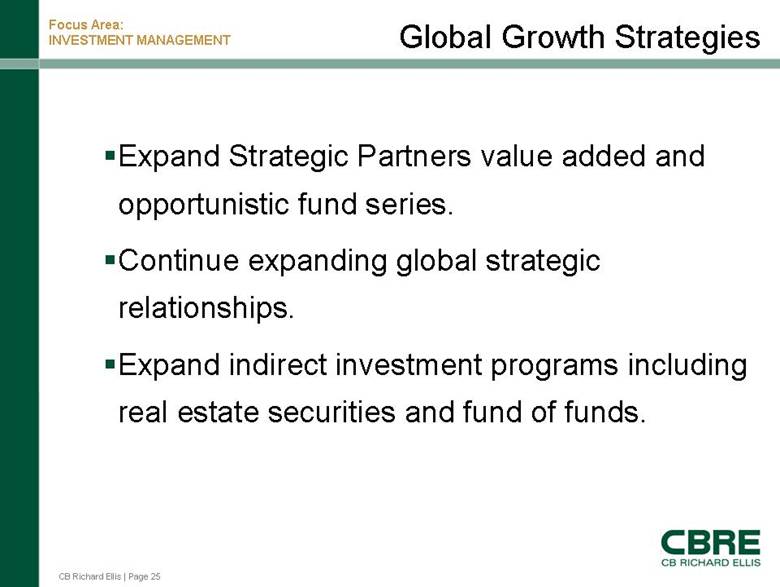
CB Richard Ellis | Page 25 Global Growth Strategies Expand Strategic Partners value added and opportunistic fund series. Continue expanding global strategic relationships. Expand indirect investment programs including real estate securities and fund of funds. Focus Area: INVESTMENT MANAGEMENT |
|
|
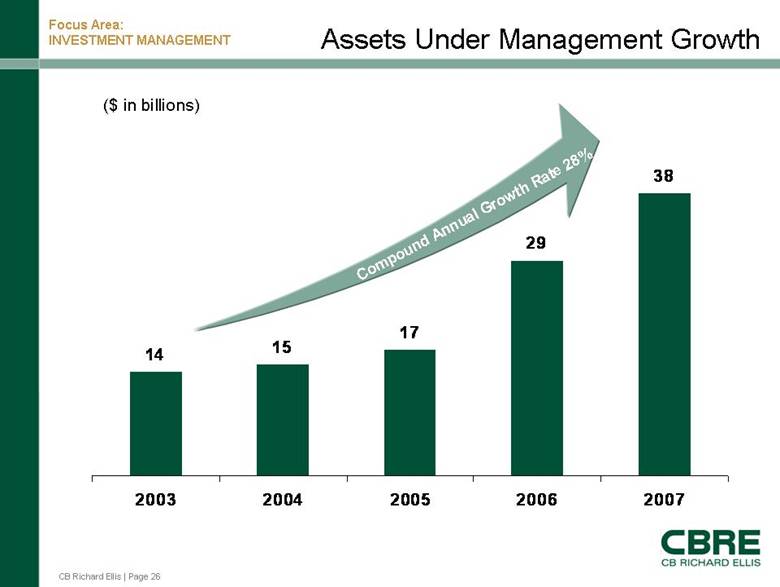
CB Richard Ellis | Page 26 Assets Under Management Growth 14 15 17 29 38 2003 2004 2005 2006 2007 Compound Annual Growth Rate 28 % ($ in billions) Focus Area: INVESTMENT MANAGEMENT |
|
|
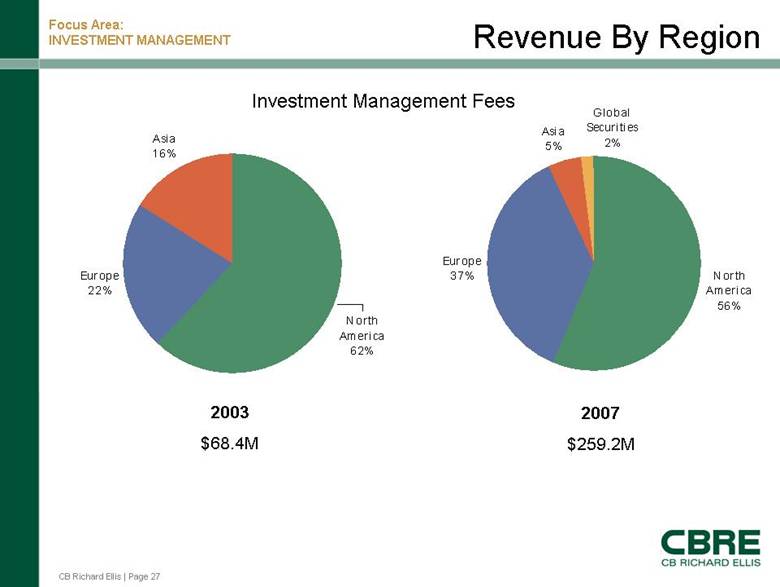
CB Richard Ellis | Page 27 Revenue By Region Europe 22% Asia 16% North America 62% Europe 37% Asia 5% North America 56% Global Securities 2% 2003 $68.4M 2007 $259.2M Focus Area: INVESTMENT MANAGEMENT Investment Management Fees |
|
|
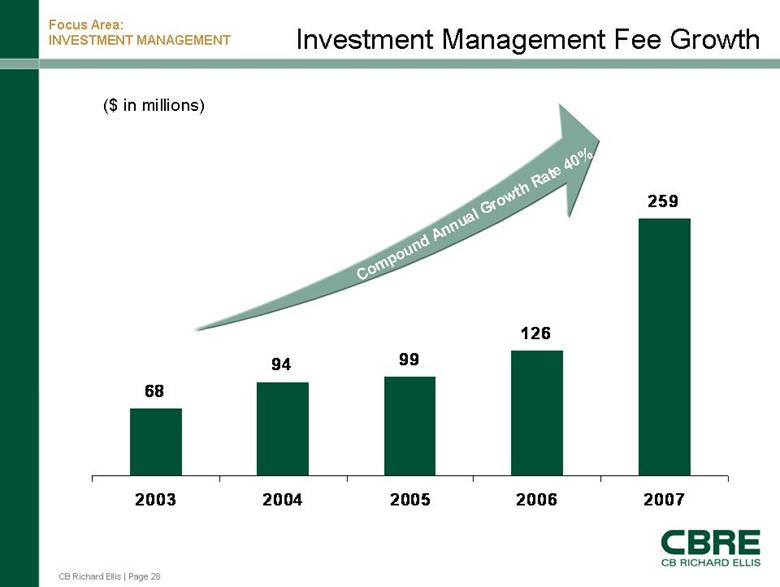
CB Richard Ellis | Page 28 Investment Management Fee Growth 68 94 99 126 259 2003 2004 2005 2006 2007 Compound Annual Growth Rate 40% ($ in millions) Focus Area: INVESTMENT MANAGEMENT |
|
|
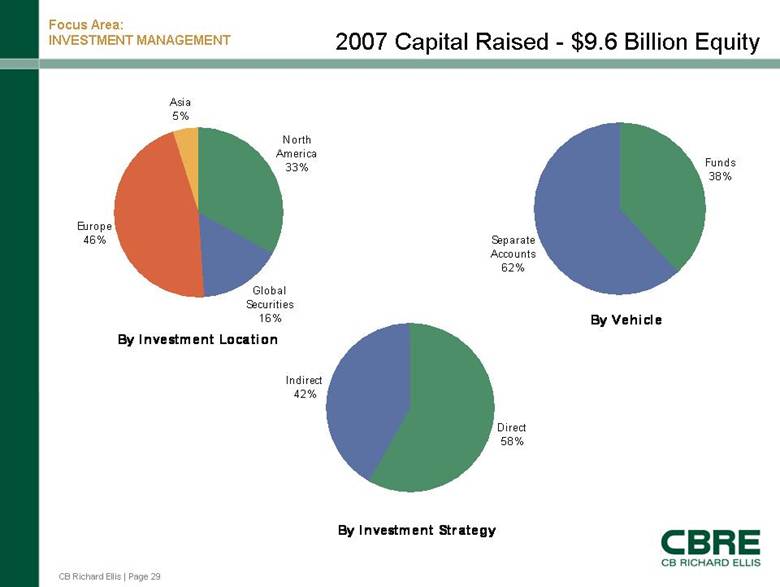
CB Richard Ellis | Page 29 2007 Capital Raised - $9.6 Billion Equity By Investment Location Europe 46% Global Securities 16% North America 33% Asia 5% By Vehicle Separate Accounts 62% Funds 38% By Investment Strategy Indirect 42% Direct 58% Focus Area: INVESTMENT MANAGEMENT |
|
|
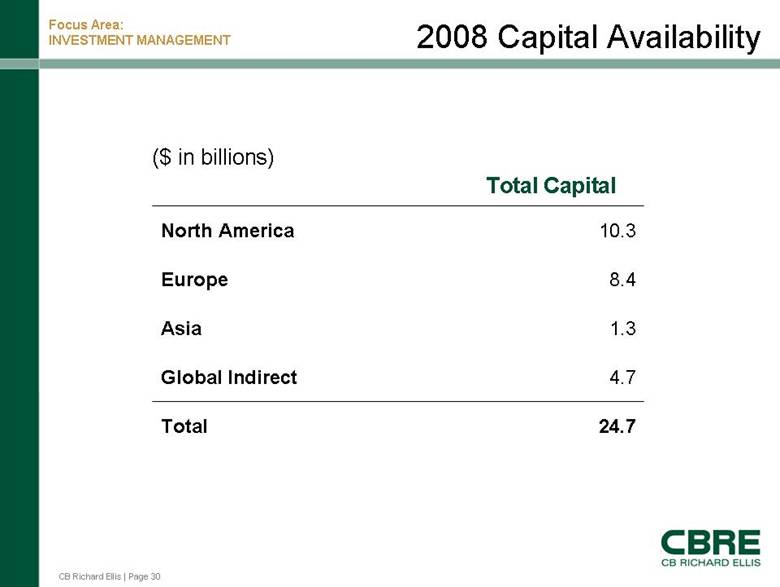
CB Richard Ellis | Page 30 2008 Capital Availability Total Capital 24.7 4.7 1.3 8.4 10.3 Asia Total Global Indirect Europe North America ($ in billions) Focus Area: INVESTMENT MANAGEMENT |
|
|
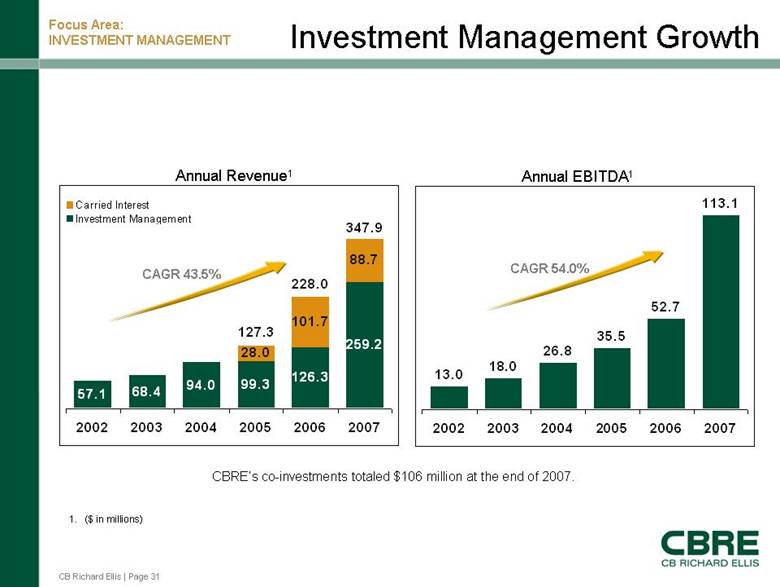
CB Richard Ellis | Page 31 13.0 18.0 26.8 35.5 52.7 113.1 2002 2003 2004 2005 2006 2007 57.1 68.4 94.0 99.3 126.3 259.2 28.0 101.7 88.7 347.9 127.3 228.0 2002 2003 2004 2005 2006 2007 Carried Interest Investment Management Investment Management Growth Annual Revenue1. ($ in millions) CAGR 43.5% CAGR 54.0% Annual EBITDA1 Focus Area: INVESTMENT MANAGEMENT CBRE’s co-investments totaled $106 million at the end of 2007. |
|
|
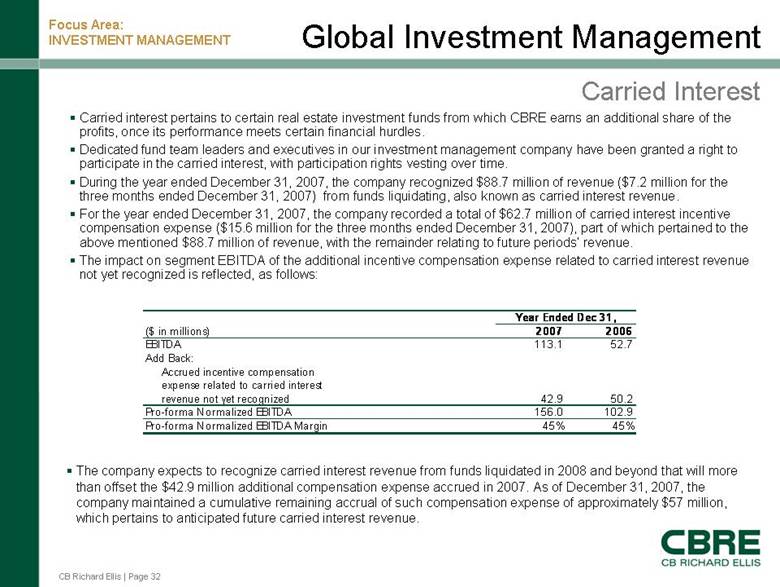
CB Richard Ellis | Page 32 Global Investment Management Carried Interest Carried interest pertains to certain real estate investment funds from which CBRE earns an additional share of the profits, once its performance meets certain financial hurdles. Dedicated fund team leaders and executives in our investment management company have been granted a right to participate in the carried interest, with participation rights vesting over time. During the year ended December 31, 2007, the company recognized $88.7 million of revenue ($7.2 million for the three months ended December 31, 2007) from funds liquidating, also known as carried interest revenue. For the year ended December 31, 2007, the company recorded a total of $62.7 million of carried interest incentive compensation expense ($15.6 million for the three months ended December 31, 2007), part of which pertained to the above mentioned $88.7 million of revenue, with the remainder relating to future periods’ revenue. The impact on segment EBITDA of the additional incentive compensation expense related to carried interest revenue not yet recognized is reflected, as follows: The company expects to recognize carried interest revenue from funds liquidated in 2008 and beyond that will more than offset the $42.9 million additional compensation expense accrued in 2007. As of December 31, 2007, the company maintained a cumulative remaining accrual of such compensation expense of approximately $57 million, which pertains to anticipated future carried interest revenue. Focus Area: INVESTMENT MANAGEMENT ($ in millions) 2007 2006 EBITDA 113.1 52.7 Add Back: Accrued incentive compensation expense related to carried interest revenue not yet recognized 42.9 50.2 Pro-forma Normalized EBITDA 156.0 102.9 Pro-forma Normalized EBITDA Margin 45% 45% Year Ended Dec 31, |
|
|
CB Richard Ellis | Page 33 Market Environment Global liquidity and strong economic growth in first half of 2007. Reduced liquidity and weakening U.S. economy by the fourth quarter of 2007. Market conditions likely to worsen before they improve. Expect normalized rates of growth to return when positive economic and liquidity correction occurs. |
|
|
CB Richard Ellis | Page 34 2008 Opportunities CBRE Growth Uniquely positioned to thrive in tough environment: • Most diversified revenue base (geography & services) • Variable cost structure • Strong balance sheet • Solid cash flow generation Opportunity to gain share through: • Cross selling • Industry consolidation • Acquisition opportunities • Attracting and retaining talent |
|
|
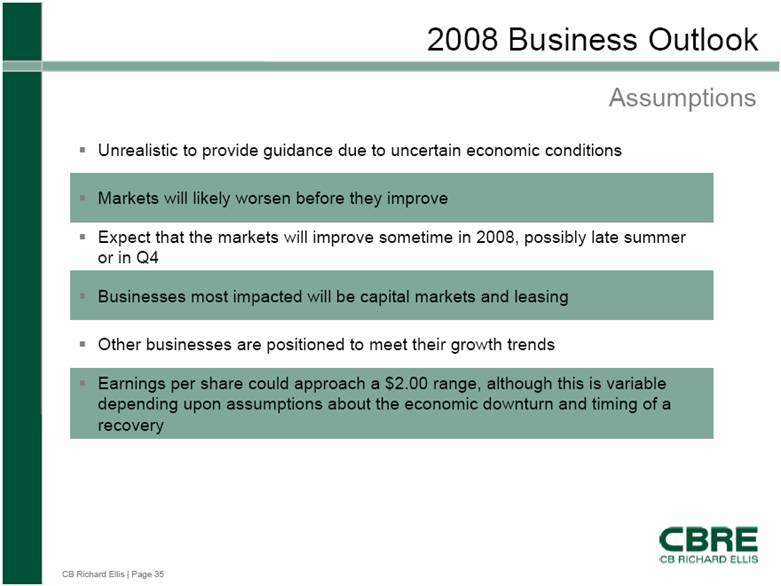
CB Richard Ellis | Page 35 2008 Business Outlook Earnings per share could approach a $2.00 range, although this is variable depending upon assumptions about the economic downturn and timing of a recovery Other businesses are positioned to meet their growth trends Businesses most impacted will be capital markets and leasing Expect that the markets will improve sometime in 2008, possibly late summer or in Q4 Markets will likely worsen before they improve Unrealistic to provide guidance due to uncertain economic conditions Assumptions |
|
|
CB Richard Ellis | Page 36 Appendix |
|
|
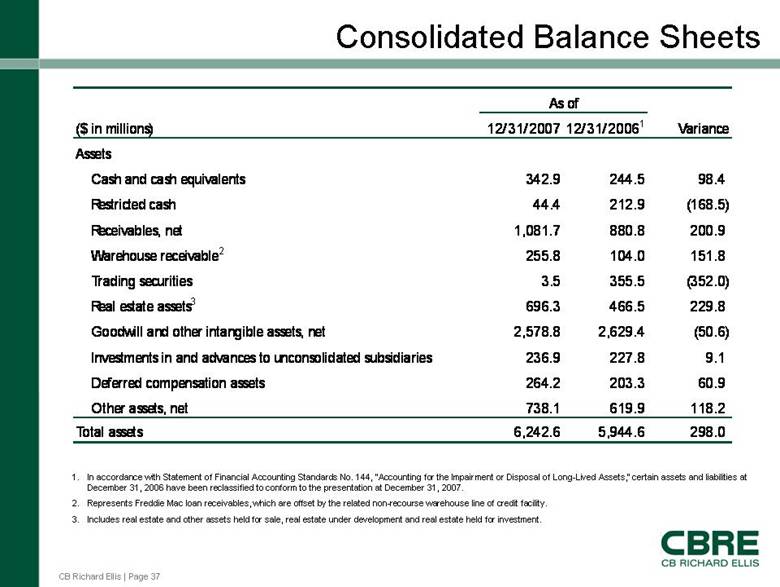
CB Richard Ellis | Page 37 Consolidated Balance Sheets 1. In accordance with Statement of Financial Accounting Standards No. 144, “Accounting for the Impairment or Disposal of Long-Lived Assets,” certain assets and liabilities at December 31, 2006 have been reclassified to conform to the presentation at December 31, 2007. 2. Represents Freddie Mac loan receivables, which are offset by the related non-recourse warehouse line of credit facility. 3. Includes real estate and other assets held for sale, real estate under development and real estate held for investment. ($ in millions) 12/31/2007 12/31/20061 Variance Assets Cash and cash equivalents 342.9 244.5 98.4 Restricted cash 44.4 212.9 (168.5) Receivables, net 1,081.7 880.8 200.9 Warehouse receivable2 255.8 104.0 151.8 Trading securities 3.5 355.5 (352.0) Real estate assets3 696.3 466.5 229.8 Goodwill and other intangible assets, net 2,578.8 2,629.4 (50.6) Investments in and advances to unconsolidated subsidiaries 236.9 227.8 9.1 Deferred compensation assets 264.2 203.3 60.9 Other assets, net 738.1 619.9 118.2 Total assets 6,242.6 5,944.6 298.0 As of |
|
|
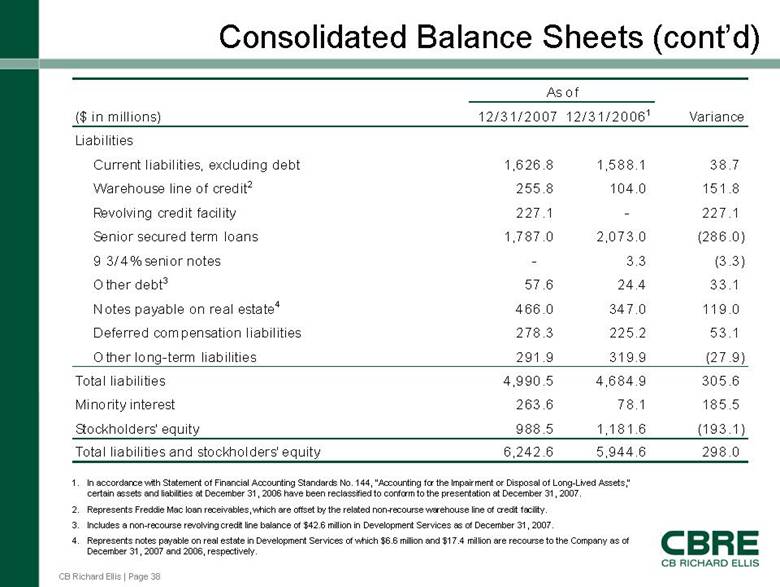
CB Richard Ellis | Page 38 Consolidated Balance Sheets (cont’d) 1. In accordance with Statement of Financial Accounting Standards No. 144, “Accounting for the Impairment or Disposal of Long-Lived Assets,” certain assets and liabilities at December 31, 2006 have been reclassified to conform to the presentation at December 31, 2007. 2. Represents Freddie Mac loan receivables, which are offset by the related non-recourse warehouse line of credit facility. 3. Includes a non-recourse revolving credit line balance of $42.6 million in Development Services as of December 31, 2007. 4. Represents notes payable on real estate in Development Ser vices of which $6.6 million and $17.4 million are recourse to the Company as of December 31, 2007 and 2006, respectively. ($ in millions) 12/31/ 2007 12/ 31/ 20061 Variance Liabilities Current liabilities, excluding debt 1,626.8 1,588.1 38.7 Warehouse line of credit2 255.8 104.0 151.8 Revolving credit facility 227.1 - 227.1 Senior secured term loans 1,787.0 2,073.0 (286.0) 9 3/4% senior notes - 3.3 (3.3) Other debt3 57.6 24.4 33.1 Notes payable on real estate4 466.0 347.0 119.0 Deferred compensation liabilities 278.3 225.2 53.1 Other long-term liabilities 291.9 319.9 (27.9) Total liabilities 4,990.5 4,684.9 305.6 Minority interest 263.6 78.1 185.5 Stockholders' equity 988.5 1,181.6 (193.1) Total liabilities and stockholders' equity 6,242.6 5,944.6 298.0 As of |
|
|
CB Richard Ellis | Page 39 GAAP Reconciliation Tables |
|
|
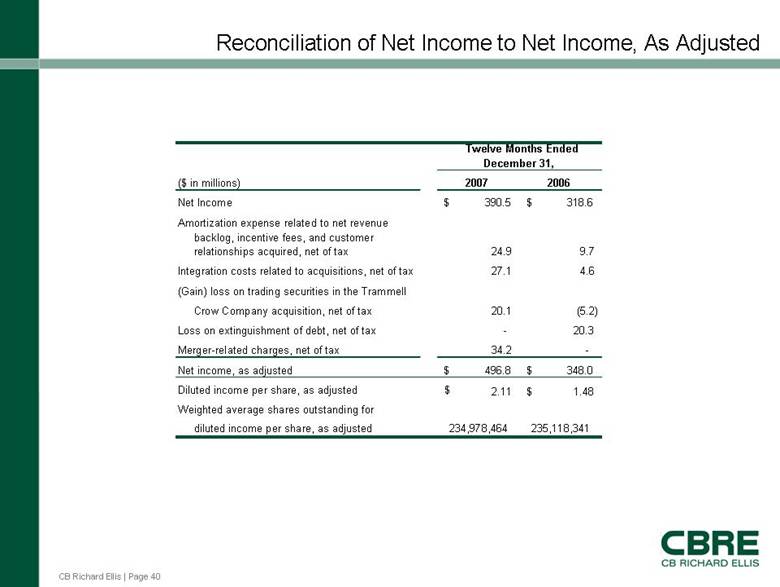
CB Richard Ellis | Page 40 Reconciliation of Net Income to Net Income, As Adjusted ($ in millions) 2007 2006 Net Income 390.5 $ 318.6 $ Amortization expense related to net revenue backlog, incentive fees, and customer relationships acquired, net of tax 24.9 9.7 Integration costs related to acquisitions, net of tax 27.1 4.6 (Gain) loss on trading securities in the Trammell Crow Company acquisition, net of tax 20.1 (5.2) Loss on extinguishment of debt, net of tax - 20.3 Merger-related charges, net of tax 34.2 - Net income, as adjusted 496.8 $ 348.0 $ Diluted income per share, as adjusted Weighted average shares outstanding for 2.11 $ 1.48 $ diluted income per share, as adjusted 234,978,464 235,118,341 Twelve Months Ended December 31, |
|
|
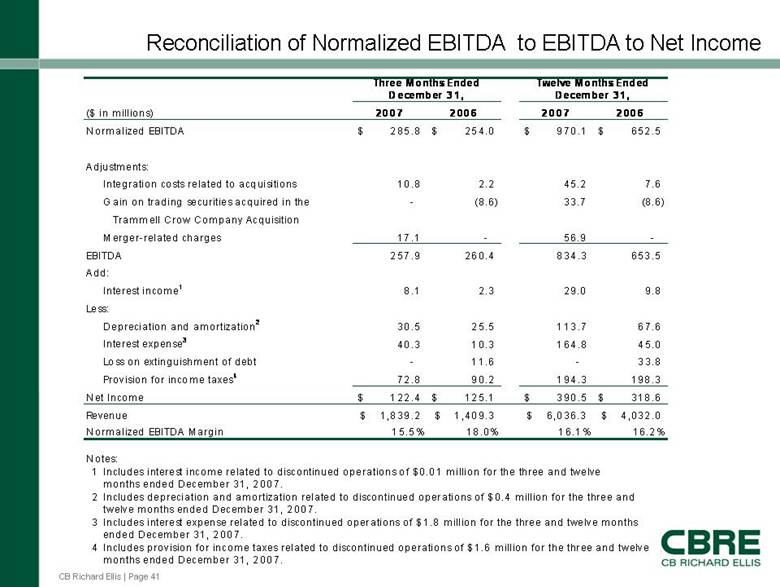
CB Richard Ellis | Page 41 Reconciliation of Normalized EBITDA to EBITDA to Net Income ($ in millions) 2007 2006 2007 2006 Normalized EBITDA 285.8 $ 254.0 $ 970.1 $ 652.5 $ Adjustments: Integration costs related to acquisitions 10.8 2.2 45.2 7.6 Gain on trading securities acquired in the - (8.6) 33.7 (8.6) Trammell Crow Company Acquisition Merger-related charges 17.1 - 56.9 - EBITDA 257.9 260.4 834.3 653.5 Add: Interest income1 8.1 2.3 29.0 9.8 Less: Depreciation and am ortization2 30.5 25.51 13.7 67.6 Interest expense340.3 10.3 164.8 45.0 Loss on extinguishment of debt - 11.6 - 33.8 Provision for income taxes4 72.8 9 0.2 194.3 198.3 Net Income 122.4 $ 125.1 $ 390.5 $ 318.6 $ Revenue 1,839.2 $ 1,409.3 $ 6,036.3 $ 4,032.0 $ Normalized EBITDA Margin 15.5% 18.0% 16.1% 16.2% Notes: 1 Includes interest income related to discontinued operations of $0.01 million for the three and twelve months ended December 31, 2007. 2 Includes depreciation and amortization related to discontinued operations o f $0.4 million for the three and twelve months ended December 31, 2007. 3 Includes interest expense related to discontinued operations of $1.8 million for the three and twelve months ended December 31, 2007. 4 Includes provision for income taxes related to discontinued operations of $1.6 million for the three and twelve months ended December 31, 2007. Three Months Ended December 31, Twelve Months Ended December 31, |
|
|
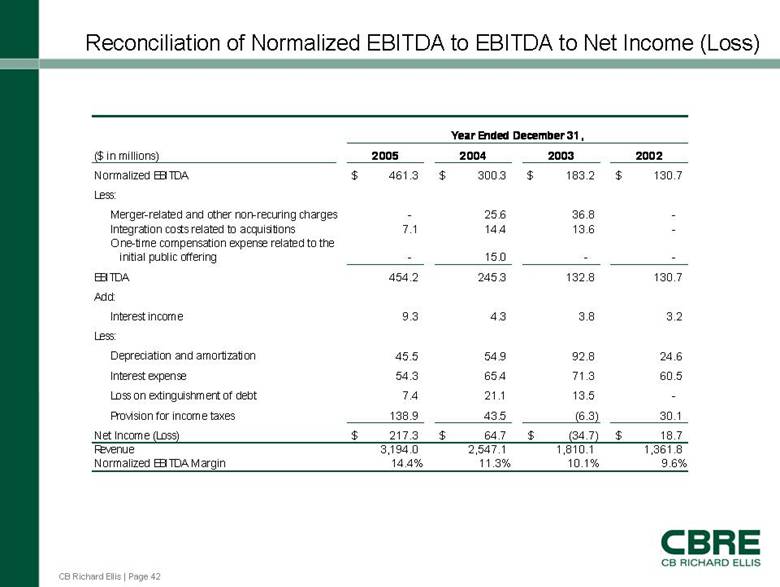
CB Richard Ellis | Page 42 Reconciliation of Normalized EBITDA to EBITDA to Net Income (Loss) ($ in millions) 2005 2004 2003 2002 Normalized EBITDA 461.3 $ 300.3 $ 183.2 $ 130.7 $ Less: Merger-related and other non-recuring charges - 25.6 36.8 - Integration costs related to acquisitions 7.1 14.4 13.6 - One-time compensation expense related to the initial public offering - 15.0 - - EBITDA 454.2 245.3 132.8 130.7 Add: Interest income 9.3 4.3 3.8 3.2 Less: Depreciation and amortization 45.5 54.9 92.8 24.6 Interest expense 54.3 65.4 71.3 60.5 Loss on extinguishment of debt 7.4 21.1 13.5 - Provision for income taxes 138.9 43.5 (6.3) 30.1 Net Income (Loss) 217.3 $ 64.7 $ (34.7) $ 18.7 $ Revenue 3,194.0 2,547.1 1,810.1 1,361.8 Normalized EBITDA Margin 14.4% 11.3% 10.1% 9.6% Year Ended December 31, |
|
|
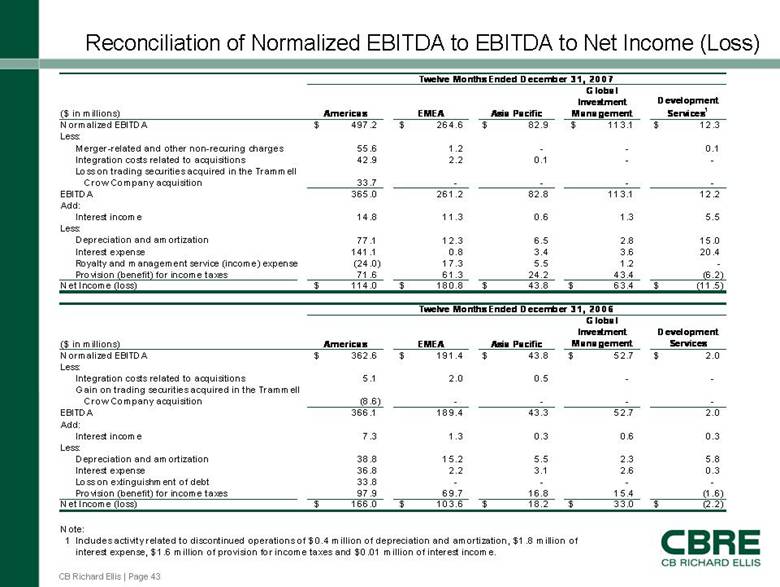
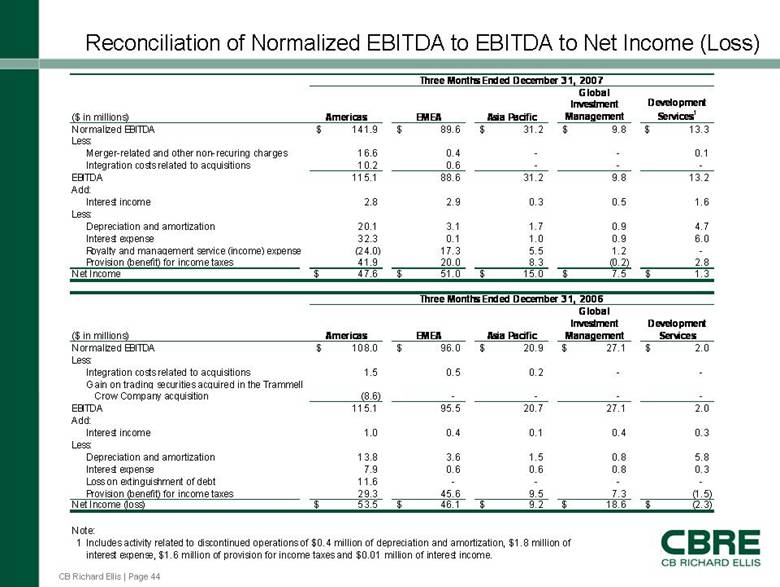
CB Richard Ellis | Page 43 Reconciliation of Normalized EBITDA to EBITDA to Net Income (Loss) ($ in mil lions) America s EMEA Asia Pacific Global Investment Management Development Services1 Normalized EBITDA 49 7.2 $ 26 4.6 $ 8 2.9 $ 11 3.1 $ 12.3 $ Less: Merger -related and other n on-recuring charges 55.6 1.2 - - 0.1 Integration costs related to acquisitions 4 2.9 2.2 0.1 - - Loss on trading securities acquired in the Trammell Crow Comp any acquisition 3 3.7 - - - - EBITDA 36 5.0 26 1.2 8 2.8 11 3.1 12.2 Ad d: Interest income 14.8 11.3 0.6 1.3 5.5 Less: Depreciation and amortization 77.1 12.3 6.5 2.8 15.0 Interest expense 141.1 0.83.43.620.4 Royalty and management service (income) expense (24.0) 17.3 5.5 1.2 - Provision (benefit) for income taxes 71.6 61.3 24.2 43.4 (6.2) Net Income (loss) 11 4.0 $ 18 0.8 $ 4 3.8 $ 6 3.4 $ (11.5) $ ($ in millions) America s EMEA Asia Pacific Global Investment Management Development Service s Normalized EBITDA 362.6 $ 191.4 $ 43.8 $ 52.7 $ 2.0 $ Less: Integration costs related to acquisitions 5.1 2.0 0.5 - - Gain on trading securities acquired in the Trammel l Crow Comp any acquisition (8.6) - - - - EBITDA 366.1 189.4 43.3 52.7 2.0 Add: Interest income 7.3 1.3 0.3 0.6 0.3 Less: Depreciation and amortization 38.8 15.2 5.5 2.3 5.8 Interest expense 36.8 2.2 3.1 2.6 0.3 Loss on extinguishment of debt 33.8 - - - - Pro vision (benefit) for income taxes 97.9 69.7 16.8 15.4 (1.6) Net Income (loss) 166.0 $ 103.6 $ 18.2 $ 33.0 $ (2.2) $ Note: 1 Includes activity related to discontinued operation s of $ 0.4 million of depreciation and amortization, $ 1.8 million of interest expense, $1.6 million of provision for income taxes and $0.0 1 mill ion of interest income. Twelve Months Ended December 3 1 , 20 0 7 Twelve Months Ended December 3 1 , 20 0 6 |
|
|
CB Richard Ellis | Page 44 Reconciliation of Normalized EBITDA to EBITDA to Net Income (Loss) ($ in millions) Americas EMEA Asia Pacific Global Investment Management Development Services1 Normalized EBITDA 141.9 $ 89.6 $ 31.2 $ 9.8 $ 13.3 $ Less: Merger-related and other non-recuring charges 16.6 0.4 - - 0.1 Integration costs related to acquisitions 10.2 0.6 - - - EBITDA 115.1 88.6 31.2 9.8 13.2 Add: Interest income 2.8 2.9 0.3 0.5 1.6 Less: Depreciation and amortization 20.1 3.1 1.7 0.9 4.7 Interest expense 32.3 0.1 1.0 0.9 6.0 Royalty and management service (income) expense (24.0) 17.3 5.5 1.2 - Provision (benefit) for income taxes 41.9 20.0 8.3 (0.2) 2.8 Net Income 47.6 $ 51.0 $ 15.0 $ 7.5 $ 1.3 $ ($ in millions) Americas EMEA Asia Pacific Global Investment Management Development Services Normalized EBITDA 108.0 $ 96.0 $ 20.9 $ 27.1 $ 2.0 $ Less: Integration costs related to acquisitions 1.5 0.5 0.2 - - Gain on trading securities acquired in the Trammell Crow Company acquisition (8.6) - - - - EBITDA 115.1 95.5 20.7 27.1 2.0 Add: Interest income 1.0 0.4 0.1 0.4 0.3 Less: Depreciation and amortization 13.8 3.6 1.5 0.8 5.8 Interest expense 7.9 0.6 0.6 0.8 0.3 Loss on extinguishment of debt 11.6 - - - - Provision (benefit) for income taxes 29.3 45.6 9.5 7.3 (1.5) Net Income (loss) 53.5 $ 46.1 $ 9.2 $ 186 $ (2.3) $ Note: 1 Includes activity related to discontinued operations of $0.4 million of depreciation and amortization, $1.8 million of interest expense, $1.6 million of provision for income taxes and $0.01 million of interest income. Three Months Ended December 31, 2007 Three Months Ended December 31, 2006 |