Exhibit 99.1
|
|
Investor Presentation November 2007 |

Exhibit 99.1
|
|
Investor Presentation November 2007 |
|
|
Forward Looking Statements This presentation contains statements that are forward looking within the meaning of the Private Securities Litigation Reform Act of 1995, including statements regarding our growth momentum in 2007 and 2008, future operations and future financial performance. These statements should be considered as estimates only and actual results may ultimately differ from these estimates. Except to the extent required by applicable securities laws, we undertake no obligation to update or publicly revise any of the forward-looking statements that you may hear today. Please refer to our current annual report on Form 10-K (in particular, “Risk Factors”) and our current quarterly report on Form 10-Q which are filed with the SEC and available at the SEC’s website (http://www.sec.gov), for a full discussion of the risks and other factors, that may impact any estimates that you may hear today. We may make certain statements during the course of this presentation which include references to “non-GAAP financial measures,” as defined by SEC regulations. As required by these regulations, we have provided reconciliations of these measures to what we believe are the most directly comparable GAAP measures, which are attached hereto within the appendix. |
|
|
Company/Market Overview |
|
|
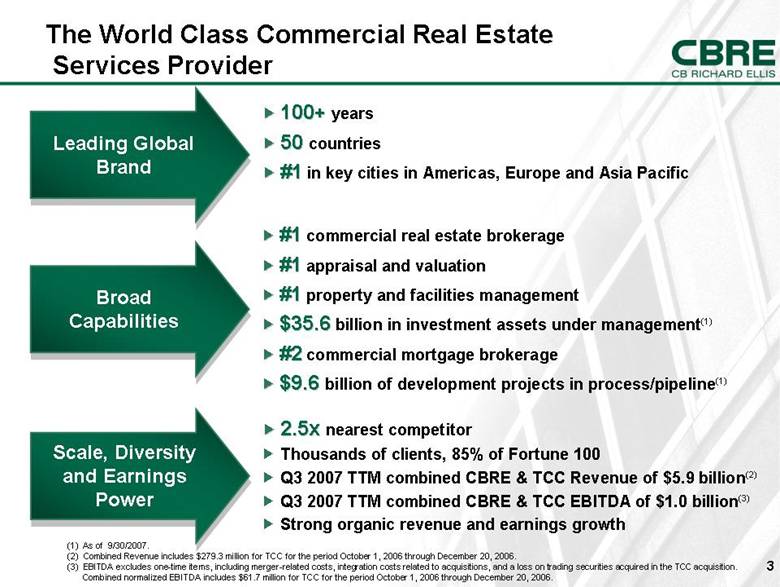
(1) As of 9/30/2007. (2) Combined Revenue includes $279.3 million for TCC for the period October 1, 2006 through December 20, 2006. (3) EBITDA excludes one-time items, including merger-related costs, integration costs related to acquisitions, and a loss on trading securities acquired in the TCC acquisition. Combined normalized EBITDA includes $61.7 million for TCC for the period October 1, 2006 through December 20, 2006. 2.5x nearest competitor Thousands of clients, 85% of Fortune 100 Q3 2007 TTM combined CBRE & TCC Revenue of $5.9 billion(2) Q3 2007 TTM combined CBRE & TCC EBITDA of $1.0 billion(3) Strong organic revenue and earnings growth #1 commercial real estate brokerage #1 appraisal and valuation #1 property and facilities management $35.6 billion in investment assets under management(1) #2 commercial mortgage brokerage $9.6 billion of development projects in process/pipeline(1) Leading Global Brand Broad Capabilities Scale, Diversity and Earnings Power 100+ years 50 countries #1 in key cities in Americas, Europe and Asia Pacific The World Class Commercial Real Estate Services Provider |
|
|
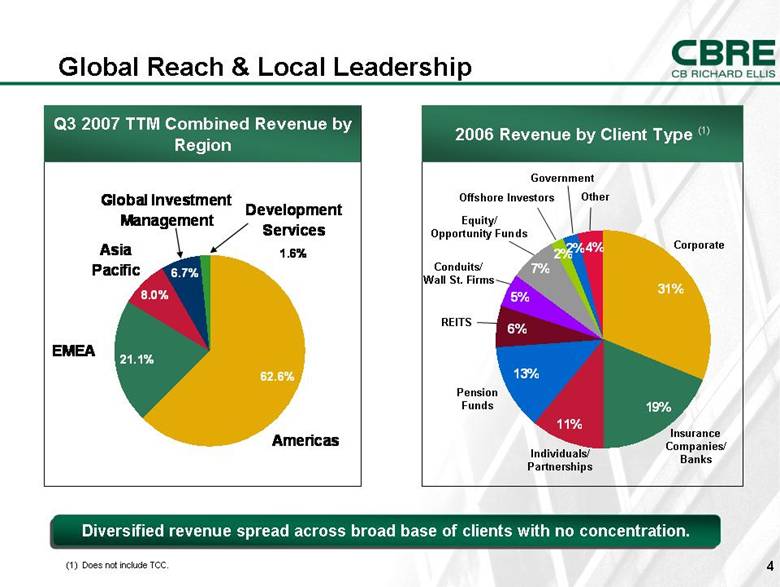
Global Reach & Local Leadership Individuals/ Partnerships 2006 Revenue by Client Type (1) Corporate REITS Insurance Companies/ Banks Pension Funds Government Other Conduits/ Wall St. Firms Equity/ Opportunity Funds Offshore Investors Q3 2007 TTM Combined Revenue by Region Diversified revenue spread across broad base of clients with no concentration. (1) Does not include TCC. 6.7% 8.0% 1.6% 62.6% 21.1% Development Services EMEA Asia Pacific Americas Global Investment Management 4% 2% 2% 13% 6% 5% 7% 31% 19% 11% |
|
|
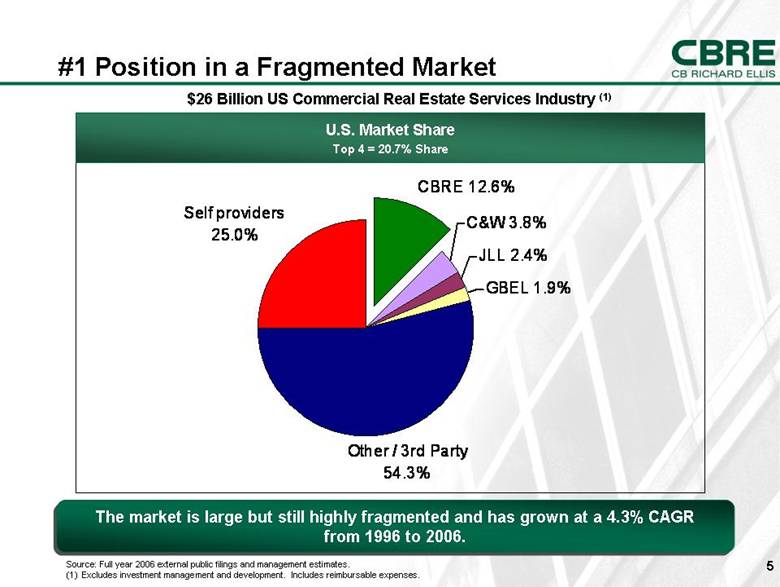
The market is large but still highly fragmented and has grown at a 4.3% CAGR from 1996 to 2006. #1 Position in a Fragmented Market $26 Billion US Commercial Real Estate Services Industry (1) U.S. Market Share Top 4 = 20.7% Share Source: Full year 2006 external public filings and management estimates. (1) Excludes investment management and development. Includes reimbursable expenses. Self providers 25.0% CBRE 12.6% C&W 3.8% JLL 2.4% GBEL 1.9% Other / 3rd Party 54.3% |
|
|
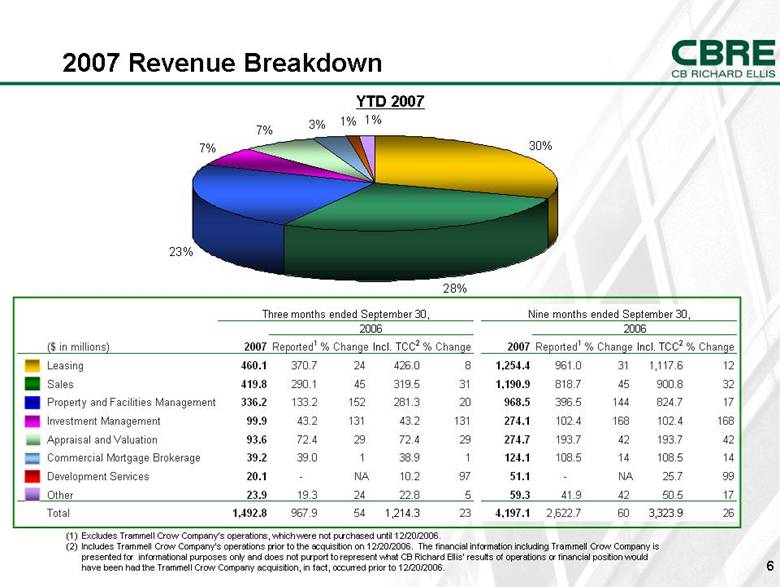
2007 Revenue Breakdown (1) Excludes Trammell Crow Company’s operations, which were not purchased until 12/20/2006. (2) Includes Trammell Crow Company’s operations prior to the acquisition on 12/20/2006. The financial information including Trammell Crow Company is presented for informational purposes only and does not purport to represent what CB Richard Ellis’ results of operations or financial position would have been had the Trammell Crow Company acquisition, in fact, occurred prior to 12/20/2006. YTD 2007 30% 28% 23% 7% 7% 3% 1% 1% ($ in millions) 2007 Reported 1 % Change Incl. TCC 2 % Change 2007 Reported 1 % Change Incl. TCC 2 % Change Leasing 460.1 370.7 24 426.0 8 1,254.4 961.0 31 1,117.6 12 Sales 419.8 290.1 45 319.5 31 1,190.9 818.7 45 900.8 32 Property and Facilities Management 336.2 133.2 152 281.3 20 968.5 396.5 144 824.7 17 Investment Management 99.9 43.2 131 43.2 131 274.1 102.4 168 102.4 168 Appraisal and Valuation 93.6 72.4 29 72.4 29 274.7 193.7 42 193.7 42 Commercial Mortgage Brokerage 39.2 39.0 1 38.9 1 124.1 108.5 14 108.5 14 Development Services 20.1 - NA 10.2 97 51.1 - NA 25.7 99 Other 23.9 19.3 24 22.8 5 59.3 41.9 42 50.5 17 Total 1,492.8 967.9 54 1,214.3 23 4,197.1 2,622.7 60 3,323.9 26 Three months ended September 30, 2006 Nine months ended September 30, 2006 |
|
|
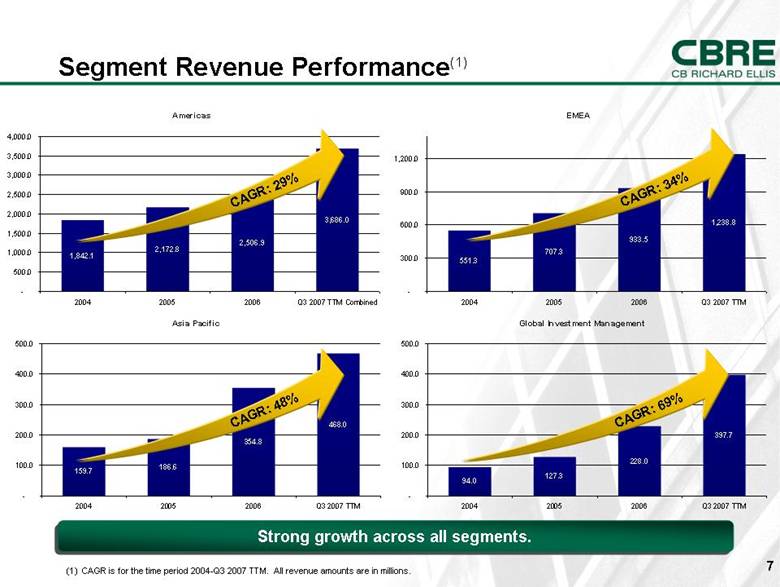
Segment Revenue Performance(1) CAGR: 34% (1) CAGR is for the time period 2004-Q3 2007 TTM. All revenue amounts are in millions. Strong growth across all segments. CAGR: 29% CAGR: 48% CAGR: 69% Global Investment Management 94.0 127.3 228.0 397.7 - 100.0 200.0 300.0 400.0 500.0 2004 2005 2006 Q3 2007 TTM EMEA 551.3 707.3 933.5 1,238.8 - 300.0 600.0 900.0 1,200.0 2004 2005 2006 Q3 2007 TTM Americas 1,842.1 2,172.8 2,506.9 3,686.0 - 500.0 1,000.0 1,500.0 2,000.0 2,500.0 3,000.0 3,500.0 4,000.0 2004 2005 2006 Q3 2007 TTM Combined Asia Pacific 500.0 400.0 300.0 200.0 100.0 2004 2005 2006 Q3 2007 TTM |
|
|
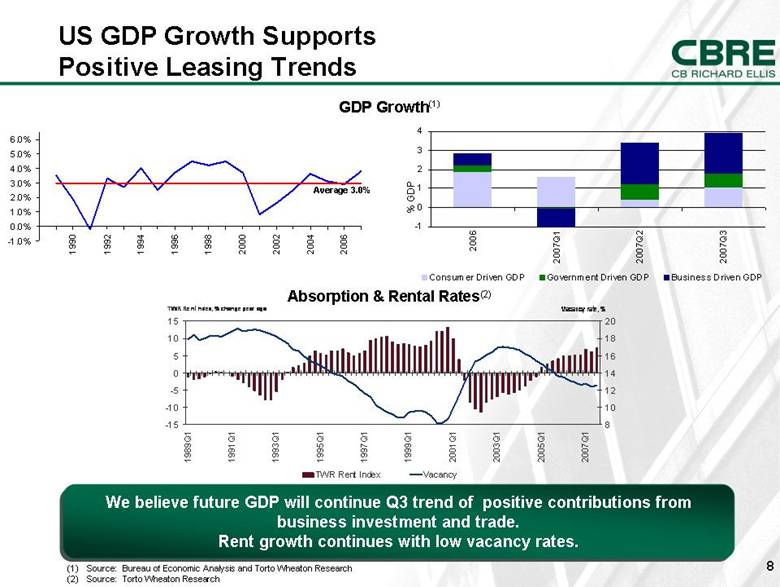
US GDP Growth Supports Positive Leasing Trends GDP Growth(1) (1) Source: Bureau of Economic Analysis and Torto Wheaton Research (2) Source: Torto Wheaton Research We believe future GDP will continue Q3 trend of positive contributions from business investment and trade. Rent growth continues with low vacancy rates. Average 3.0% % GDP Absorption & Rental Rates(2) -1.0% 0.0% 1.0% 2.0% 3.0% 4.0% 5.0% 6.0% 1990 1992 1994 1996 1998 2000 2002 2004 2006 -15 -10 -5 0 5 10 15 1989Q1 1991Q1 1993Q1 1995Q1 1997Q1 1999Q1 2001Q1 2003Q1 2005Q1 2007Q1 8 10 12 14 16 18 20 TWR Rent Index Vacancy TWR Rent Index, % change year ago Vacancy rate, % -1 0 1 2 3 4 2006 2007Q1 2007Q2 2007Q3 Consumer Driven GDP Government Driven GDP Business Driven GDP |
|
|
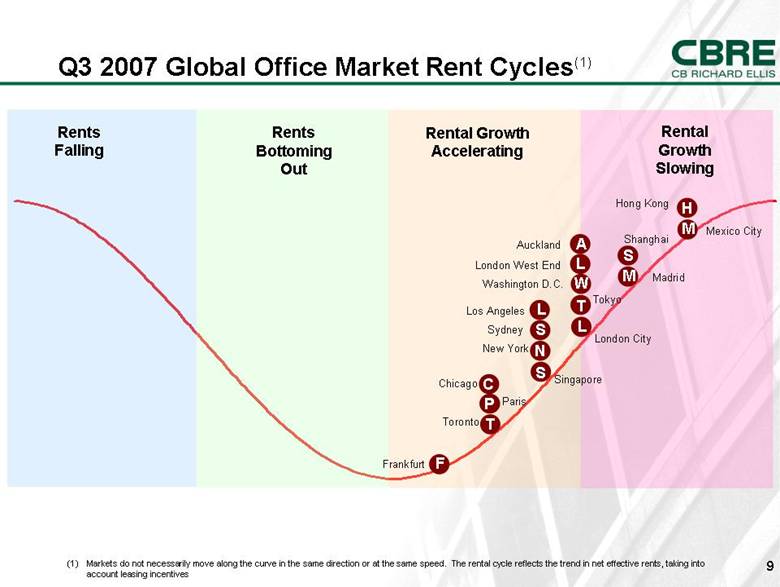
Q3 2007 Global Office Market Rent Cycles(1) Rents Falling Rents Bottoming Out Rental Growth Accelerating Rental Growth Slowing (1) Markets do not necessarily move along the curve in the same direction or at the same speed. The rental cycle reflects the trend in net effective rents, taking into account leasing incentives Madrid L London City M Frankfurt F Paris S London West End L Shanghai S Hong Kong H Singapore P N Washington D.C. S Los Angeles L New York M C Chicago A Auckland Sydney T Toronto Mexico City Tokyo T W |
|
|
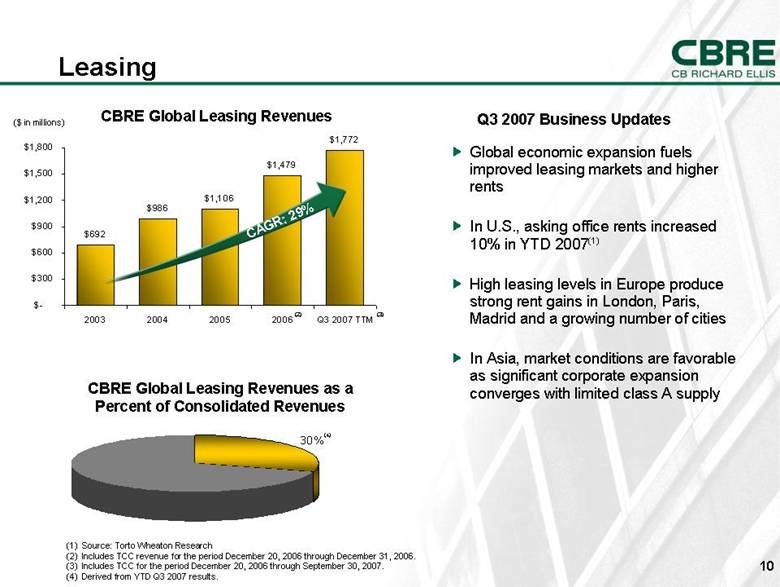
Leasing Global economic expansion fuels improved leasing markets and higher rents In U.S., asking office rents increased 10% in YTD 2007(1) High leasing levels in Europe produce strong rent gains in London, Paris, Madrid and a growing number of cities In Asia, market conditions are favorable as significant corporate expansion converges with limited class A supply (1) Source: Torto Wheaton Research (2) Includes TCC revenue for the period December 20, 2006 through December 31, 2006. (3) Includes TCC for the period December 20, 2006 through September 30, 2007. (4) Derived from YTD Q3 2007 results. CAGR: 29% CBRE Global Leasing Revenues ($ in millions) (2) (3) (4) CBRE Global Leasing Revenues as a Percent of Consolidated Revenues Q3 2007 Business Updates 30% $692 $986 $1,106 $1,479 $1,772 $- $300 $600 $900 $1,200 $1,500 $1,800 2003 2004 2005 2006 Q3 2007 TTM |
|
|
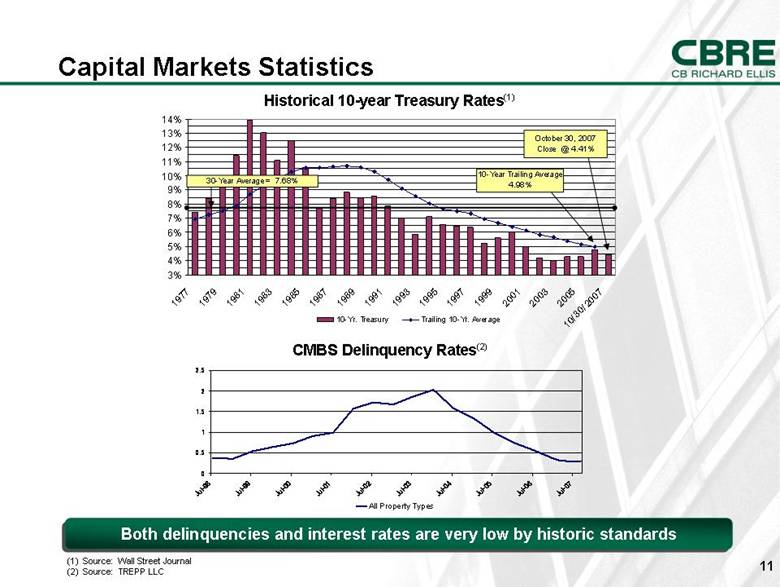
Capital Markets Statistics Historical 10-year Treasury Rates(1) CMBS Delinquency Rates(2) Both delinquencies and interest rates are very low by historic standards (1) Source: Wall Street Journal (2) Source: TREPP LLC 3% 4% 5% 6% 7% 8% 9% 10% 11% 12% 13% 14% 1977 1979 1981 1983 1985 1987 1989 1991 1993 1995 1997 1999 2001 2003 2005 10/30/2007 10-Yr. Treasury Trailing 10-Yr. Average October 30, 2007 Close @ 4.41% 30-Year Average = 7.68% 10-Year Trailing Average 4.98% |
|
|
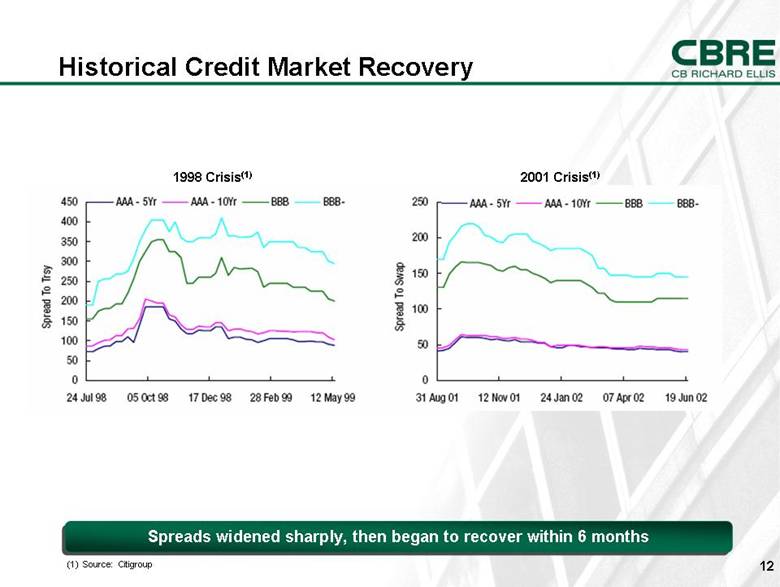
Historical Credit Market Recovery (1) Source: Citigroup Spreads widened sharply, then began to recover within 6 months 1998 Crisis(1) 2001 Crisis(1) |
|
|
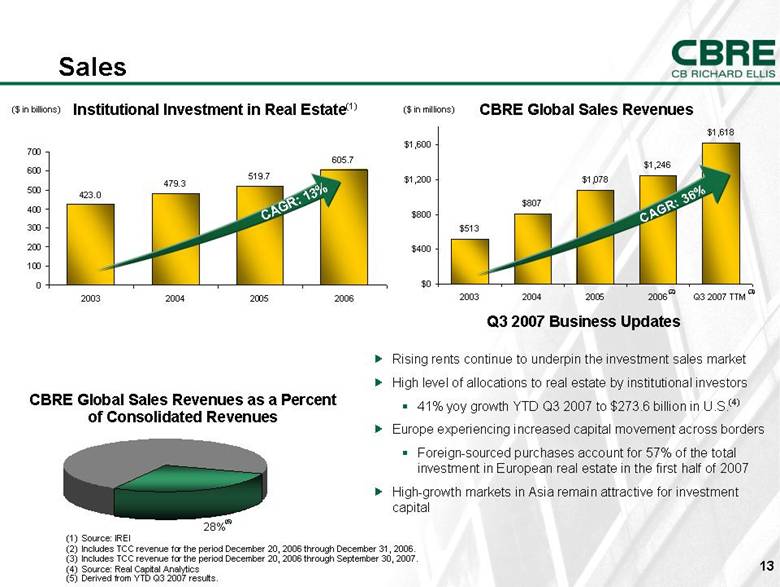
(1) Source: IREI (2) Includes TCC revenue for the period December 20, 2006 through December 31, 2006. (3) Includes TCC revenue for the period December 20, 2006 through September 30, 2007. (4) Source: Real Capital Analytics (5) Derived from YTD Q3 2007 results. Sales Rising rents continue to underpin the investment sales market High level of allocations to real estate by institutional investors 41% yoy growth YTD Q3 2007 to $273.6 billion in U.S.(4) Europe experiencing increased capital movement across borders Foreign-sourced purchases account for 57% of the total investment in European real estate in the first half of 2007 High-growth markets in Asia remain attractive for investment capital ($ in billions) CAGR: 13% CAGR: 36% ($ in millions) CBRE Global Sales Revenues Institutional Investment in Real Estate(1) (2) (3) (4) (5) CBRE Global Sales Revenues as a Percent of Consolidated Revenues Q3 2007 Business Updates $513 $807 $1,078 $1,246 $1,618 $0 $400 $800 $1,200 $1,600 2003 2004 2005 2006 Q3 2007 TTM 423.0 479.3 519.7 605.7 0 100 200 300 400 500 600 700 2003 2004 2005 2006 28% |
|
|
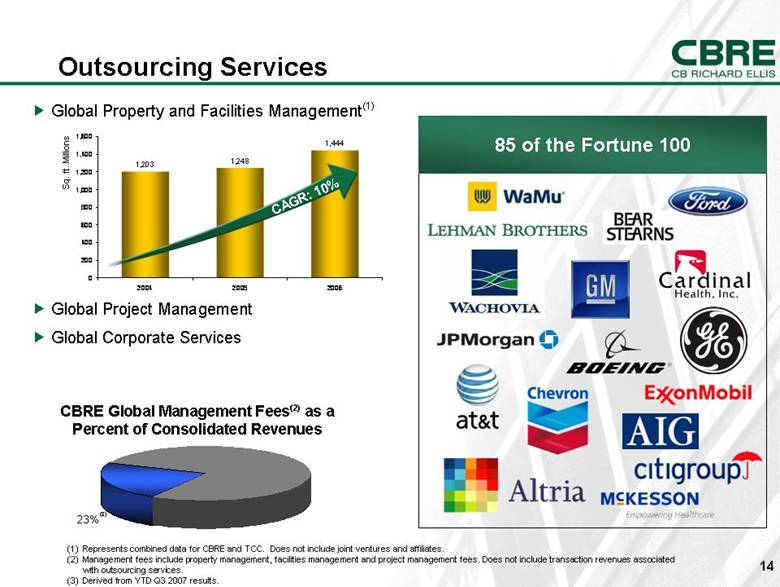
Outsourcing Services 85 of the Fortune 100 Sq. ft. Millions CAGR: 10% Global Property and Facilities Management(1) Global Project Management Global Corporate Services (1) Represents combined data for CBRE and TCC. Does not include joint ventures and affiliates. (2) Management fees include property management, facilities management and project management fees. Does not include transaction revenues associated with outsourcing services. (3) Derived from YTD Q3 2007 results. (3) CBRE Global Management Fees(2) as a Percent of Consolidated Revenues 23% |
|
|
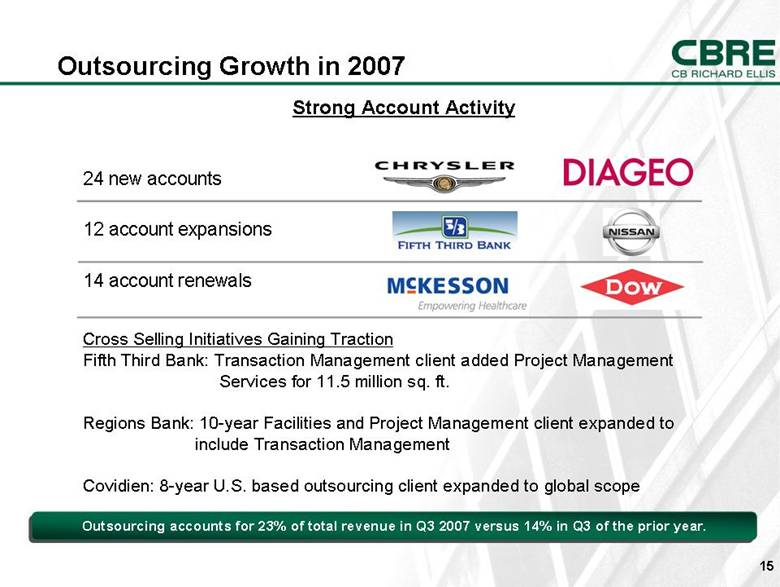
Outsourcing Growth in 2007 Strong Account Activity 24 new accounts 12 account expansions 14 account renewals Cross Selling Initiatives Gaining Traction Fifth Third Bank: Transaction Management client added Project Management Services for 11.5 million sq. ft. Regions Bank: 10-year Facilities and Project Management client expanded to include Transaction Management Covidien: 8-year U.S. based outsourcing client expanded to global scope Outsourcing accounts for 23% of total revenue in Q3 2007 versus 14% in Q3 of the prior year. |
|
|
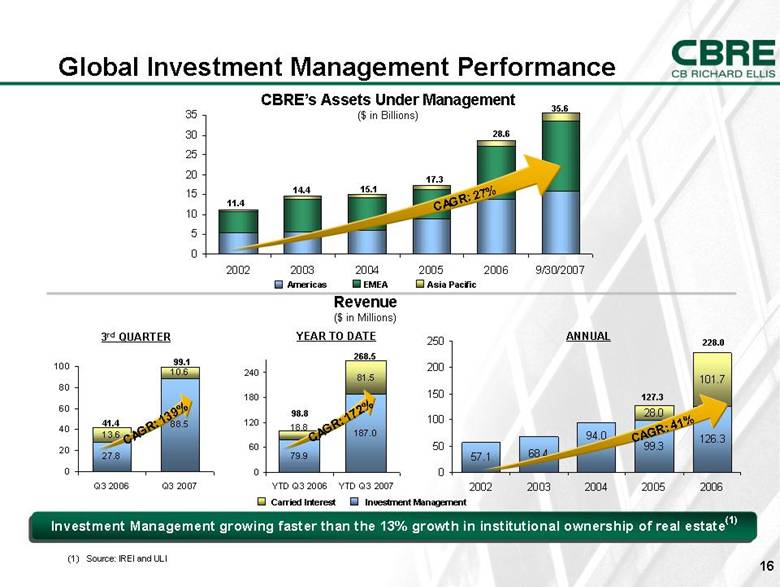
99.1 41.4 Global Investment Management Performance Americas EMEA Asia Pacific Investment Management growing faster than the 13% growth in institutional ownership of real estate(1) CBRE’s Assets Under Management ($ in Billions) Revenue ($ in Millions) (1) Source: IREI and ULI CAGR: 41% 127.3 228.0 CAGR: 27% Carried Interest Investment Management 17.3 28.6 15.1 11.4 14.4 ANNUAL 35.6 3rd QUARTER YEAR TO DATE CAGR: 172% CAGR: 139% 268.5 98.8 10.6 27.8 88.5 13.6 0 20 40 60 80 100 Q3 2006 Q3 2007 0 5 10 15 20 25 30 35 2002 2003 2004 2005 2006 9/30/2007 57.1 68.4 99.3 126.3 28.0 101.7 94.0 0 50 100 150 200 250 2002 2003 2004 2005 2006 79.9 187.0 81.5 18.8 0 60 120 180 240 YTD Q3 2006 YTD Q3 2007 |
|
|
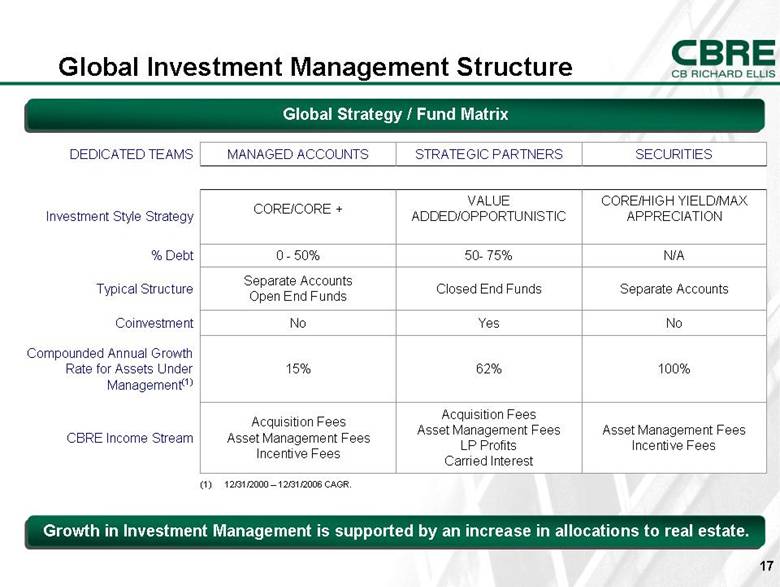
Global Investment Management Structure Global Strategy / Fund Matrix 100% 62% 15% Compounded Annual Growth Rate for Assets Under Management(1) No Yes No Coinvestment Asset Management Fees Incentive Fees Acquisition Fees Asset Management Fees LP Profits Carried Interest Acquisition Fees Asset Management Fees Incentive Fees CBRE Income Stream Separate Accounts Closed End Funds Separate Accounts Open End Funds Typical Structure N/A 50- 75% 0 - 50% % Debt CORE/HIGH YIELD/MAX APPRECIATION VALUE ADDED/OPPORTUNISTIC CORE/CORE + Investment Style Strategy SECURITIES STRATEGIC PARTNERS MANAGED ACCOUNTS DEDICATED TEAMS (1) 12/31/2000 – 12/31/2006 CAGR. Growth in Investment Management is supported by an increase in allocations to real estate. |
|
|
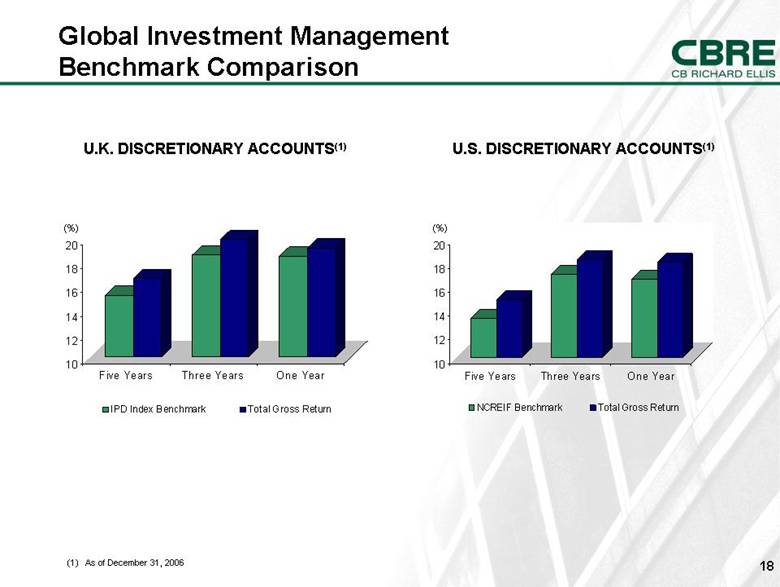
Global Investment Management Benchmark Comparison U.K. DISCRETIONARY ACCOUNTS(1) U.S. DISCRETIONARY ACCOUNTS(1) (1) As of December 31, 2006 (%) (%) 10 12 14 16 18 20 Five Years Three Years One Year NCREIF Benchmark Total Gross Return 10 12 14 16 18 20 Five Years Three Years One Year IPD Index Benchmark Total Gross Return |
|
|
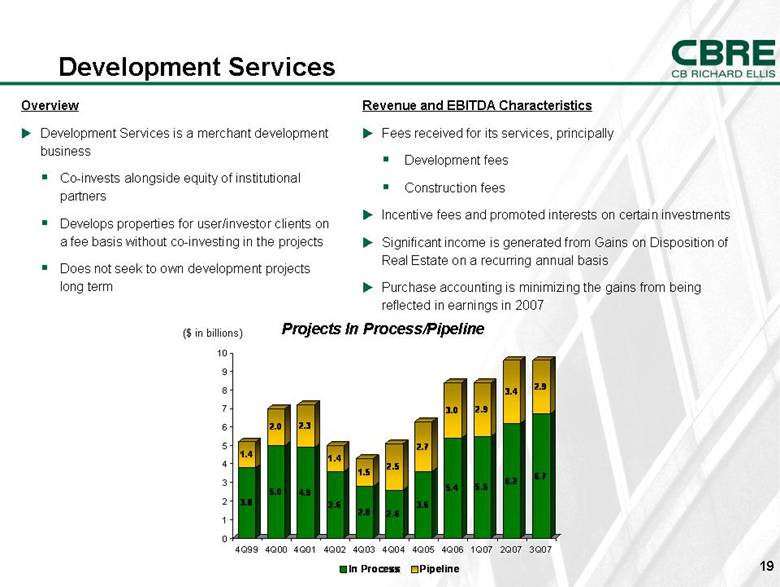
Development Services Overview Development Services is a merchant development business Co-invests alongside equity of institutional partners Develops properties for user/investor clients on a fee basis without co-investing in the projects Does not seek to own development projects long term Revenue and EBITDA Characteristics Fees received for its services, principally Development fees Construction fees Incentive fees and promoted interests on certain investments Significant income is generated from Gains on Disposition of Real Estate on a recurring annual basis Purchase accounting is minimizing the gains from being reflected in earnings in 2007 ($ in billions) Projects In Process/Pipeline 3.8 1.4 5.0 2.0 4.9 2.3 3.6 1.4 2.8 1.5 2.6 2.5 3.6 2.7 5.4 3.0 5.5 2.9 6.2 3.4 6.7 2.9 0 1 2 3 4 5 6 7 8 9 10 4Q99 4Q00 4Q01 4Q02 4Q03 4Q04 4Q05 4Q06 1Q07 2Q07 3Q07 In Process Pipeline |
|
|
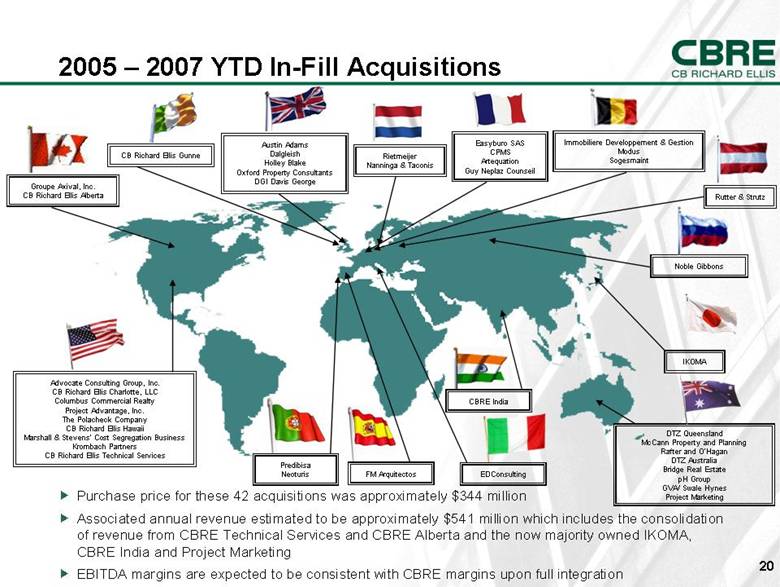
Purchase price for these 42 acquisitions was approximately $344 million Associated annual revenue estimated to be approximately $541 million which includes the consolidation of revenue from CBRE Technical Services and CBRE Alberta and the now majority owned IKOMA, CBRE India and Project Marketing EBITDA margins are expected to be consistent with CBRE margins upon full integration 2005 – 2007 YTD In-Fill Acquisitions Easyburo SAS CPMS Artequation Guy Neplaz Counseil DTZ Queensland McCann Property and Planning Rafter and O’Hagan DTZ Australia Bridge Real Estate pH Group GVA/ Swale Hynes Project Marketing Advocate Consulting Group, Inc. CB Richard Ellis Charlotte, LLC Columbus Commercial Realty Project Advantage, Inc. The Polacheck Company CB Richard Ellis Hawaii Marshall & Stevens’ Cost Segregation Business Krombach Partners CB Richard Ellis Technical Services Rutter & Strutz Groupe Axival, Inc. CB Richard Ellis Alberta Noble Gibbons IKOMA CB Richard Ellis Gunne Austin Adams Dalgleish Holley Blake Oxford Property Consultants DGI Davis George Predibisa Neoturis Rietmeijer Nanninga & Taconis EDConsulting FM Arquitectos Immobiliere Developpement & Gestion Modus Sogesmaint CBRE India |
|
|
Financial Overview |
|
|
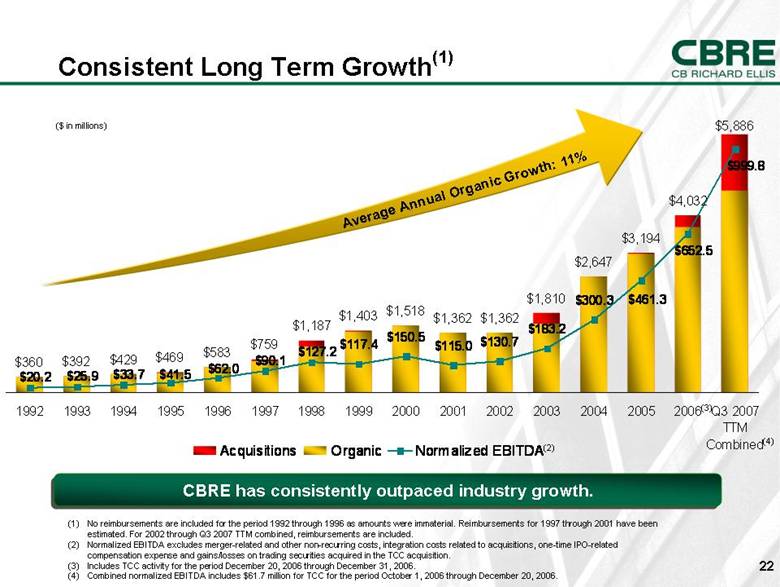
Consistent Long Term Growth(1) CBRE has consistently outpaced industry growth. (1) No reimbursements are included for the period 1992 through 1996 as amounts were immaterial. Reimbursements for 1997 through 2001 have been estimated. For 2002 through Q3 2007 TTM combined, reimbursements are included. (2) Normalized EBITDA excludes merger-related and other non-recurring costs, integration costs related to acquisitions, one-time IPO-related compensation expense and gains/losses on trading securities acquired in the TCC acquisition. Includes (3) TCC activity for the period December 20, 2006 through December 31, 2006. (4) Combined normalized EBITDA includes $61.7 million for TCC for the period October 1, 2006 through December 20, 2006. ($ in millions) Average Annual Organic Growth: 11% (3) (2) (4) $360 $392 $429 $469 $583 $759 $1,187 $1,403 $1,518 $1,362 $1,362 $1,810 $3,194 $4,032 $5,886 $2,647 $117.4 $150.5 $115.0 $130.7 $183.2 $300.3 $461.3 $127.2 $20.2 $25.9 $33.7 $41.5 $62.0 $90.1 $652.5 $999.8 1992 1993 1994 1995 1996 1997 1998 1999 2000 2001 2002 2003 2004 2005 2006 Q3 2007 TTM Combined Acquisitions Organic Normalized EBITDA |
|
|
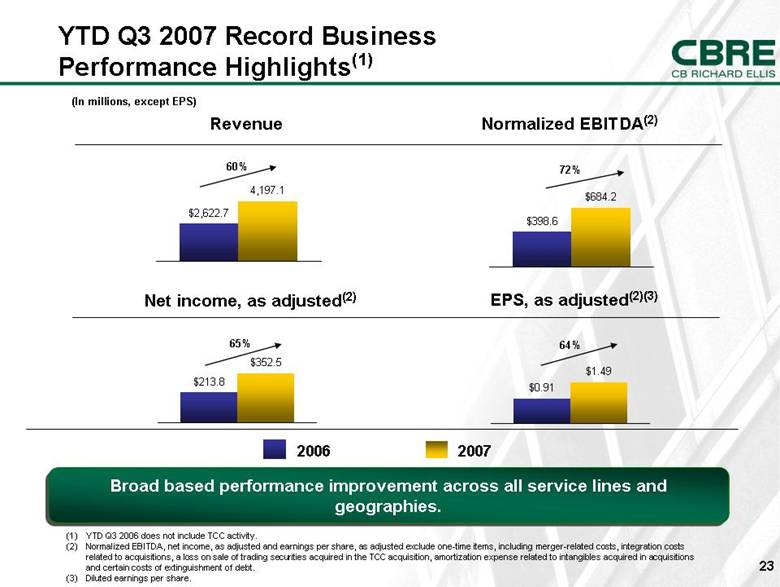
YTD Q3 2007 Record Business Performance Highlights(1) 2006 2007 60% (In millions, except EPS) 72% Revenue Normalized EBITDA(2) 65% 64% Net income, as adjusted(2) EPS, as adjusted(2)(3) (1) YTD Q3 2006 does not include TCC activity. (2) Normalized EBITDA, net income, as adjusted and earnings per share, as adjusted exclude one-time items, including merger-related costs, integration costs related to acquisitions, a loss on sale of trading securities acquired in the TCC acquisition, amortization expense related to intangibles acquired in acquisitions and certain costs of extinguishment of debt. (3) Diluted earnings per share. Broad based performance improvement across all service lines and geographies. $0.91 $1.49 $684.2 $398.6 $352.5 $213.8 4,197.1 $2,622.7 |
|
|
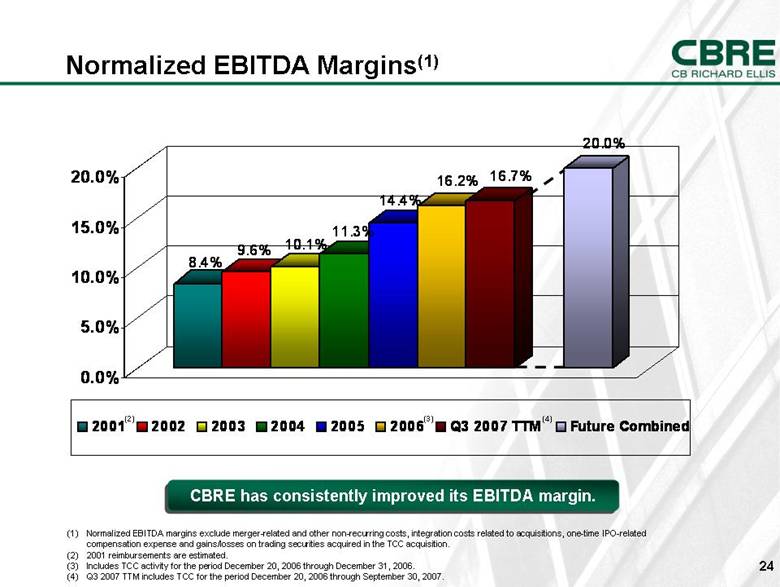
Normalized EBITDA Margins(1) CBRE has consistently improved its EBITDA margin. (1) Normalized EBITDA margins exclude merger-related and other non-recurring costs, integration costs related to acquisitions, one-time IPO-related compensation expense and gains/losses on trading securities acquired in the TCC acquisition. (2) 2001 reimbursements are estimated. (3) Includes TCC activity for the period December 20, 2006 through December 31, 2006. (4) Q3 2007 TTM includes TCC for the period December 20, 2006 through September 30, 2007. (2) (3) (4) 8.4% 9.6% 10.1% 11.3% 14.4% 16.2% 16.7% 20.0% 0.0% 5.0% 10.0% 15.0% 20.0% 2001 2002 2003 2004 2005 2006 Q3 2007 TTM Future Combined |
|
|
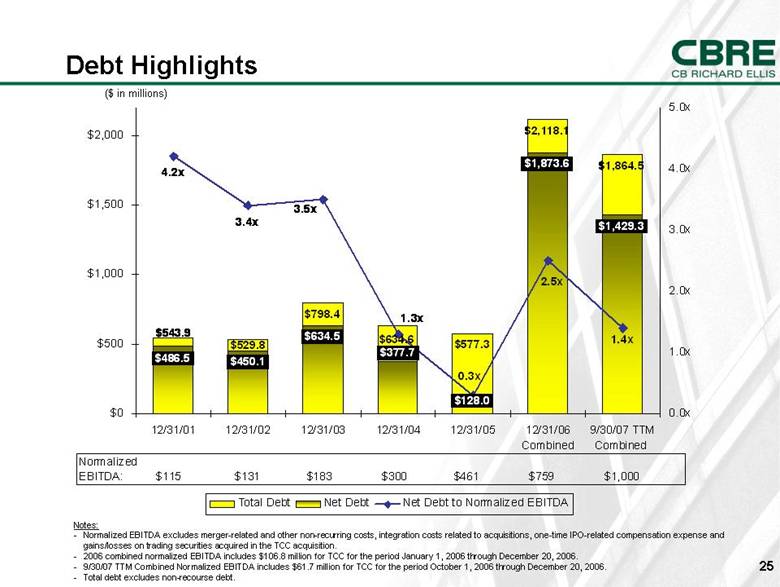
($ in millions) Debt Highlights Notes: Normalized EBITDA excludes merger-related and other non-recurring costs, integration costs related to acquisitions, one-time IPO-related compensation expense and gains/losses on trading securities acquired in the TCC acquisition. 2006 combined normalized EBITDA includes $106.8 million for TCC for the period January 1, 2006 through December 20, 2006. 9/30/07 TTM Combined Normalized EBITDA includes $61.7 million for TCC for the period October 1, 2006 through December 20, 2006. Total debt excludes non-recourse debt. $798.4 $577.3 $2,118.1 $1,864.5 $450.1 $634.5 $128.0 $1,873.6 $1,429.3 $634.6 $543.9 $529.8 $377.7 $486.5 4.2x 3.4x 2.5x 1.4x 1.3x 0.3x 3.5x $0 $500 $1,000 $1,500 $2,000 12/31/01 12/31/02 12/31/03 12/31/04 12/31/05 12/31/06 Combined 9/30/07 TTM Combined 0.0x 1.0x 2.0x 3.0x 4.0x 5.0x Total Debt Net Debt Net Debt to Normalized EBITDA Normalized EBITDA: $115 $131 $183 $300 $461 $759 $1,000 |
|
|
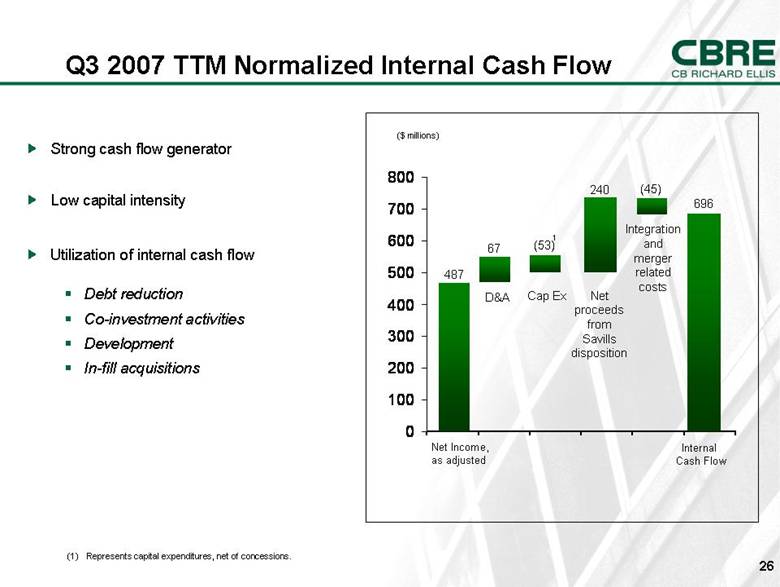
Q3 2007 TTM Normalized Internal Cash Flow Strong cash flow generator Low capital intensity Utilization of internal cash flow Debt reduction Co-investment activities Development In-fill acquisitions (1) Represents capital expenditures, net of concessions. ($ millions) 487 Net Income, as adjusted D&A Cap Ex (53) 696 Internal Cash Flow 1 67 240 (45) Net proceeds from Savills disposition Integration and merger related costs 0 100 200 300 400 500 600 700 800 |
|
|
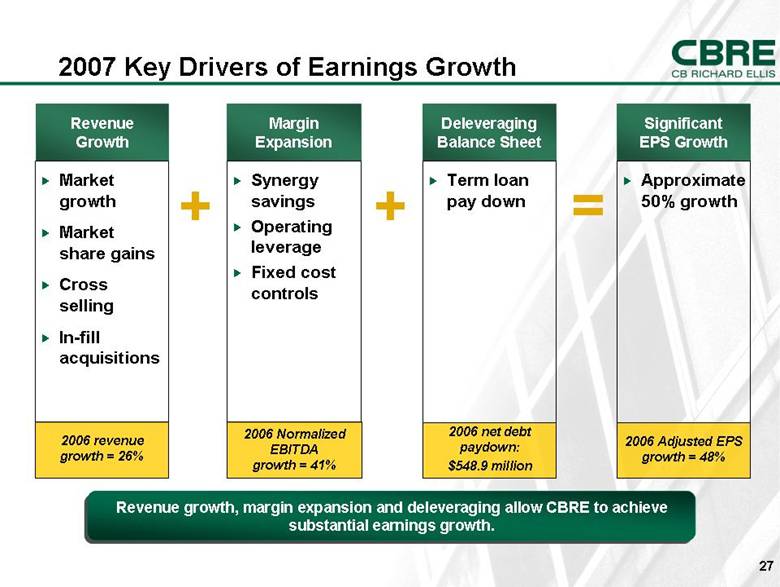
2007 Key Drivers of Earnings Growth Revenue Growth Margin Expansion Market growth Market share gains Cross selling In-fill acquisitions Synergy savings Operating leverage Fixed cost controls Deleveraging Balance Sheet Term loan pay down Revenue growth, margin expansion and deleveraging allow CBRE to achieve substantial earnings growth. = + + Significant EPS Growth Approximate 50% growth 2006 revenue growth = 26% 2006 Normalized EBITDA growth = 41% 2006 net debt paydown: $548.9 million 2006 Adjusted EPS growth = 48% |
|
|
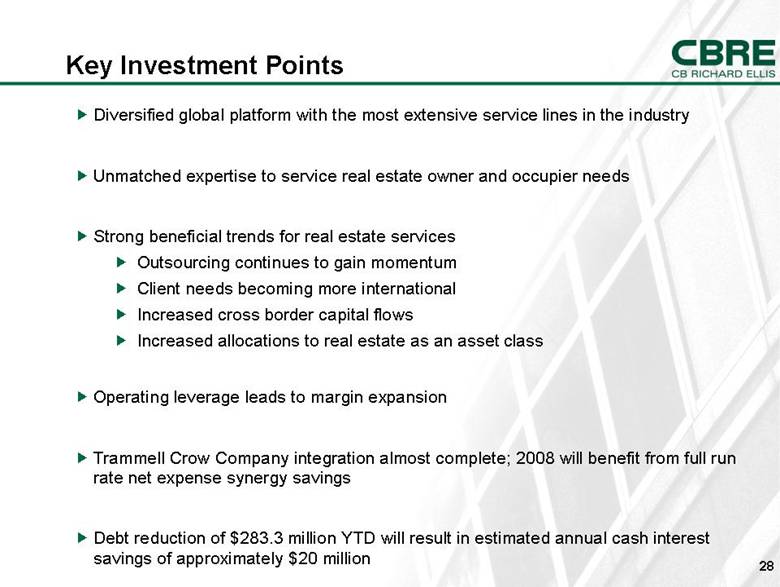
Diversified global platform with the most extensive service lines in the industry Unmatched expertise to service real estate owner and occupier needs Strong beneficial trends for real estate services Outsourcing continues to gain momentum Client needs becoming more international Increased cross border capital flows Increased allocations to real estate as an asset class Operating leverage leads to margin expansion Trammell Crow Company integration almost complete; 2008 will benefit from full run rate net expense synergy savings Debt reduction of $283.3 million YTD will result in estimated annual cash interest savings of approximately $20 million Key Investment Points |
|
|
Appendix |
|
|
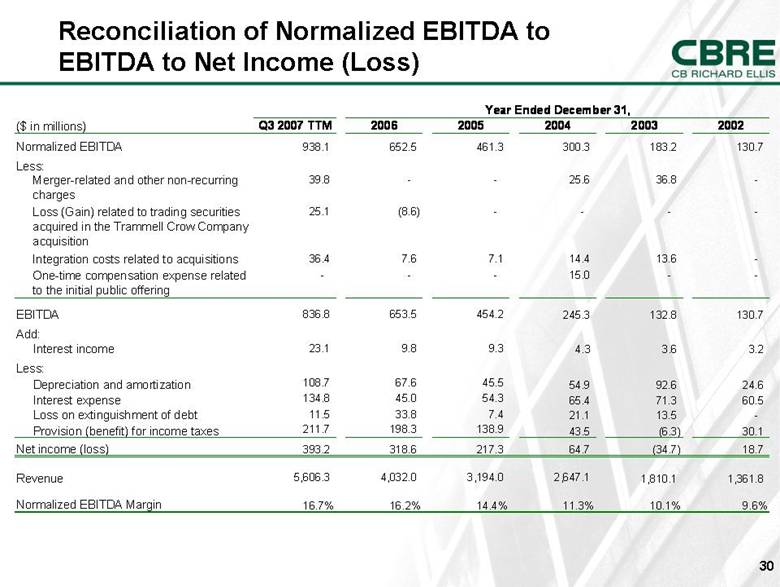
Reconciliation of Normalized EBITDA to EBITDA to Net Income (Loss) ($ in millions) Q3 2007 TTM 2006 2005 2004 2003 2002 Normalized EBITDA 938.1 652.5 461.3 300.3 183.2 130.7 Less: Merger-related and other non-recurring charges 39.8 - - 25.6 36.8 - Loss (Gain) related to trading securities acquired in the Trammell Crow Company acquisition 25.1 (8.6) - - - - Integration costs related to acquisitions 36.4 7.6 7.1 14.4 13.6 - One-time compensation expense related to the initial public offering - - - 15.0 - - EBITDA 836.8 653.5 454.2 245.3 132.8 130.7 Add: 23.1 9.8 9.3 4.3 3.6 3.2 Less: 108.7 67.6 45.5 54.9 92.6 24.6 134.8 45.0 54.3 65.4 71.3 60.5 11.5 33.8 7.4 21.1 13.5 - 211.7 198.3 138.9 43.5 (6.3) 30.1 Net income (loss) 393.2 318.6 217.3 64.7 (34.7) 18.7 Revenue 5,606.3 4,032.0 3,194.0 2,647.1 1,810.1 1,361.8 Normalized EBITDA Margin 16.7% 16.2% 14.4% 11.3% 10.1% 9.6% Year Ended December 31, Provision (benefit) for income taxes Loss on extinguishment of debt Interest expense Depreciation and amortization Interest income |
|
|
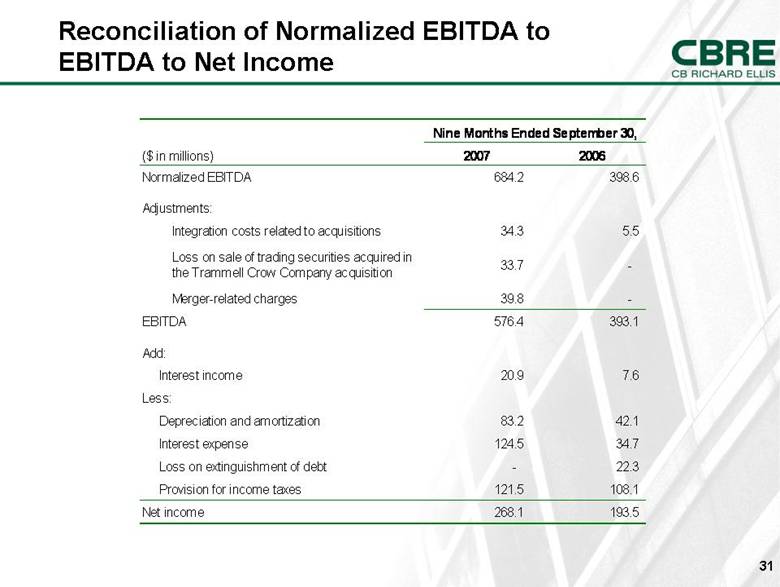
Reconciliation of Normalized EBITDA to EBITDA to Net Income Nine Months Ended September 30, ($ in millions) 2007 2006 Normalized EBITDA 684.2 398.6 Adjustments: Integration costs related to acquisitions 34.3 5.5 Loss on sale of trading securities acquired in the Trammell Crow Company acquisition 33.7 - Merger-related charges 39.8 - EBITDA 576.4 393.1 Add: 20.9 7.6 Less: 83.2 42.1 124.5 34.7 - 22.3 121.5 108.1 Net income 268.1 193.5 Provision for income taxes Loss on extinguishment of debt Interest expense Depreciation and amortization Interest income |
|
|
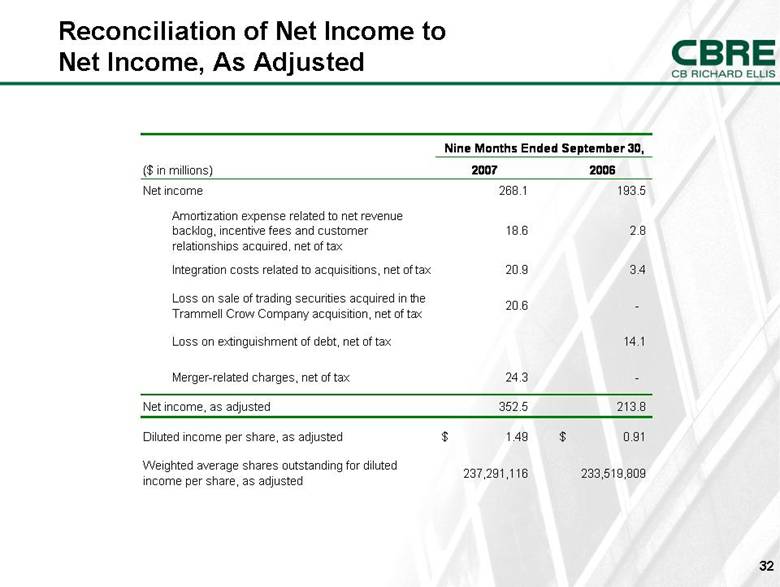
Reconciliation of Net Income to Net Income, As Adjusted ($ in millions) 2007 2006 Net income 268.1 193.5 Amortization expense related to net revenue backlog, incentive fees and customer relationships acquired, net of tax 18.6 2.8 Integration costs related to acquisitions, net of tax 20.9 3.4 Loss on sale of trading securities acquired in the Trammell Crow Company acquisition, net of tax 20.6 - Loss on extinguishment of debt, net of tax 14.1 Merger-related charges, net of tax 24.3 - Net income, as adjusted 352.5 213.8 Diluted income per share, as adjusted 1.49 $ 0.91 $ Weighted average shares outstanding for diluted income per share, as adjusted 237,291,116 233,519,809 Nine Months Ended September 30, |
|
|
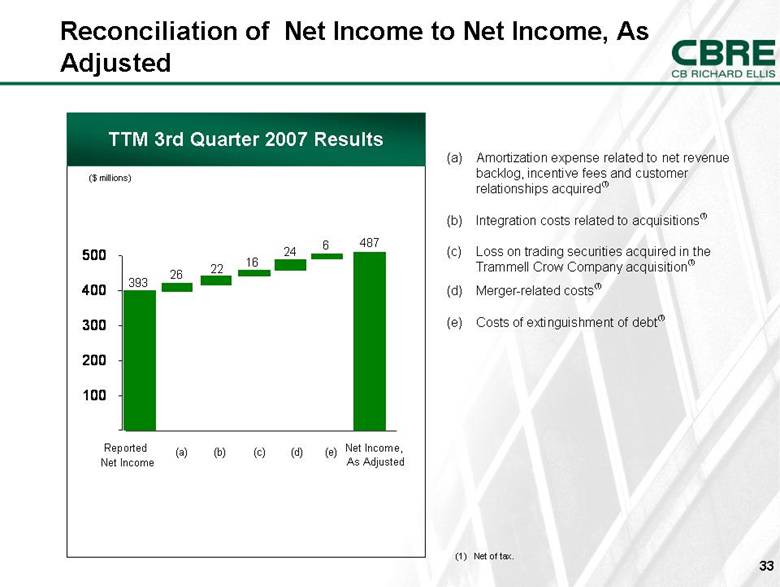
(a) Amortization expense related to net revenue backlog, incentive fees and customer relationships acquired(1) (b) Integration costs related to acquisitions(1) (c) Loss on trading securities acquired in the Trammell Crow Company acquisition(1) (d) Merger-related costs(1) (e) Costs of extinguishment of debt(1) Reconciliation of Net Income to Net Income, As Adjusted TTM 3rd Quarter 2007 Results ($ millions) (1) Net of tax. Net Income, As Adjusted 393 487 26 22 Reported Net Income (a) (b) (c) 16 24 (d) 6 (e) - 100 200 300 400 500 |
|
|
|