Exhibit 99.2
|
|
CB Richard Ellis Group, Inc. Third Quarter 2007 Earnings Conference Call October 30, 2007 |
Exhibit 99.2
|
|
CB Richard Ellis Group, Inc. Third Quarter 2007 Earnings Conference Call October 30, 2007 |
|
|
Forward Looking Statements This presentation contains statements that are forward looking within the meaning of the Private Securities Litigation Reform Act of 1995, including statements regarding our growth momentum in 2007, future operations, the impact of acquisitions and future financial performance. These statements should be considered as estimates only and actual results may ultimately differ from these estimates. Except to the extent required by applicable securities laws, we undertake no obligation to update or publicly revise any of the forward-looking statements that you may hear today. Please refer to our current annual report on Form 10-K (in particular, Risk Factors) and our current quarterly report on Form 10-Q, which are filed with the SEC and available at the SEC’s website (http://www.sec.gov), for a full discussion of the risks and other factors that may impact any estimates that you may hear today. We may make certain statements during the course of this presentation which include references to “non-GAAP financial measures,” as defined by SEC regulations. As required by these regulations, we have provided reconciliations of these measures to what we believe are the most directly comparable GAAP measures, which are attached hereto within the appendix. |
|
|
Conference Call Participants Brett White, President and Chief Executive Officer Kenneth J. Kay, Senior Executive Vice President & Chief Financial Officer Ray Torto Principal & Chief Strategist, CBRE Torto Wheaton Research Nick Kormeluk, Senior Vice President, Investor Relations |
|
|
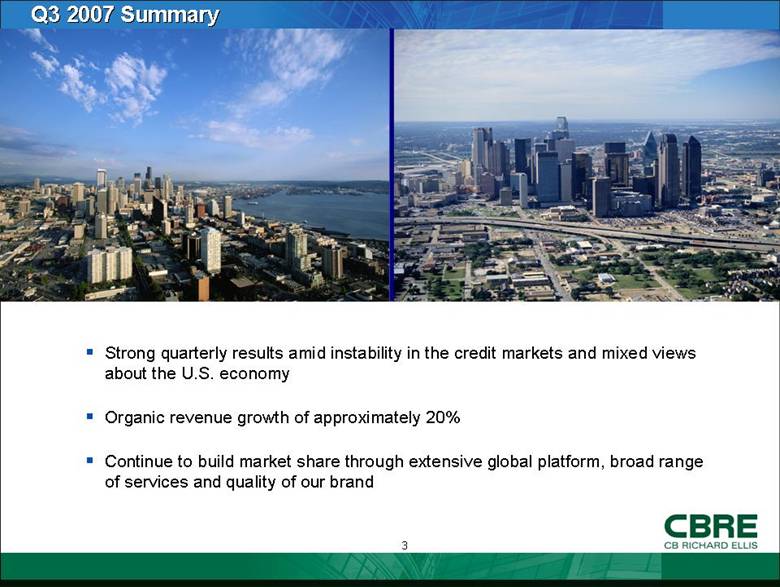
Q3 2007 Summary Strong quarterly results amid instability in the credit markets and mixed views about the U.S. economy Organic revenue growth of approximately 20% Continue to build market share through extensive global platform, broad range of services and quality of our brand |
|
|
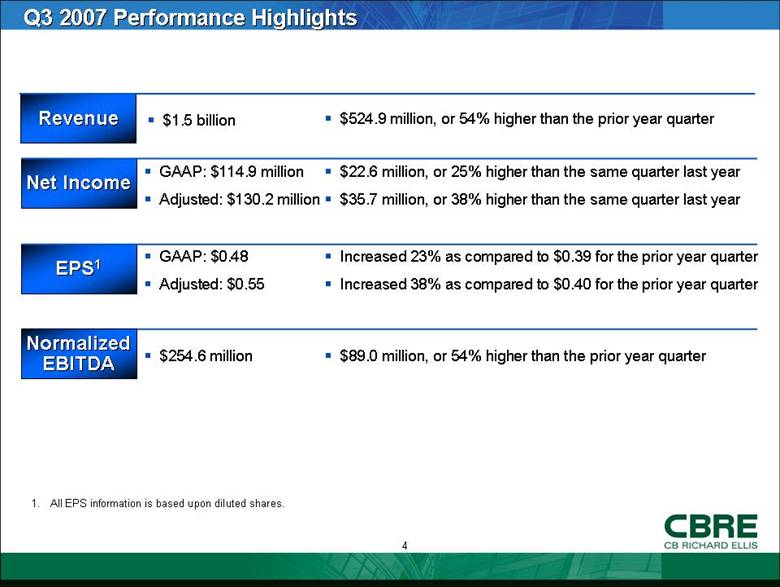
Q3 2007 Performance Highlights Revenue $1.5 billion $524.9 million, or 54% higher than the prior year quarter $22.6 million, or 25% higher than the same quarter last year $35.7 million, or 38% higher than the same quarter last year GAAP: $114.9 million Adjusted: $130.2 million Increased 23% as compared to $0.39 for the prior year quarter Increased 38% as compared to $0.40 for the prior year quarter GAAP: $0.48 Adjusted: $0.55 $89.0 million, or 54% higher than the prior year quarter $254.6 million Net Income EPS1 NormalizedEBITDA 1. All EPS information is based upon diluted shares. |
|
|
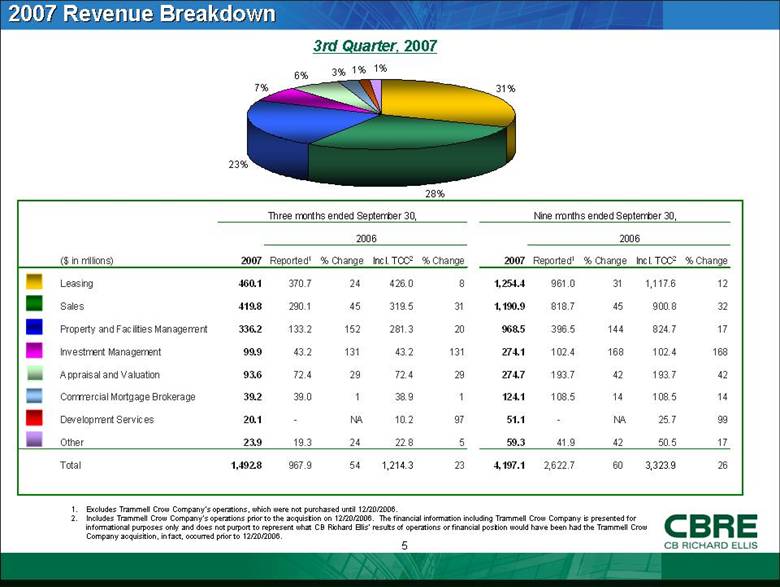
2007 Revenue Breakdown 3rd Quarter, 2007 Excludes Trammell Crow Company’s operations, which were not purchased until 12/20/2006. Includes Trammell Crow Company’s operations prior to the acquisition on 12/20/2006. The financial information including Trammell Crow Company is presented for informational purposes only and does not purport to represent what CB Richard Ellis’ results of operations or financial position would have been had the Trammell Crow Company acquisition, in fact, occurred prior to 12/20/2006. ($ in millions) 2007 Reported 1 % Change Incl. TCC 2 % Change 2007 Reported 1 % Change Incl. TCC 2 % Change Leasing 460.1 370.7 24 426.0 8 1,254.4 961.0 31 1,117.6 12 Sales 419.8 290.1 45 319.5 31 1,190.9 818.7 45 900.8 32 Property and Facilities Management 336.2 133.2 152 281.3 20 968.5 396.5 144 824.7 17 Investment Management 99.9 43.2 131 43.2 131 274.1 102.4 168 102.4 168 Appraisal and Valuation 93.6 72.4 29 72.4 29 274.7 193.7 42 193.7 42 Commercial Mortgage Brokerage 39.2 39.0 1 38.9 1 124.1 108.5 14 108.5 14 Development Services 20.1 - NA 10.2 97 51.1 - NA 25.7 99 Other 23.9 19.3 24 22.8 5 59.3 41.9 42 50.5 17 Total 1,492.8 967.9 54 1,214.3 23 4,197.1 2,622.7 60 3,323.9 26 Three months ended September 30, 2006 Nine months ended September 30, 2006 31% 28% 23% 7% 6% 3% 1% 1% |
|
|
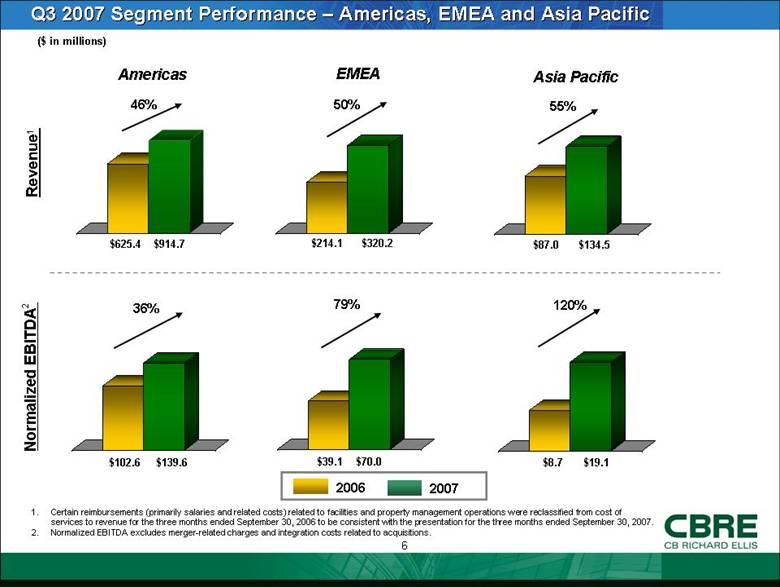
Q3 2007 Segment Performance – Americas, EMEA and Asia Pacific $914.7 ($ in millions) Revenue1 Normalized EBITDA2 Americas EMEA Asia Pacific $625.4 $320.2 $214.1 $134.5 $87.0 $139.6 $102.6 $70.0 $39.1 $19.1 $8.7 46% 50% 55% 36% 79% 2007 2006 120% Certain reimbursements (primarily salaries and related costs) related to facilities and property management operations were reclassified from cost of services to revenue for the three months ended September 30, 2006 to be consistent with the presentation for the three months ended September 30, 2007. Normalized EBITDA excludes merger-related charges and integration costs related to acquisitions. |
|
|
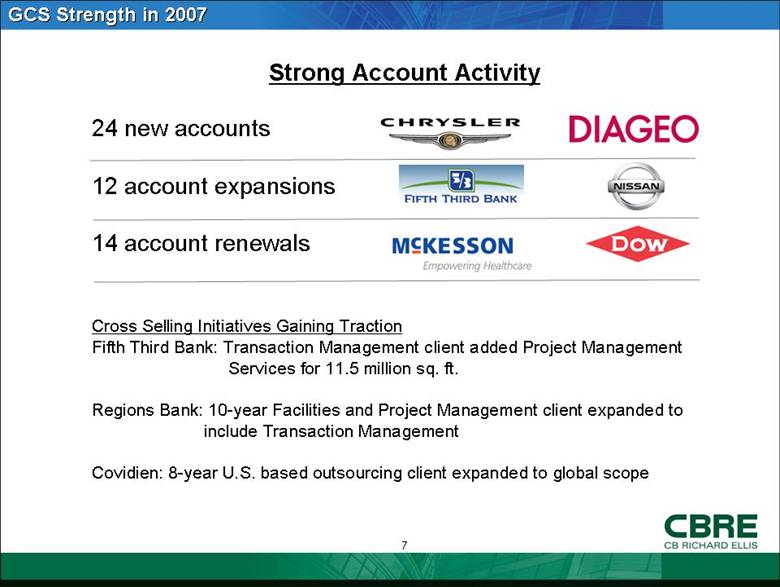
GCS Strength in 2007 Strong Account Activity 24 new accounts 12 account expansions 14 account renewals Cross Selling Initiatives Gaining Traction Fifth Third Bank: Transaction Management client added Project Management Services for 11.5 million sq. ft. Regions Bank: 10-year Facilities and Project Management client expanded to include Transaction Management Covidien: 8-year U.S. based outsourcing client expanded to global scope |
|
|
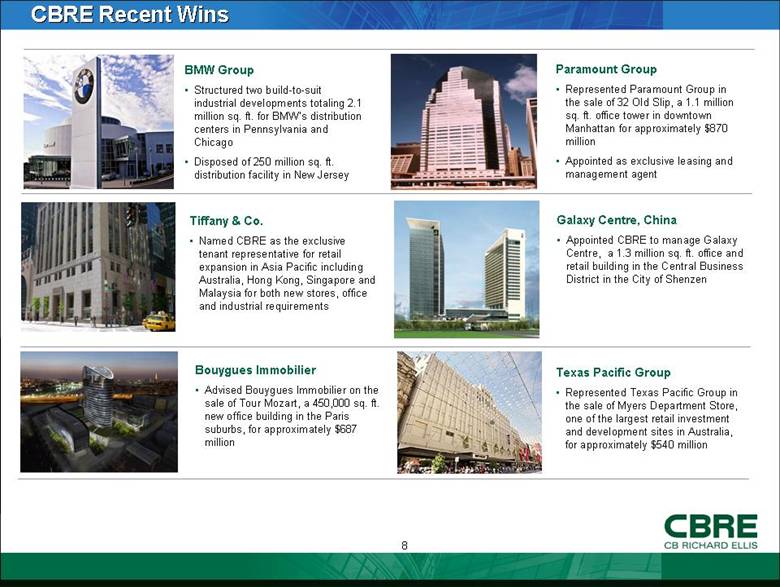
CBRE Recent Wins Tiffany & Co. Named CBRE as the exclusive tenant representative for retail expansion in Asia Pacific including Australia, Hong Kong, Singapore and Malaysia for both new stores, office and industrial requirements Paramount Group Represented Paramount Group in the sale of 32 Old Slip, a 1.1 million sq. ft. office tower in downtown Manhattan for approximately $870 million Appointed as exclusive leasing and management agent BMW Group Structured two build-to-suit industrial developments totaling 2.1 million sq. ft. for BMW’s distribution centers in Pennsylvania and Chicago Disposed of 250 million sq. ft. distribution facility in New Jersey Galaxy Centre, China Appointed CBRE to manage Galaxy Centre, a 1.3 million sq. ft. office and retail building in the Central Business District in the City of Shenzen Texas Pacific Group Represented Texas Pacific Group in the sale of Myers Department Store, one of the largest retail investment and development sites in Australia, for approximately $540 million Bouygues Immobilier Advised Bouygues Immobilier on the sale of Tour Mozart, a 450,000 sq. ft. new office building in the Paris suburbs, for approximately $687 million |
|
|
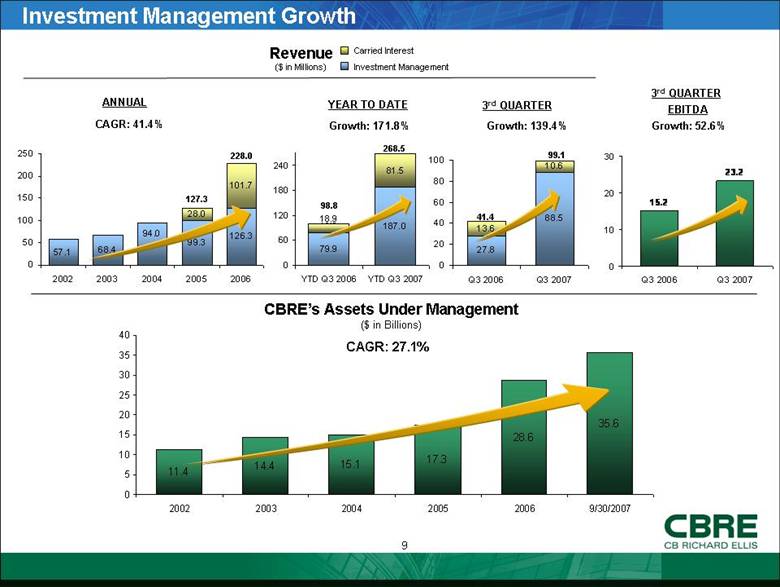
Investment Management Growth Revenue ($ in Millions) CAGR: 41.4% Growth: 139.4% ANNUAL 3rd QUARTER Carried Interest Investment Management CAGR: 27.1% CBRE’s Assets Under Management ($ in Billions) 99.1 41.4 228.0 Growth: 171.8% YEAR TO DATE 268.5 3rd QUARTER EBITDA Growth: 52.6% 98.8 127.3 18.9 11.4 14.4 15.1 17.3 28.6 35.6 0 5 10 15 20 25 30 35 40 2002 2003 2004 2005 2006 9/30/2007 79.9 187.0 81.5 18.8 0 60 120 180 240 YTD Q3 2006 YTD Q3 2007 15.2 23.2 0 10 20 30 Q3 2006 Q3 2007 10.6 27.8 88.5 13.6 0 20 40 60 80 100 Q3 2006 Q3 2007 |
|
|
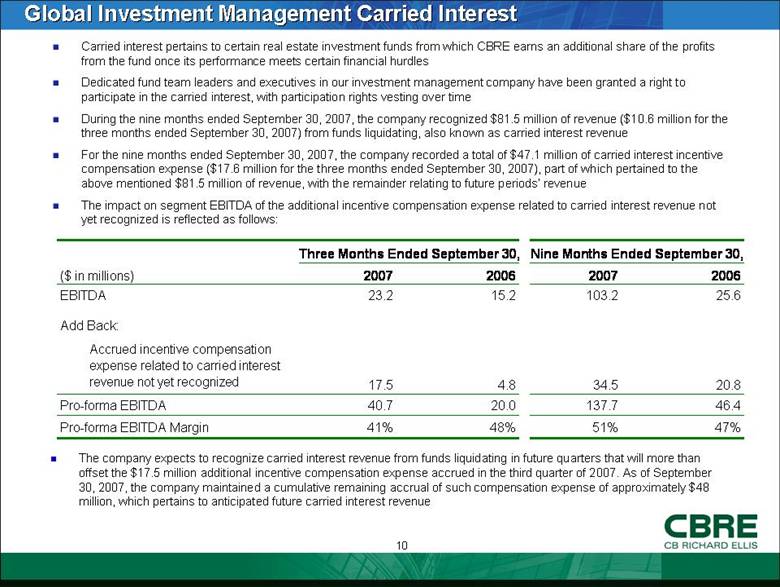
Global Investment Management Carried Interest Carried interest pertains to certain real estate investment funds from which CBRE earns an additional share of the profits from the fund once its performance meets certain financial hurdles Dedicated fund team leaders and executives in our investment management company have been granted a right to participate in the carried interest, with participation rights vesting over time During the nine months ended September 30, 2007, the company recognized $81.5 million of revenue ($10.6 million for the three months ended September 30, 2007) from funds liquidating, also known as carried interest revenue For the nine months ended September 30, 2007, the company recorded a total of $47.1 million of carried interest incentive compensation expense ($17.6 million for the three months ended September 30, 2007), part of which pertained to the above mentioned $81.5 million of revenue, with the remainder relating to future periods’ revenue The impact on segment EBITDA of the additional incentive compensation expense related to carried interest revenue not yet recognized is reflected as follows: The company expects to recognize carried interest revenue from funds liquidating in future quarters that will more than offset the $17.5 million additional incentive compensation expense accrued in the third quarter of 2007. As of September 30, 2007, the company maintained a cumulative remaining accrual of such compensation expense of approximately $48 million, which pertains to anticipated future carried interest revenue Three Months Ended September 30, Nine Months Ended September 30, ($ in millions) 2007 2006 2007 2006 EBITDA 23.2 15.2 103.2 25.6 Add Back: Accrued incentive compensation expense related to carried interest revenue not yet recognized 17.5 4.8 34.5 20.8 Pro-forma EBITDA 40.7 20.0 137.7 46.4 Pro-forma EBITDA Margin 41% 48% 51% 47% |
|
|
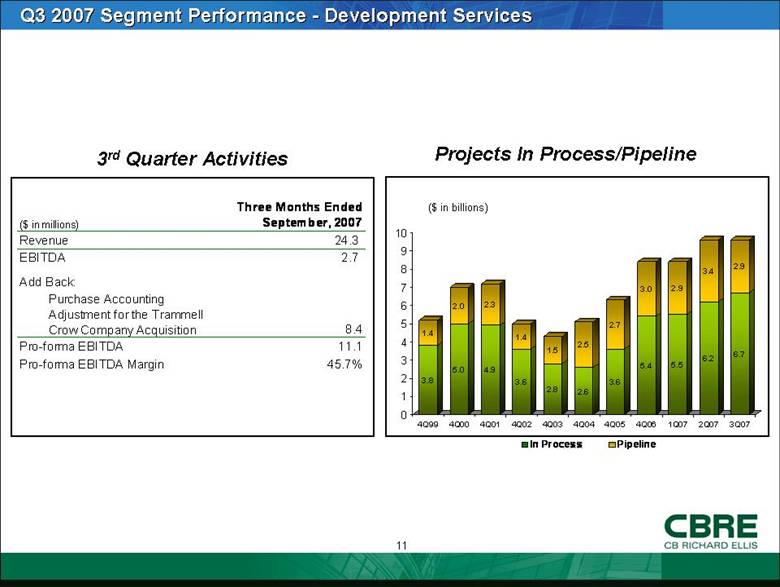
Q3 2007 Segment Performance - Development Services ($ in billions) Projects In Process/Pipeline 3rd Quarter Activities ($ in millions) Three Months Ended September, 2007 Revenue 24.3 EBITDA 2.7 Add Back: Purchase Accounting Adjustment for the Trammell Crow Company Acquisition 8.4 Pro-forma EBITDA 11.1 Pro-forma EBITDA Margin 45.7% 3.8 1.4 5.0 2.0 4.9 2.3 3.6 1.4 2.8 1.5 2.6 2.5 3.6 2.7 5.4 3.0 5.5 2.9 6.2 3.4 6.7 2.9 0 1 2 3 4 5 6 7 8 9 10 4Q99 4Q00 4Q01 4Q02 4Q03 4Q04 4Q05 4Q06 1Q07 2Q07 3Q07 In Process Pipeline |
|
|
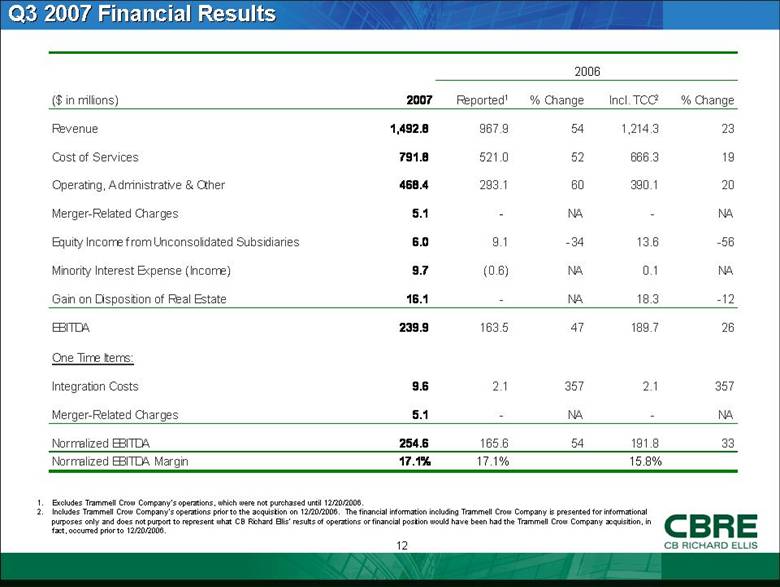
Q3 2007 Financial Results Excludes Trammell Crow Company’s operations, which were not purchased until 12/20/2006. Includes Trammell Crow Company’s operations prior to the acquisition on 12/20/2006. The financial information including Trammell Crow Company is presented for informational purposes only and does not purport to represent what CB Richard Ellis’ results of operations or financial position would have been had the Trammell Crow Company acquisition, in fact, occurred prior to 12/20/2006. 2006 ($ in millions) 2007 Reported 1 % Change Incl. TCC 2 % Change Revenue 1,492.8 967.9 54 1,214.3 23 Cost of Services 791.8 521.0 52 666.3 19 Operating, Administrative & Other 468.4 293.1 60 390.1 20 Merger-Related Charges 5.1 - NA - NA Equity Income from Unconsolidated Subsidiaries 6.0 9.1 -34 13.6 -56 Minority Interest Expense (Income) 9.7 (0.6) NA 0.1 NA Gain on Disposition of Real Estate 16.1 - NA 18.3 -12 EBITDA 239.9 163.5 47 189.7 26 One Time Items: Integration Costs 9.6 2.1 357 2.1 357 Merger-Related Charges 5.1 - NA - NA Normalized EBITDA 254.6 165.6 54 191.8 33 Normalized EBITDA Margin 15.8% 17.1% 17.1% |
|
|
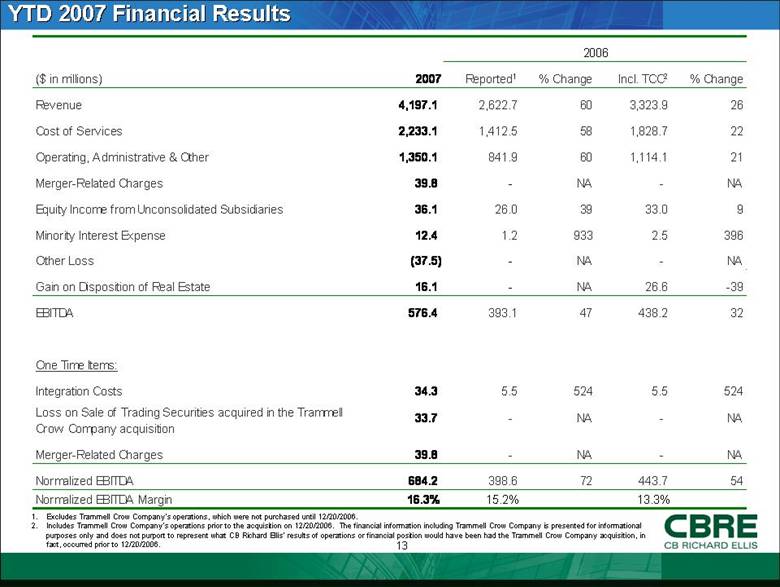
YTD 2007 Financial Results Excludes Trammell Crow Company’s operations, which were not purchased until 12/20/2006. Includes Trammell Crow Company’s operations prior to the acquisition on 12/20/2006. The financial information including Trammell Crow Company is presented for informational purposes only and does not purport to represent what CB Richard Ellis’ results of operations or financial position would have been had the Trammell Crow Company acquisition, in fact, occurred prior to 12/20/2006. 2006 ($ in millions) 2007 Reported 1 % Change Incl. TCC 2 % Change Revenue 4,197.1 2,622.7 60 3,323.9 26 Cost of Services 2,233.1 1,412.5 58 1,828.7 22 Operating, Administrative & Other 1,350.1 841.9 60 1,114.1 21 Merger-Related Charges 39.8 - NA - NA Equity Income from Unconsolidated Subsidiaries 36.1 26.0 39 33.0 9 Minority Interest Expense 12.4 1.2 933 2.5 396 Other Loss (37.5) - NA - NA Gain on Disposition of Real Estate 16.1 - NA 26.6 -39 EBITDA 576.4 393.1 47 438.2 32 One Time Items: Integration Costs 34.3 5.5 524 5.5 524 Loss on Sale of Trading Securities acquired in the Trammell Crow Company acquisition 33.7 - NA - NA Merger-Related Charges 39.8 - NA - NA Normalized EBITDA 684.2 398.6 72 443.7 54 Normalized EBITDA Margin 13.3% 15.2% 16.3% |
|
|
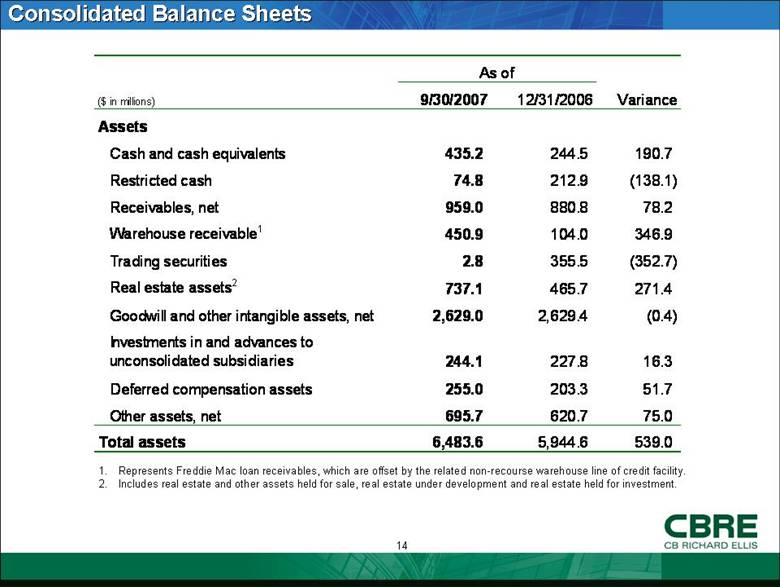
Consolidated Balance Sheets Represents Freddie Mac loan receivables, which are offset by the related non-recourse warehouse line of credit facility. Includes real estate and other assets held for sale, real estate under development and real estate held for investment. ($ in millions) 9/30/2007 12/31/2006 Variance Assets Cash and cash equivalents 435.2 244.5 190.7 Restricted cash 74.8 212.9 (138.1) Receivables, net 959.0 880.8 78.2 Warehouse receivable 1 450.9 104.0 346.9 Trading securities 2.8 355.5 (352.7) Real estate assets 2 737.1 465.7 271.4 Goodwill and other intangible assets, net 2,629.0 2,629.4 (0.4) Investments in and advances to unconsolidated subsidiaries 244.1 227.8 16.3 Deferred compensation assets 255.0 203.3 51.7 Other assets, net 695.7 620.7 75.0 Total assets 6,483.6 5,944.6 539.0 As of |
|
|
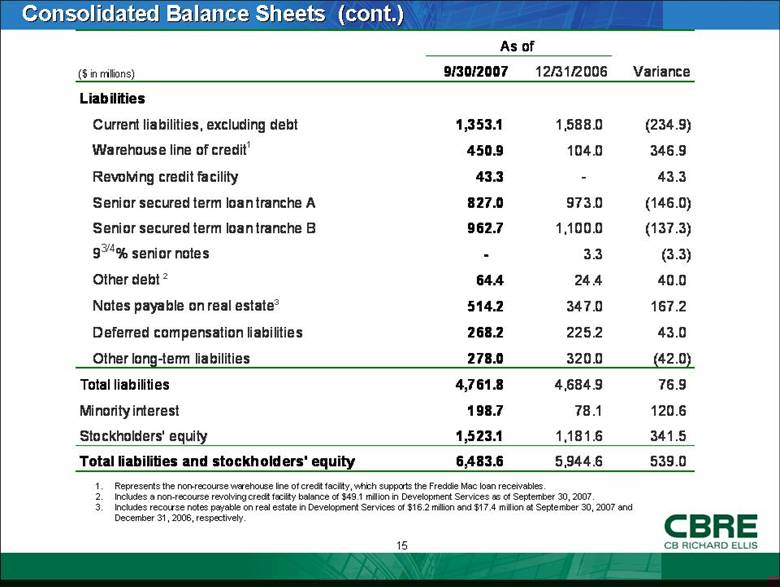
Consolidated Balance Sheets (cont.) Represents the non-recourse warehouse line of credit facility, which supports the Freddie Mac loan receivables. Includes a non-recourse revolving credit facility balance of $49.1 million in Development Services as of September 30, 2007. Includes recourse notes payable on real estate in Development Services of $16.2 million and $17.4 million at September 30, 2007 and December 31, 2006, respectively. ($ in millions) 9/30/2007 12/31/2006 Variance Liabilities Current liabilities, excluding debt 1,353.1 1,588.0 (234.9) Warehouse line of credit 1 450.9 104.0 346.9 Revolving credit facility 43.3 - 43.3 Senior secured term loan tranche A 827.0 973.0 (146.0) Senior secured term loan tranche B 962.7 1,100.0 (137.3) 9 3/4 % senior notes - 3.3 (3.3) Other debt 2 64.4 24.4 40.0 Notes payable on real estate 3 514.2 347.0 167.2 Deferred compensation liabilities 268.2 225.2 43.0 Other long-term liabilities 278.0 320.0 (42.0) Total liabilities 4,761.8 4,684.9 76.9 Minority interest 198.7 78.1 120.6 Stockholders' equity 1,523.1 1,181.6 341.5 Total liabilities and stockholders' equity 6,483.6 5,944.6 539.0 As of |
|
|
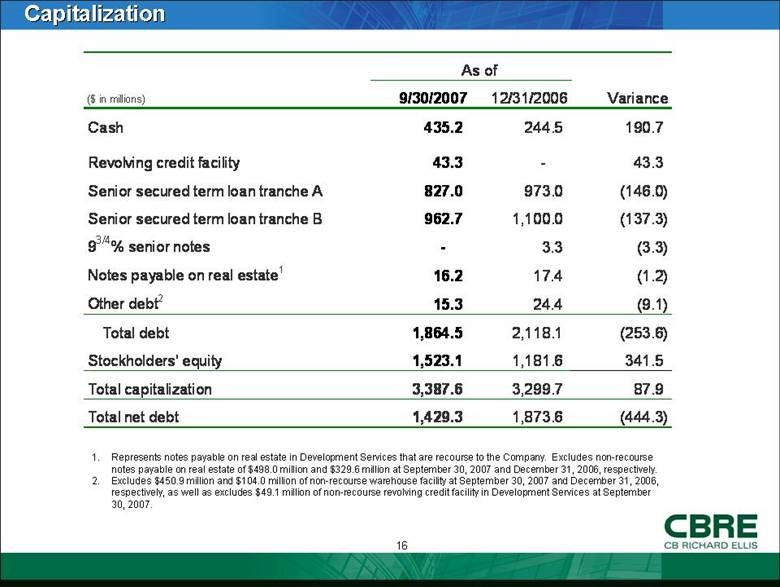
Capitalization Represents notes payable on real estate in Development Services that are recourse to the Company. Excludes non-recourse notes payable on real estate of $498.0 million and $329.6 million at September 30, 2007 and December 31, 2006, respectively. Excludes $450.9 million and $104.0 million of non-recourse warehouse facility at September 30, 2007 and December 31, 2006, respectively, as well as excludes $49.1 million of non-recourse revolving credit facility in Development Services at September 30, 2007. ($ in millions) 9/30/2007 12/31/2006 Variance Cash 435.2 244.5 190.7 Revolving credit facility 43.3 - 43.3 Senior secured term loan tranche A 827.0 973.0 (146.0) Senior secured term loan tranche B 962.7 1,100.0 (137.3) 9 3/4 % senior notes - 3.3 (3.3) Notes payable on real estate 1 16.2 17.4 (1.2) Other debt 2 15.3 24.4 (9.1) Total debt 1,864.5 2,118.1 (253.6) Stockholders' equity 1,523.1 1,181.6 341.5 Total capitalization 3,387.6 3,299.7 87.9 Total net debt 1,429.3 1,873.6 (444.3) As of |
|
|
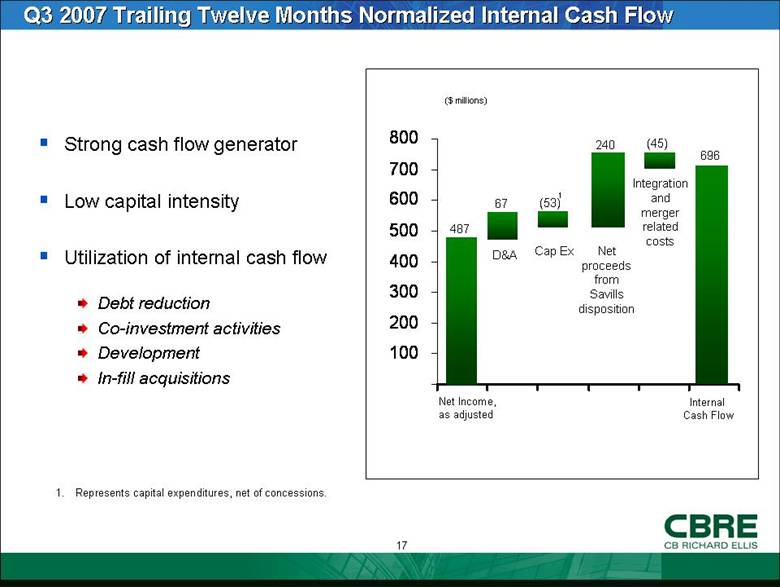
Strong cash flow generator Low capital intensity Utilization of internal cash flow Debt reduction Co-investment activities Development In-fill acquisitions Q3 2007 Trailing Twelve Months Normalized Internal Cash Flow ($ millions) 487 Net Income, as adjusted D&A Cap Ex (53) 696 Represents capital expenditures, net of concessions. Internal Cash Flow 1 67 240 (45) Net proceeds from Savills disposition Integration and merger related costs - 100 200 300 400 500 600 700 800 |
|
|
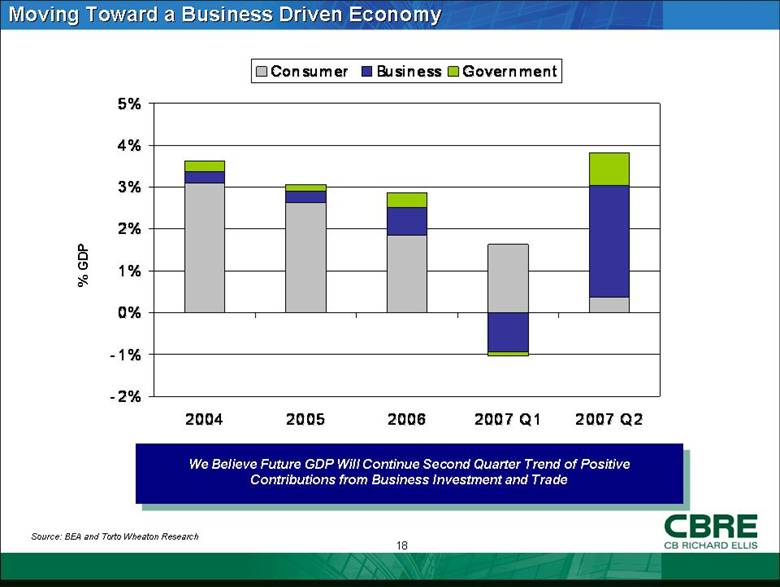
Moving Toward a Business Driven Economy We Believe Future GDP Will Continue Second Quarter Trend of Positive Contributions from Business Investment and Trade Source: BEA and Torto Wheaton Research % GDP -2% -1% 0% 1% 2% 3% 4% 5% 2004 2005 2006 2007 Q1 2007 Q2 Consumer Business Government |
|
|
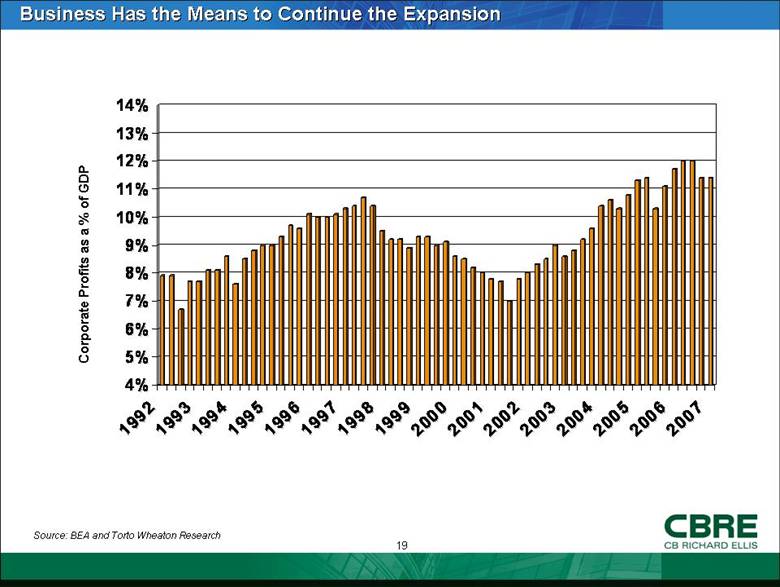
Business Has the Means to Continue the Expansion Source: BEA and Torto Wheaton Research Corporate Profits as a % of GDP 4% 5% 6% 7% 8% 9% 10% 11% 12% 13% 14% 1992 1993 1994 1995 1996 1997 1998 1999 2000 2001 2002 2003 2004 2005 2006 2007 |
|
|
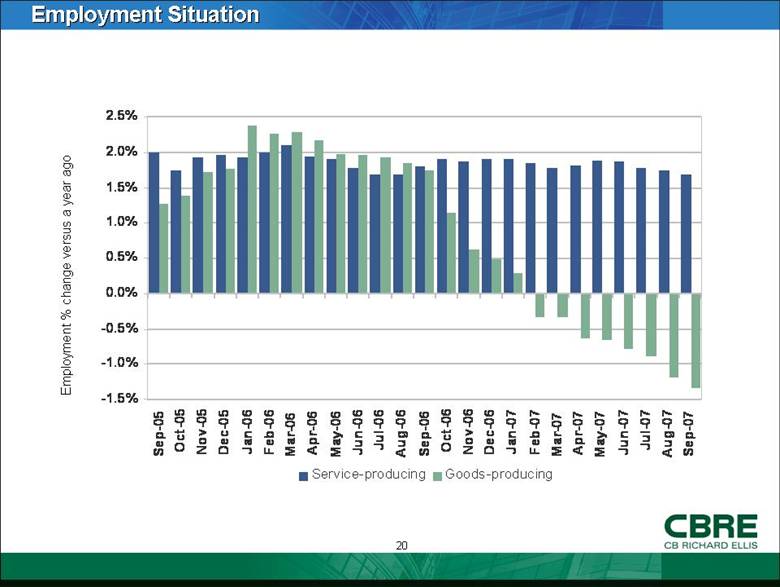
Employment Situation Employment % change versus a year ago -1.5% -1.0% -0.5% 0.0% 0.5% 1.0% 1.5% 2.0% 2.5% Sep-05 Oct-05 Nov-05 Dec-05 Jan-06 Feb-06 Mar-06 Apr-06 May-06 Jun-06 Jul-06 Aug-06 Sep-06 Oct-06 Nov-06 Dec-06 Jan-07 Feb-07 Mar-07 Apr-07 May-07 Jun-07 Jul-07 Aug-07 Sep-07 Service-producing Goods-producing |
|
|
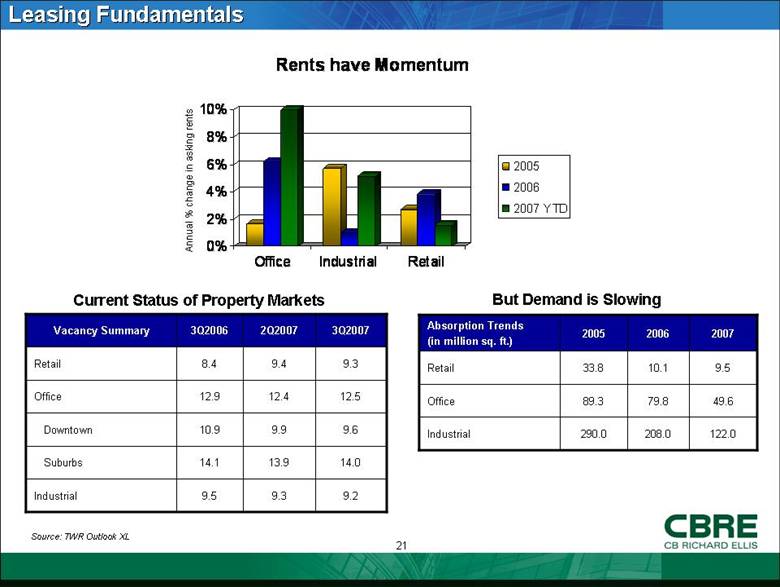
Leasing Fundamentals Annual % change in asking rents 9.2 9.3 9.5 Industrial 14.0 13.9 14.1 9.6 9.9 10.9 12.5 12.4 12.9 Office 9.3 9.4 8.4 Retail 3Q2007 2Q2007 3Q2006 Vacancy Summary Current Status of Property Markets 122.0 208.0 290.0 Industrial 49.6 79.8 89.3 Office 9.5 10.1 33.8 Retail 2007 2006 2005 Absorption Trends (in million sq. ft.) But Demand is Slowing Source: TWR Outlook XL 0% 2% 4% 6% 8% 10% Office Industrial Retail Rents have Momentum 2005 2006 2007 YTD Downtown Suburbs |
|
|
Summary Maintain full year 2007 diluted earnings per share growth of approximately 50% as compared to 2006 performance, excluding one time items Business side of the economy still looks generally favorable Offshore capital investment at record levels Well positioned to capture increasing market share |
|
|
Appendix |
|
|
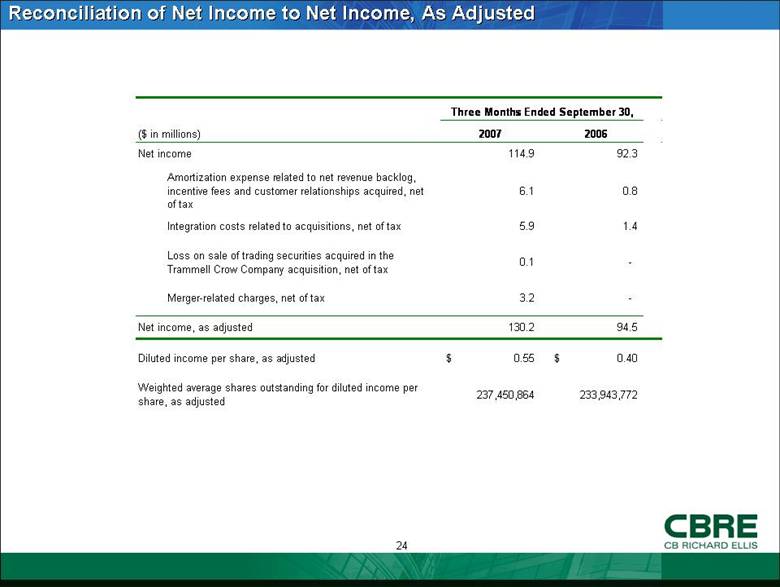
Reconciliation of Net Income to Net Income, As Adjusted Twelve Months Ended Dec. 31, ($ in millions) 2007 2006 Net income 114.9 92.3 Amortization expense related to net revenue backlog, incentive fees and customer relationships acquired, net of tax 6.1 0.8 Integration costs related to acquisitions, net of tax 5.9 1.4 Loss on sale of trading securities acquired in the Trammell Crow Company acquisition, net of tax 0.1 - Merger-related charges, net of tax 3.2 - Net income, as adjusted 130.2 94.5 Diluted income per share, as adjusted 0.55 $ 0.40 $ Weighted average shares outstanding for diluted income per share, as adjusted 237,450,864 233,943,772 Three Months Ended September 30, |
|
|
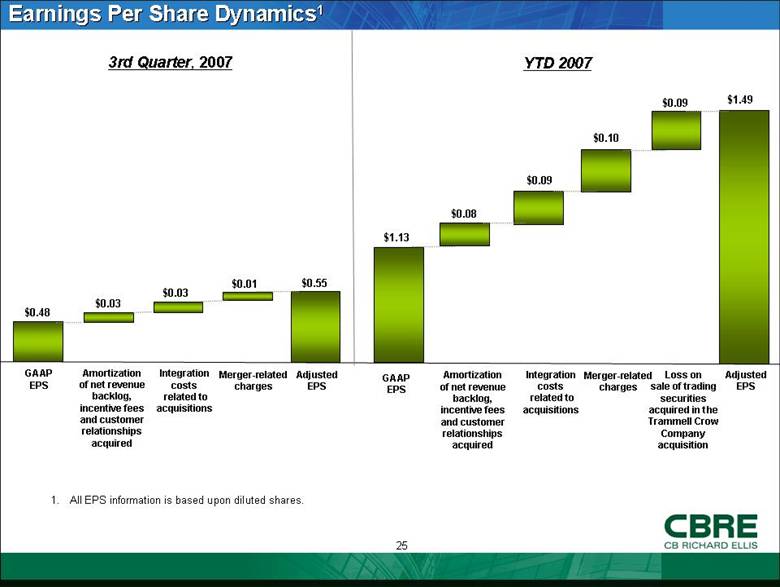
Earnings Per Share Dynamics1 1. All EPS information is based upon diluted shares. GAAP EPS Integration costs related to acquisitions Adjusted EPS $0.48 $0.03 $0.55 Merger-related charges $0.01 Amortization of net revenue backlog, incentive fees and customer relationships acquired $0.03 Amortization of net revenue backlog, incentive fees and customer relationships acquired $0.08 GAAP EPS $1.13 Integration costs related to acquisitions $0.09 Merger-related charges $0.10 $0.09 Adjusted EPS $1.49 3rd Quarter, 2007 YTD 2007 Loss on sale of trading securities acquired in the Trammell Crow Company acquisition |
|
|
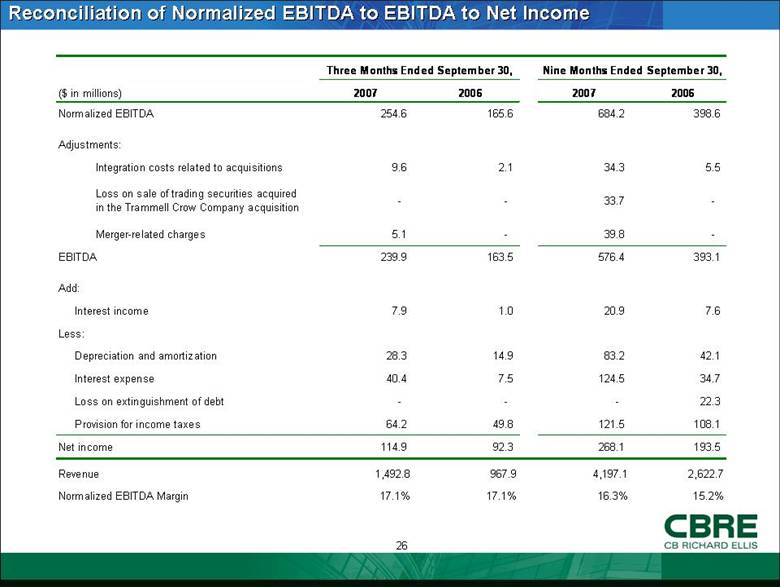
Reconciliation of Normalized EBITDA to EBITDA to Net Income Nine Months Ended September 30, ($ in millions) 2007 2006 2007 2006 Normalized EBITDA 254.6 165.6 684.2 398.6 Adjustments: Integration costs related to acquisitions 9.6 2.1 34.3 5.5 Loss on sale of trading securities acquired in the Trammell Crow Company acquisition - - 33.7 - Merger-related charges 5.1 - 39.8 - EBITDA 239.9 163.5 576.4 393.1 Add: 7.9 1.0 20.9 7.6 Less: 28.3 14.9 83.2 42.1 40.4 7.5 124.5 34.7 - - - 22.3 64.2 49.8 121.5 108.1 Net income 114.9 92.3 268.1 193.5 Revenue 1,492.8 967.9 4,197.1 2,622.7 Normalized EBITDA Margin 17.1% 17.1% 16.3% 15.2% Three Months Ended September 30, Provision for income taxes Loss on extinguishment of debt Interest expense Depreciation and amortization Interest income |
|
|
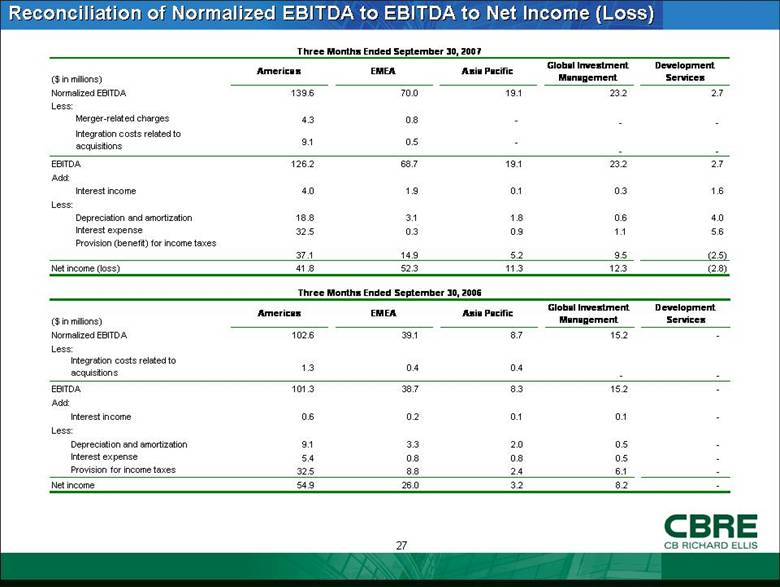
Reconciliation of Normalized EBITDA to EBITDA to Net Income (Loss) Three Months Ended September 30, 2006 ($ in millions) Americas EMEA Asia Pacific Global Investment Management Development Services Normalized EBITDA 102.6 39.1 8.7 15.2 - Less: Integration costs related to acquisitions 1.3 0.4 0.4 - - EBITDA 101.3 38.7 8.3 15.2 - Add: Interest income 0.6 0.2 0.1 0.1 - Less: Depreciation and amortization 9.1 3.3 2.0 0.5 - Interest expense 5.4 0.8 0.8 0.5 - Provision for income taxes 32.5 8.8 2.4 6.1 - Net income 54.9 26.0 3.2 8.2 - |
|
|
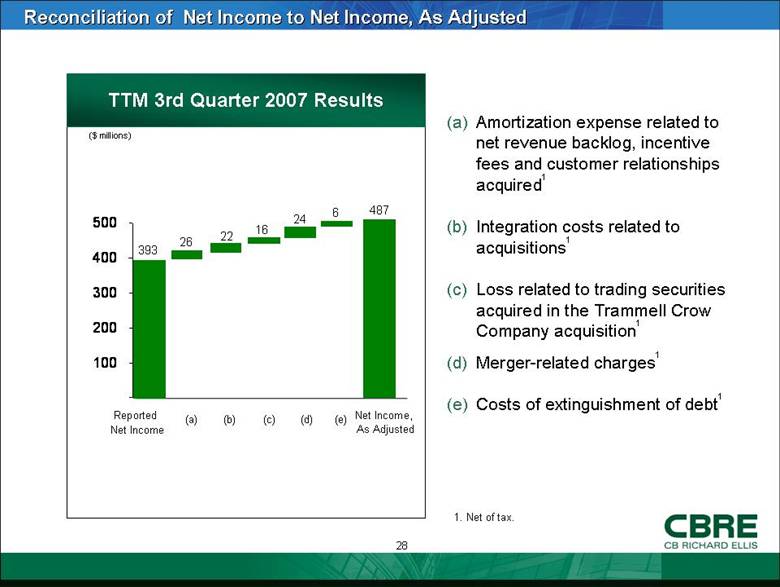
Amortization expense related to net revenue backlog, incentive fees and customer relationships acquired1 Integration costs related to acquisitions1 Loss related to trading securities acquired in the Trammell Crow Company acquisition1 Merger-related charges1 Costs of extinguishment of debt1 Reconciliation of Net Income to Net Income, As Adjusted Net Income, As Adjusted TTM 3rd Quarter 2007 Results ($ millions) 393 487 26 22 Reported Net Income (a) (b) (c) 1. Net of tax. 16 24 (d) 6 (e) - 100 200 300 400 500 |
|
|
|