Exhibit 99.2
|
|
CB Richard Ellis Group, Inc. Second Quarter 2007 Earnings Conference Call July 31, 2007 |

Exhibit 99.2
|
|
CB Richard Ellis Group, Inc. Second Quarter 2007 Earnings Conference Call July 31, 2007 |
|
|
Conference Call Participants Brett White, President and Chief Executive Officer Kenneth J. Kay, Senior Executive Vice President & Chief Financial Officer Michael Lafitte, President, Institutional & Corporate Services Nick Kormeluk, Senior Vice President, Investor Relations |
|
|
Forward Looking Statements This presentation contains statements that are forward looking within the meaning of the Private Securities Litigation Reform Act of 1995, including statements regarding our growth momentum in 2007, future operations, the impact of acquisitions and future financial performance. These statements should be considered as estimates only and actual results may ultimately differ from these estimates. Except to the extent required by applicable securities laws, we undertake no obligation to update or publicly revise any of the forward-looking statements that you may hear today. Please refer to our current annual report on Form 10-K (in particular, Risk Factors) and our current quarterly report on Form 10-Q, which are filed with the SEC and available at the SEC’s website (http://www.sec.gov), for a full discussion of the risks and other factors that may impact any estimates that you may hear today. We may make certain statements during the course of this presentation which include references to “non-GAAP financial measures,” as defined by SEC regulations. As required by these regulations, we have provided reconciliations of these measures to what we believe are the most directly comparable GAAP measures, which are attached hereto within the appendix. |
|
|
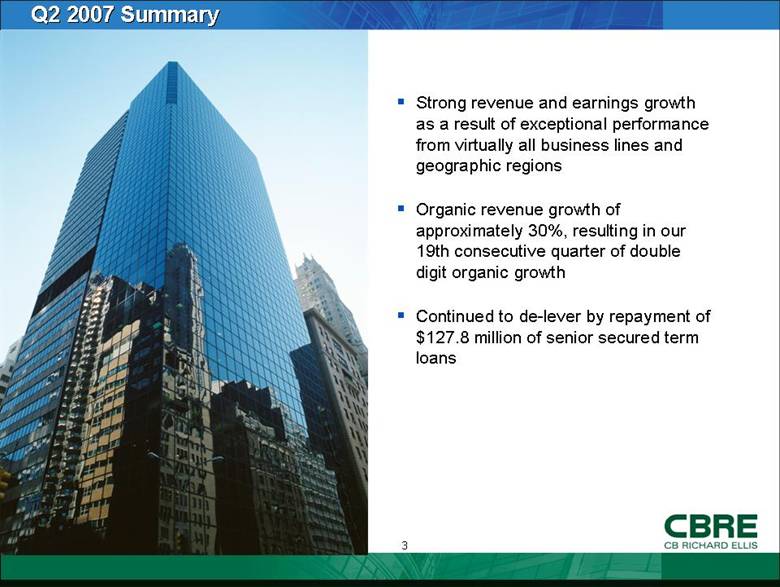
Q2 2007 Summary Strong revenue and earnings growth as a result of exceptional performance from virtually all business lines and geographic regions Organic revenue growth of approximately 30%, resulting in our 19th consecutive quarter of double digit organic growth Continued to de-lever by repayment of $127.8 million of senior secured term loans |
|
|
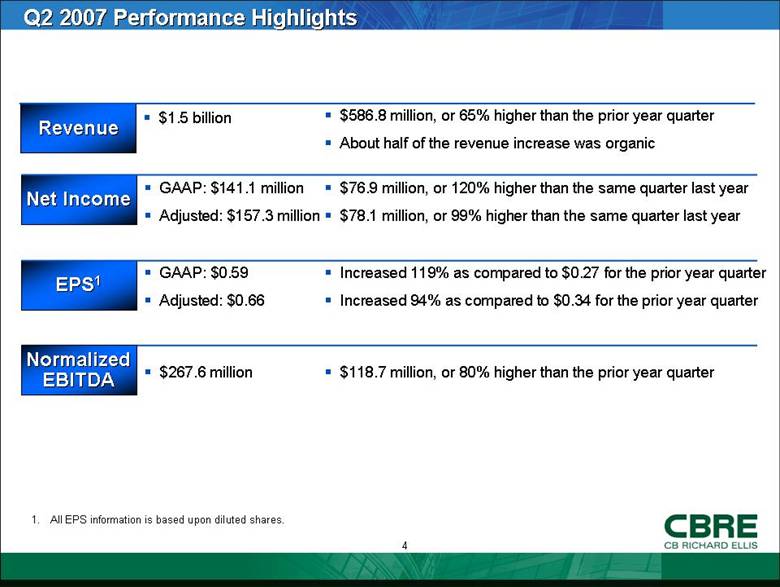
Q2 2007 Performance Highlights Revenue $1.5 billion $586.8 million, or 65% higher than the prior year quarter About half of the revenue increase was organic $76.9 million, or 120% higher than the same quarter last year $78.1 million, or 99% higher than the same quarter last year GAAP: $141.1 million Adjusted: $157.3 million Increased 119% as compared to $0.27 for the prior year quarter Increased 94% as compared to $0.34 for the prior year quarter GAAP: $0.59 Adjusted: $0.66 $118.7 million, or 80% higher than the prior year quarter $267.6 million Net Income EPS1 Normalized EBITDA 1. All EPS information is based upon diluted shares. |
|
|
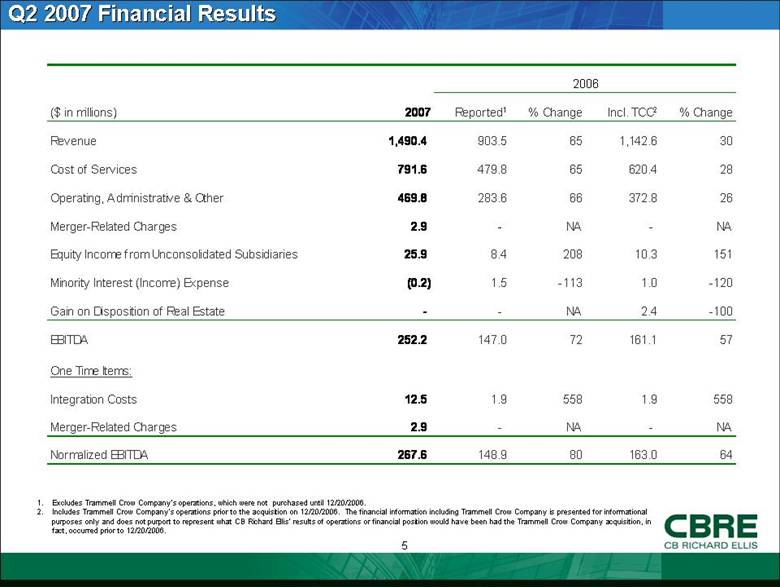
Q2 2007 Financial Results Excludes Trammell Crow Company’s operations, which were not purchased until 12/20/2006. Includes Trammell Crow Company’s operations prior to the acquisition on 12/20/2006. The financial information including Trammell Crow Company is presented for informational purposes only and does not purport to represent what CB Richard Ellis’ results of operations or financial position would have been had the Trammell Crow Company acquisition, in fact, occurred prior to 12/20/2006. 2006 ($ in millions) 2007 Reported 1 % Change Incl. TCC 2 % Change Revenue 1,490.4 903.5 65 1,142.6 30 Cost of Services 791.6 479.8 65 620.4 28 Operating, Administrative & Other 469.8 283.6 66 372.8 26 Merger-Related Charges 2.9 - NA - NA Equity Income from Unconsolidated Subsidiaries 25.9 8.4 208 10.3 151 Minority Interest (Income) Expense (0.2) 1.5 -113 1.0 -120 Gain on Disposition of Real Estate - - NA 2.4 -100 EBITDA 252.2 147.0 72 161.1 57 One Time Items: Integration Costs 12.5 1.9 558 1.9 558 Merger-Related Charges 2.9 - NA - NA Normalized EBITDA 267.6 148.9 80 163.0 64 |
|
|
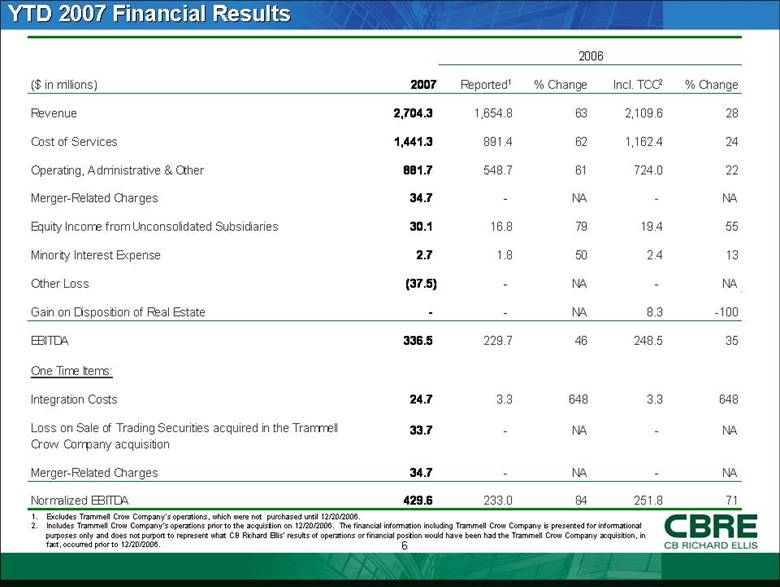
YTD 2007 Financial Results 1. Excludes Trammell Crow Company’s operations, which were not purchased until 12/20/2006. 2. Includes Trammell Crow Company’s operations prior to the acquisition on 12/20/2006. The financial information including Trammell Crow Company is presented for informational purposes only and does not purport to represent what CB Richard Ellis’ results of operations or financial position would have been had the Trammell Crow Company acquisition, in fact, occurred prior to 12/20/2006. 2006 ($ in millions) 2007 Reported1 % Change Incl. TCC2 % Change Revenue 2,704.3 1,654.8 63 2,109.6 28 Cost of Services 1,441.3 891.4 62 1,162.4 24 Operating, Administrative & Other 881.7 548.7 61 724.0 22 Merger-Related Charges 34.7 - NA - NA Equity Income from Unconsolidated Subsidiaries 30.1 16.8 79 19.4 55 Minority Interest Expense 2.7 1.8 50 2.4 13 Other Loss (37.5) - NA - NA Gain on Disposition of Real Estate - - NA 8.3 -100 EBITDA 336.5 229.7 46 248.5 35 One Time Items: Integration Costs 24.7 3.3 648 3.3 648 Loss on Sale of Trading Securities acquired in the Trammell Crow Company acquisition 33.7 - NA - NA Merger-Related Charges 34.7 - NA - NA Normalized EBITDA 429.6 233.0 84 251.8 71 |
|
|
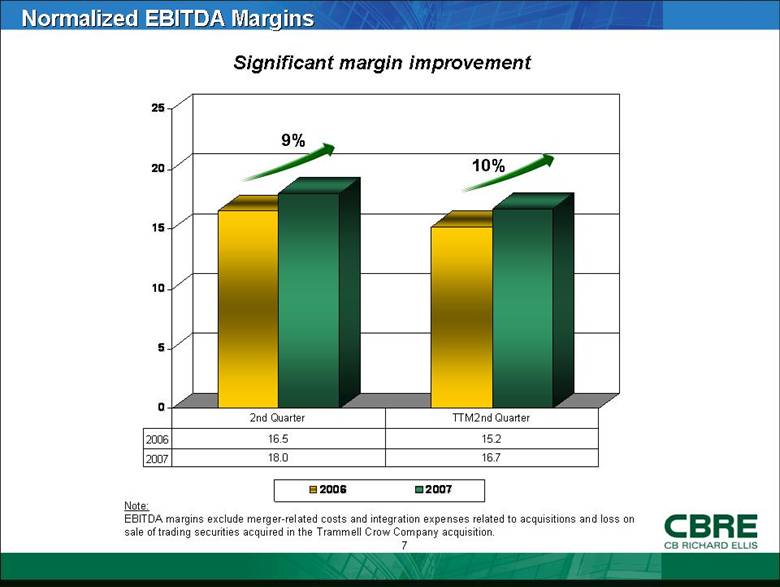
Normalized EBITDA Margins Significant margin improvement Note: EBITDA margins exclude merger-related costs and integration expenses related to acquisitions and loss on sale of trading securities acquired in the Trammell Crow Company acquisition. 9% 10% 0 5 10 15 20 25 2006 2007 2006 16.5 15.2 2007 18.0 16.7 2nd Quarter TTM 2nd Quarter 1. 2. |
|
|
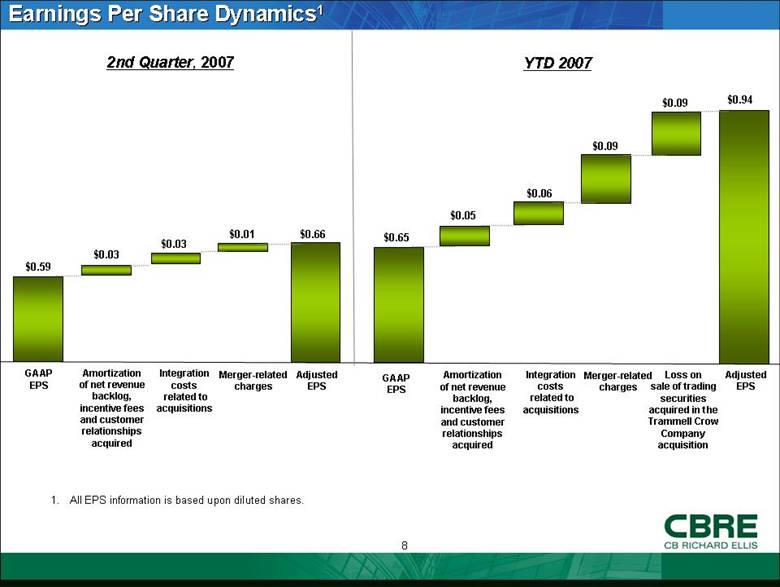
Earnings Per Share Dynamics1 1. All EPS information is based upon diluted shares. GAAP EPS Integration costs related to acquisitions Adjusted EPS $0.59 $0.03 $0.66 Merger-related charges $0.01 Amortization of net revenue backlog, incentive fees and customer relationships acquired $0.03 Amortization of net revenue backlog, incentive fees and customer relationships acquired $0.05 GAAP EPS $0.65 Integration costs related to acquisitions $0.06 Merger-related charges $0.09 $0.09 Adjusted EPS $0.94 2nd Quarter, 2007 YTD 2007 Loss on sale of trading securities acquired in the Trammell Crow Company acquisition |
|
|
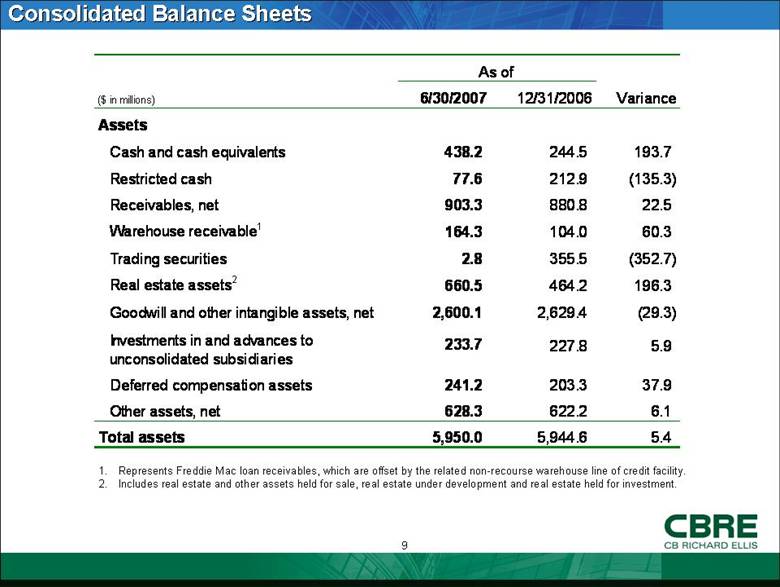
Consolidated Balance Sheets Represents Freddie Mac loan receivables, which are offset by the related non-recourse warehouse line of credit facility. Includes real estate and other assets held for sale, real estate under development and real estate held for investment. ($ in millions) 6/30/2007 12/31/2006 Variance Assets Cash and cash equivalents 438.2 244.5 193.7 Restricted cash 77.6 212.9 (135.3) Receivables, net 903.3 880.8 22.5 Warehouse receivable 1 164.3 104.0 60.3 Trading securities 2.8 355.5 (352.7) Real estate assets 2 660.5 464.2 196.3 Goodwill and other intangible assets, net 2,600.1 2,629.4 (29.3) Investments in and advances to unconsolidated subsidiaries 233.7 227.8 5.9 Deferred compensation assets 241.2 203.3 37.9 Other assets, net 628.3 622.2 6.1 Total assets 5,950.0 5,944.6 5.4 As of 1. 2. |
|
|
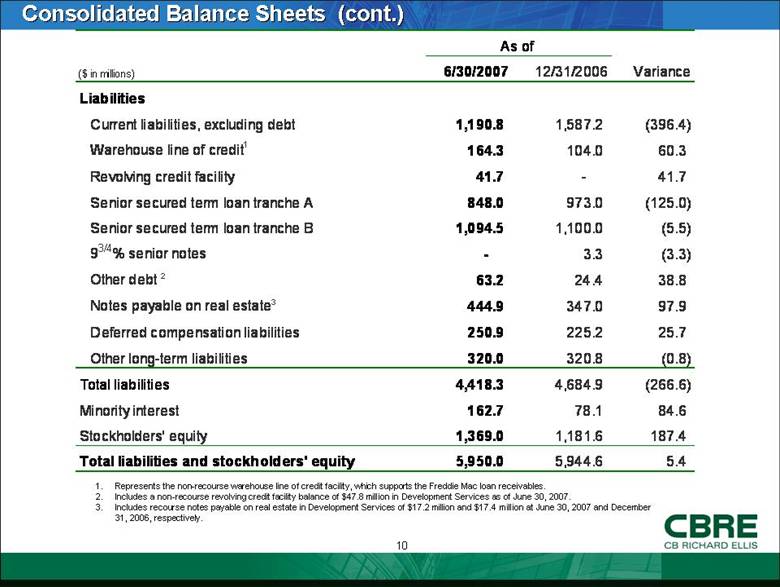
Consolidated Balance Sheets (cont.) Represents the non-recourse warehouse line of credit facility, which supports the Freddie Mac loan receivables. Includes a non-recourse revolving credit facility balance of $47.8 million in Development Services as of June 30, 2007. Includes recourse notes payable on real estate in Development Services of $17.2 million and $17.4 million at June 30, 2007 and December 31, 2006, respectively. ($ in millions) 6/30/2007 12/31/2006 Variance Liabilities Current liabilities, excluding debt 1,190.8 1,587.2 (396.4) Warehouse line of credit 1 164.3 104.0 60.3 Revolving credit facility 41.7 - 41.7 Senior secured term loan tranche A 848.0 973.0 (125.0) Senior secured term loan tranche B 1,094.5 1,100.0 (5.5) 9 3/4 % senior notes - 3.3 (3.3) Other debt 2 63.2 24.4 38.8 Notes payable on real estate 3 444.9 347.0 97.9 Deferred compensation liabilities 250.9 225.2 25.7 Other long-term liabilities 320.0 320.8 (0.8) Total liabilities 4,418.3 4,684.9 (266.6) Minority interest 162.7 78.1 84.6 Stockholders' equity 1,369.0 1,181.6 187.4 Total liabilities and stockholders' equity 5,950.0 5,944.6 5.4 As of 1. 2. 3. |
|
|
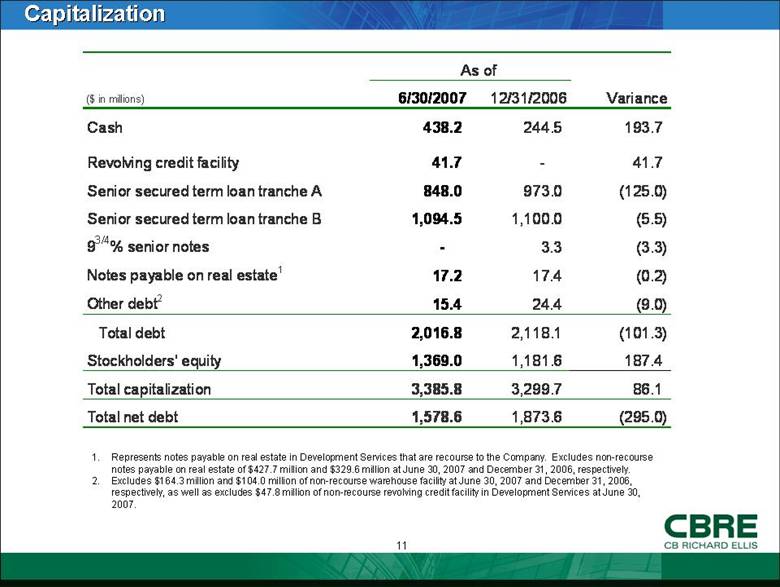
Capitalization Represents notes payable on real estate in Development Services that are recourse to the Company. Excludes non-recourse notes payable on real estate of $427.7 million and $329.6 million at June 30, 2007 and December 31, 2006, respectively. Excludes $164.3 million and $104.0 million of non-recourse warehouse facility at June 30, 2007 and December 31, 2006, respectively, as well as excludes $47.8 million of non-recourse revolving credit facility in Development Services at June 30, 2007. ($ in millions) 6/30/2007 12/31/2006 Variance Cash 438.2 244.5 193.7 Revolving credit facility 41.7 - 41.7 Senior secured term loan tranche A 848.0 973.0 (125.0) Senior secured term loan tranche B 1,094.5 1,100.0 (5.5) 9 3/4 % senior notes - 3.3 (3.3) Notes payable on real estate 1 17.2 17.4 (0.2) Other debt 2 15.4 24.4 (9.0) Total debt 2,016.8 2,118.1 (101.3) Stockholders' equity 1,369.0 1,181.6 187.4 Total capitalization 3,385.8 3,299.7 86.1 Total net debt 1,578.6 1,873.6 (295.0) As of |
|
|
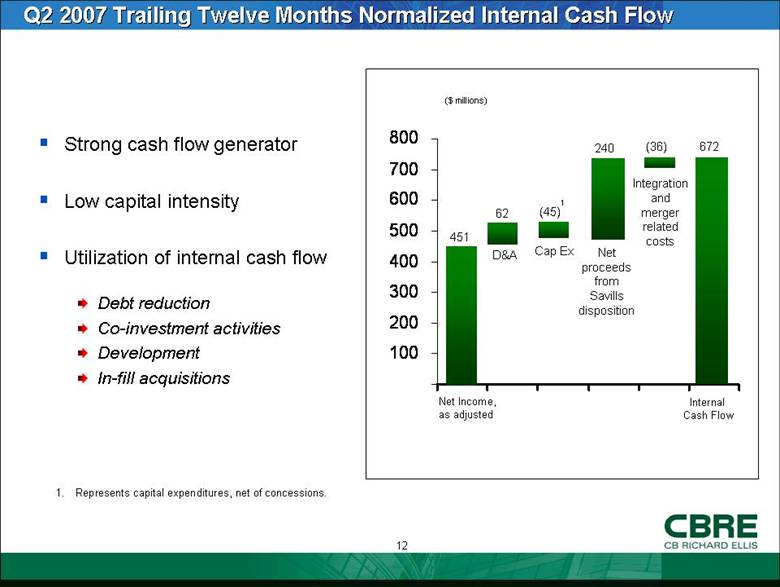
Strong cash flow generator Low capital intensity Utilization of internal cash flow Debt reduction Co-investment activities Development In-fill acquisitions Q2 2007 Trailing Twelve Months Normalized Internal Cash Flow ($ millions) 451 Net Income, as adjusted D&A Cap Ex (45) 672 1. Represents capital expenditures, net of concessions. Internal Cash Flow 1 62 240 (36) Net proceeds from Savills disposition Integration and merger related costs - 100 200 300 400 500 600 700 800 1. 2. |
|
|
Trammell Crow Company Integration Update Revenue synergy opportunities are starting to be realized Trammell Crow Company integration is proceeding well and is ahead of schedule Accordingly, we have increased the net expense synergy savings target by $25 million to $90 million, 60% of which should be realized in 2007 |
|
|
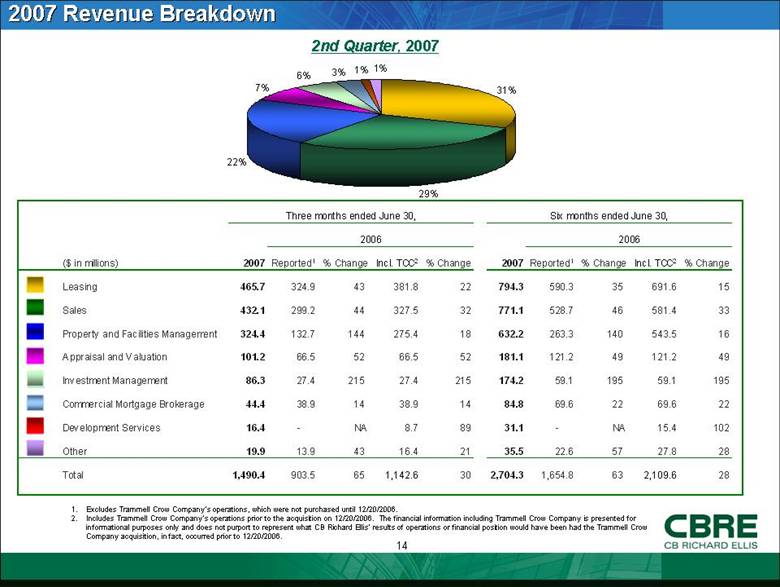
2007 Revenue Breakdown 2nd Quarter, 2007 Excludes Trammell Crow Company’s operations, which were not purchased until 12/20/2006. Includes Trammell Crow Company’s operations prior to the acquisition on 12/20/2006. The financial information including Trammell Crow Company is presented for informational purposes only and does not purport to represent what CB Richard Ellis’ results of operations or financial position would have been had the Trammell Crow Company acquisition, in fact, occurred prior to 12/20/2006. ($ in millions) 2007 Reported 1 % Change Incl. TCC 2 % Change 2007 Reported 1 % Change Incl. TCC 2 % Change Leasing 465.7 324.9 43 381.8 22 794.3 590.3 35 691.6 15 Sales 432.1 299.2 44 327.5 32 771.1 528.7 46 581.4 33 Property and Facilities Management 324.4 132.7 144 275.4 18 632.2 263.3 140 543.5 16 Appraisal and Valuation 101.2 66.5 52 66.5 52 181.1 121.2 49 121.2 49 Investment Management 86.3 27.4 215 27.4 215 174.2 59.1 195 59.1 195 Commercial Mortgage Brokerage 44.4 38.9 14 38.9 14 84.8 69.6 22 69.6 22 Development Services 16.4 - NA 8.7 89 31.1 - NA 15.4 102 Other 19.9 13.9 43 16.4 21 35.5 22.6 57 27.8 28 Total 1,490.4 903.5 65 1,142.6 30 2,704.3 1,654.8 63 2,109.6 28 Three months ended June 30, 2006 Six months ended June 30, 2006 31% 29% 22% 7% 6% 3% 1% 1% 1. 2. |
|
|
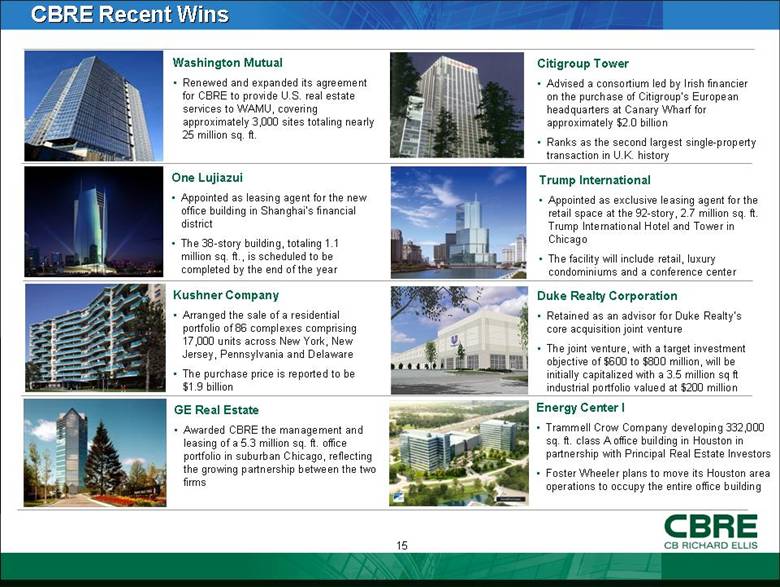
CBRE Recent Wins Duke Realty Corporation Retained as an advisor for Duke Realty’s core acquisition joint venture The joint venture, with a target investment objective of $600 to $800 million, will be initially capitalized with a 3.5 million sq ft industrial portfolio valued at $200 million Citigroup Tower Advised a consortium led by Irish financier on the purchase of Citigroup’s European headquarters at Canary Wharf for approximately $2.0 billion Ranks as the second largest single-property transaction in U.K. history Washington Mutual Renewed and expanded its agreement for CBRE to provide U.S. real estate services to WAMU, covering approximately 3,000 sites totaling nearly 25 million sq. ft. Trump International Appointed as exclusive leasing agent for the retail space at the 92-story, 2.7 million sq. ft. Trump International Hotel and Tower in Chicago The facility will include retail, luxury condominiums and a conference center Energy Center I Trammell Crow Company developing 332,000 sq. ft. class A office building in Houston in partnership with Principal Real Estate Investors Foster Wheeler plans to move its Houston area operations to occupy the entire office building Kushner Company Arranged the sale of a residential portfolio of 86 complexes comprising 17,000 units across New York, New Jersey, Pennsylvania and Delaware The purchase price is reported to be $1.9 billion GE Real Estate Awarded CBRE the management and leasing of a 5.3 million sq. ft. office portfolio in suburban Chicago, reflecting the growing partnership between the two firms One Lujiazui Appointed as leasing agent for the new office building in Shanghai’s financial district The 38-story building, totaling 1.1 million sq. ft., is scheduled to be completed by the end of the year |
|
|
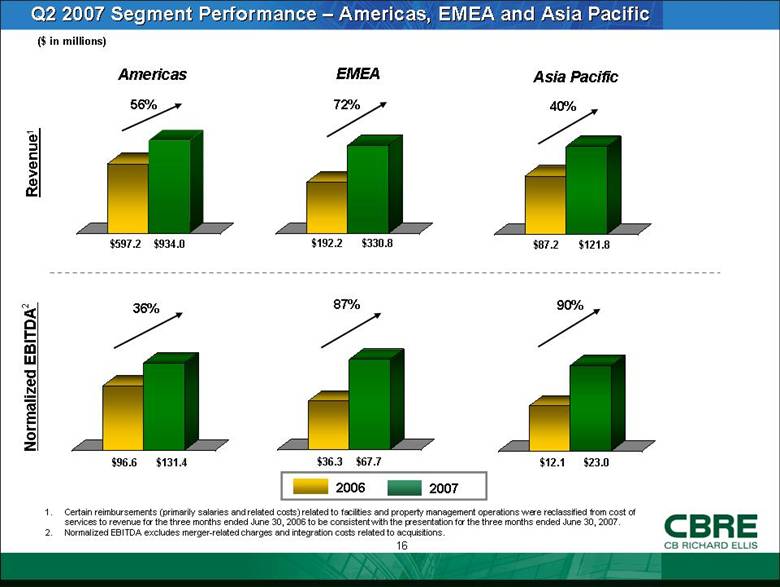
Q2 2007 Segment Performance – Americas, EMEA and Asia Pacific $934.0 ($ in millions) Revenue1 Normalized EBITDA2 Americas EMEA Asia Pacific $597.2 $330.8 $192.2 $121.8 $87.2 $131.4 $96.6 $67.7 $36.3 $23.0 $12.1 56% 72% 40% 36% 87% 2007 2006 90% Certain reimbursements (primarily salaries and related costs) related to facilities and property management operations were reclassified from cost of services to revenue for the three months ended June 30, 2006 to be consistent with the presentation for the three months ended June 30, 2007. Normalized EBITDA excludes merger-related charges and integration costs related to acquisitions. 1. 2. |
|
|
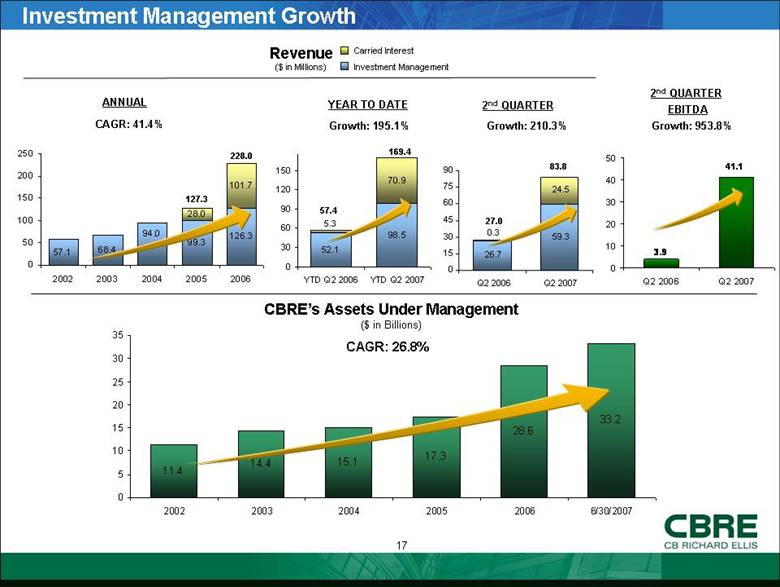
24.5 26.7 59.3 0.3 0 15 30 45 60 75 90 Q2 2006 Q2 2007 Investment Management Growth Revenue ($ in Millions) CAGR: 41.4% Growth: 210.3% ANNUAL 2nd QUARTER Carried Interest Investment Management CAGR: 26.8% CBRE’s Assets Under Management ($ in Billions) 83.8 27.0 228.0 Growth: 195.1% YEAR TO DATE 169.4 2nd QUARTER EBITDA Growth: 953.8% 57.4 127.3 52.1 98.5 70.9 5.3 0 30 60 90 120 150 YTD Q2 2006 YTD Q2 2007 57.1 68.4 99.3 126.3 28.0 101.7 94.0 0 50 100 150 200 250 2002 2003 2004 2005 2006 3.9 41.1 0 10 20 30 40 50 Q2 2006 Q2 2007 11.4 14.4 15.1 17.3 28.6 33.2 0 5 10 15 20 25 30 35 2002 2003 2004 2005 2006 6/30/2007 |
|
|
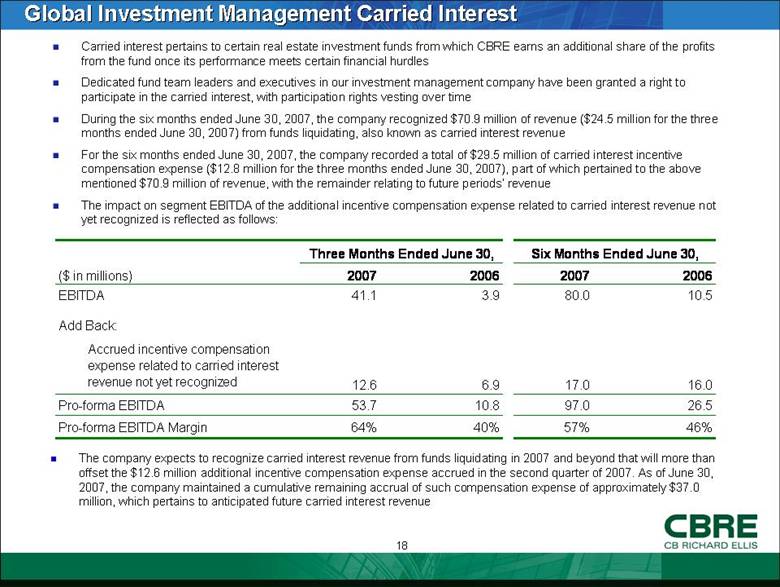
Global Investment Management Carried Interest Carried interest pertains to certain real estate investment funds from which CBRE earns an additional share of the profits from the fund once its performance meets certain financial hurdles Dedicated fund team leaders and executives in our investment management company have been granted a right to participate in the carried interest, with participation rights vesting over time During the six months ended June 30, 2007, the company recognized $70.9 million of revenue ($24.5 million for the three months ended June 30, 2007) from funds liquidating, also known as carried interest revenue For the six months ended June 30, 2007, the company recorded a total of $29.5 million of carried interest incentive compensation expense ($12.8 million for the three months ended June 30, 2007), part of which pertained to the above mentioned $70.9 million of revenue, with the remainder relating to future periods’ revenue The impact on segment EBITDA of the additional incentive compensation expense related to carried interest revenue not yet recognized is reflected as follows: The company expects to recognize carried interest revenue from funds liquidating in 2007 and beyond that will more than offset the $12.6 million additional incentive compensation expense accrued in the second quarter of 2007. As of June 30, 2007, the company maintained a cumulative remaining accrual of such compensation expense of approximately $37.0 million, which pertains to anticipated future carried interest revenue Three Months Ended June 30, Six Months Ended June 30, ($ in millions) 2007 2006 2007 2006 EBITDA 41.1 3.9 80.0 10.5 Add Back: Accrued incentive compensation expense related to carried interest revenue not yet recognized 12.6 6.9 17.0 16.0 Pro-forma EBITDA 53.7 10.8 97.0 26.5 Pro-forma EBITDA Margin 64% 40% 57% 46% |
|
|
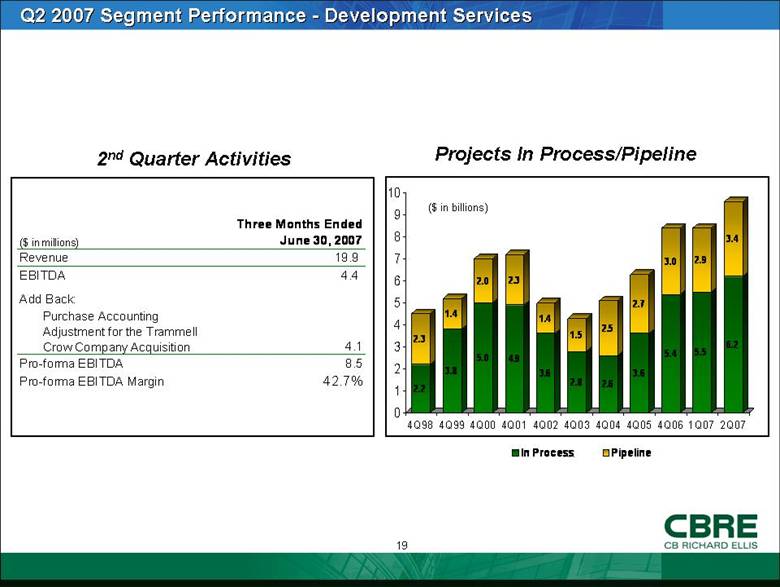
Q2 2007 Segment Performance - Development Services ($ in billions) Projects In Process/Pipeline 2nd Quarter Activities 2.2 2.3 3.8 1.4 5.0 2.0 4.9 2.3 3.6 1.4 2.8 1.5 2.6 2.5 3.6 2.7 5.4 3.0 5.5 2.9 6.2 3.4 0 1 2 3 4 5 6 7 8 9 10 4Q98 4Q99 4Q00 4Q01 4Q02 4Q03 4Q04 4Q05 4Q06 1Q07 2Q07 In Process Pipeline ($ in millions) Three Months Ended June 30, 2007 Revenue 19.9 EBITDA 4.4 Add Back: Purchase Accounting Adjustment for the Trammell Crow Company Acquisition 4.1 Pro-forma EBITDA 8.5 Pro-forma EBITDA Margin 42.7% |
|
|
2007 Guidance Raising full year 2007 diluted earnings per share growth to approximately 50% as compared to 2006 performance, excluding one time items Increase due to strong first half 2007 growth across all businesses, outperformance of the Trammell Crow Company net expense synergy savings target and improved tax rate |
|
|
Summary As evidenced by this quarter’s financial performance business conditions remain positive Capital allocations to commercial real estate remain at high levels, further supported by the backlog of funds that have yet to be invested and increasing cross border capital deployment Ongoing economic growth supports the strength of the global leasing markets |
|
|
Appendix |
|
|
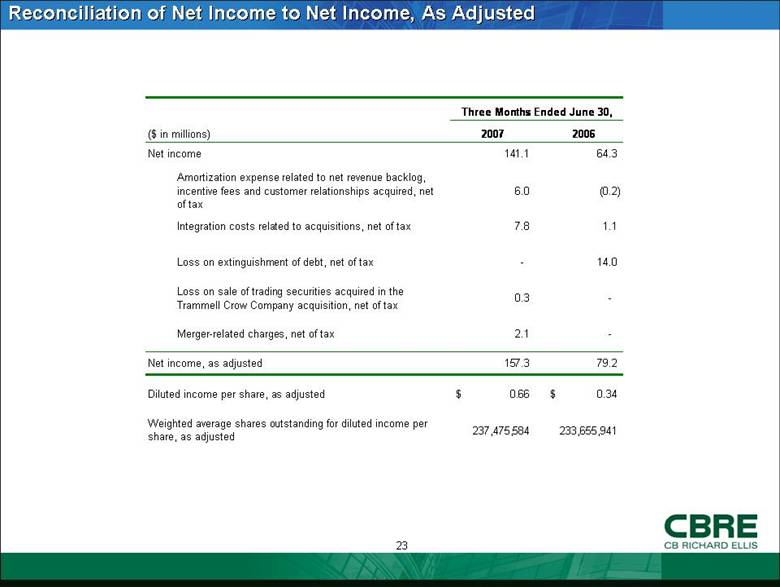
Reconciliation of Net Income to Net Income, As Adjusted ($ in millions) 2007 2006 Net income 141.1 64.3 Amortization expense related to net revenue backlog, incentive fees and customer relationships acquired, net of tax 6.0 (0.2) Integration costs related to acquisitions, net of tax 7.8 1.1 Loss on extinguishment of debt, net of tax - 14.0 Loss on sale of trading securities acquired in the Trammell Crow Company acquisition, net of tax 0.3 - Merger-related charges, net of tax 2.1 - Net income, as adjusted 157.3 79.2 Diluted income per share, as adjusted 0.66 $ 0.34 $ Weighted average shares outstanding for diluted income per share, as adjusted 237,475,584 233,655,941 Three Months Ended June 30, |
|
|
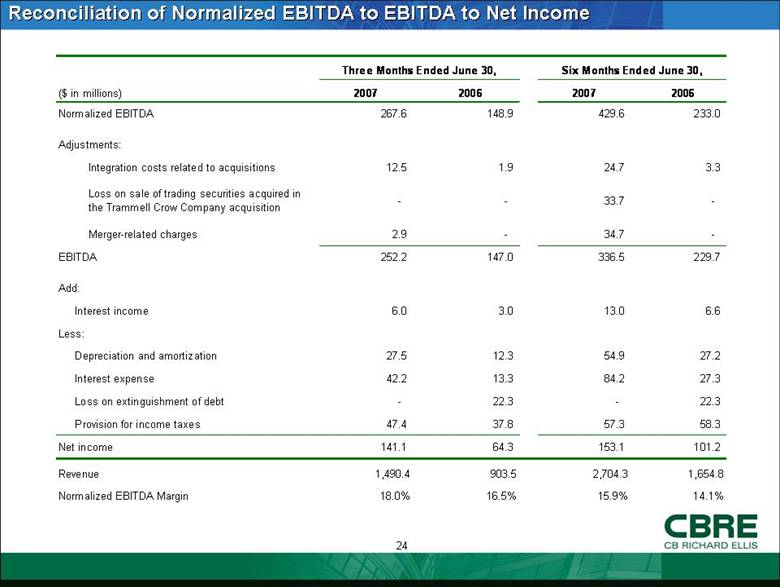
Reconciliation of Normalized EBITDA to EBITDA to Net Income Six Months Ended June 30, ($ in millions) 2007 2006 2007 2006 Normalized EBITDA 267.6 148.9 429.6 233.0 Adjustments: Integration costs related to acquisitions 12.5 1.9 24.7 3.3 Loss on sale of trading securities acquired in the Trammell Crow Company acquisition - - 33.7 - Merger-related charges 2.9 - 34.7 - EBITDA 252.2 147.0 336.5 229.7 Add: 6.0 3.0 13.0 6.6 Less: 27.5 12.3 54.9 27.2 42.2 13.3 84.2 27.3 - 22.3 - 22.3 47.4 37.8 57.3 58.3 Net income 141.1 64.3 153.1 101.2 Revenue 1,490.4 903.5 2,704.3 1,654.8 Normalized EBITDA Margin 18.0% 16.5% 15.9% 14.1% Three Months Ended June 30, Provision for income taxes Loss on extinguishment of debt Interest expense Depreciation and amortization Interest income |
|
|
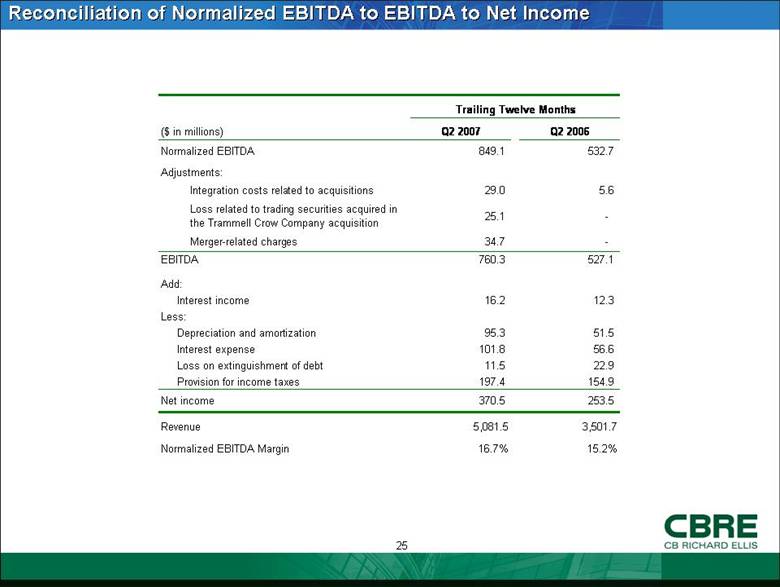
Reconciliation of Normalized EBITDA to EBITDA to Net Income ($ in millions) Q2 2007 Q2 2006 Normalized EBITDA 849.1 532.7 Adjustments: Integration costs related to acquisitions 29.0 5.6 Loss related to trading securities acquired in the Trammell Crow Company acquisition 25.1 - Merger-related charges 34.7 - EBITDA 760.3 527.1 Add: 16.2 12.3 Less: 95.3 51.5 101.8 56.6 11.5 22.9 197.4 154.9 Net income 370.5 253.5 Revenue 5,081.5 3,501.7 Normalized EBITDA Margin 16.7% 15.2% Trailing Twelve Months Provision for income taxes Loss on extinguishment of debt Interest expense Depreciation and amortization Interest income |
|
|
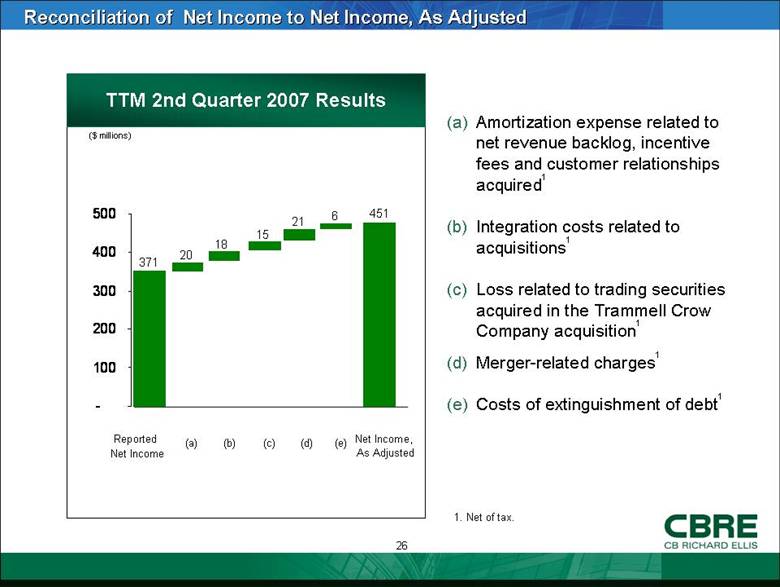
(a) Amortization expense related to net revenue backlog, incentive fees and customer relationships acquired1 (b) Integration costs related to acquisitions1 (c) Loss related to trading securities acquired in the Trammell Crow Company acquisition1 (d) Merger-related charges1 (e) Costs of extinguishment of debt1 Reconciliation of Net Income to Net Income, As Adjusted Net Income, As Adjusted TTM 2nd Quarter 2007 Results ($ millions) 371 451 20 18 Reported Net Income (a) (b) (c) 1. Net of tax. 15 21 (d) 6 (e) - 100 200 300 400 500 |
|
|
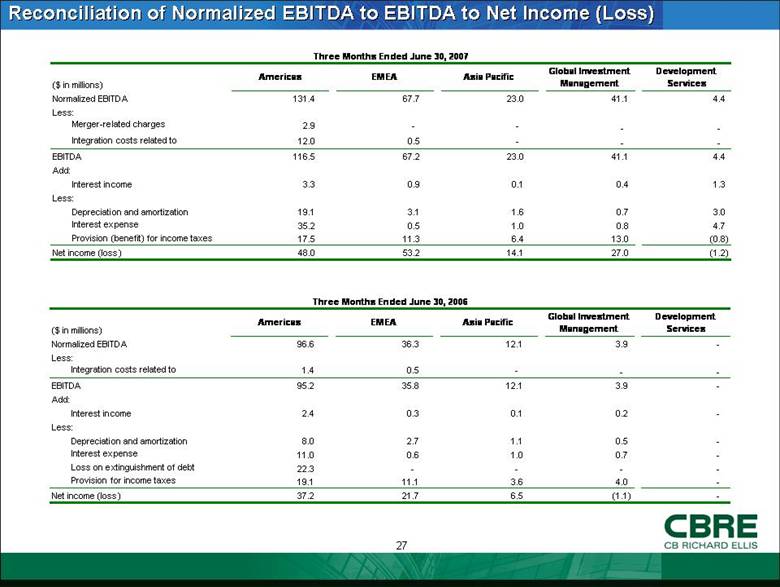
Reconciliation of Normalized EBITDA to EBITDA to Net Income (Loss) Three Months Ended June 30, 2006 ($ in millions) Americas EMEA Asia Pacific Global Investment Management Development Services Normalized EBITDA 96.6 36.3 12.1 3.9 - Less: Integration costs related to acquisitions 1.4 0.5 - - - EBITDA 95.2 35.8 12.1 3.9 - Add: Interest income 2.4 0.3 0.1 0.2 - Less: Depreciation and amortization 8.0 2.7 1.1 0.5 - Interest expense 11.0 0.6 1.0 0.7 - Loss on extinguishment of debt 22.3 - - - - Provision for income taxes 19.1 11.1 3.6 4.0 - Net income (loss) 37.2 21.7 6.5 (1.1) - ($ in millions) Americas EMEA Asia Pacific Global Investment Management Development Services Normalized EBITDA 131.4 67.7 23.0 41.1 4.4 267.6 Less: -Merger-related charges 2.9 - - - - 2.9 Integration costs related to acquisitions 12.0 0.5 - - - 12.5 EBITDA 116.5 67.2 23.0 41.1 4.4 252.2 Add: - Interest income 3.3 0.9 0.1 0.4 1.3 6.0 Less: - Depreciation and amortization 19.1 3.1 1.6 0.7 3.0 27.5 Interest expense 35.2 0.5 1.0 0.8 4.7 42.2 Provision (benefit) for income taxes 17.5 11.3 6.4 13.0 (0.8) 47.4 Net income (loss) 48.0 53.2 14.1 27.0 (1.2) 141.1 |
|
|
CBRE CB Richard Ellis |