Exhibit 99.1
|
|
Investor Presentation May 2007 |
Exhibit 99.1
|
|
Investor Presentation May 2007 |
|
|
Forward Looking Statements This presentation contains statements that are forward looking within the meaning of the Private Securities Litigation Reform Act of 1995, including statements regarding our growth momentum in 2007, future operations and future financial performance. These statements should be considered as estimates only and actual results may ultimately differ from these estimates. Except to the extent required by applicable securities laws, we undertake no obligation to update or publicly revise any of the forward-looking statements that you may hear today. Please refer to our current annual report on Form 10-K (in particular, “Risk Factors”) and our current quarterly report on Form 10-Q which are filed with the SEC and available at the SEC’s website (http://www.sec.gov), for a full discussion of the risks and other factors, that may impact any estimates that you may hear today. We may make certain statements during the course of this presentation which include references to “non-GAAP financial measures,” as defined by SEC regulations. As required by these regulations, we have provided reconciliations of these measures to what we believe are the most directly comparable GAAP measures, which are attached hereto within the appendix. |
|
|
Company Overview |
|
|
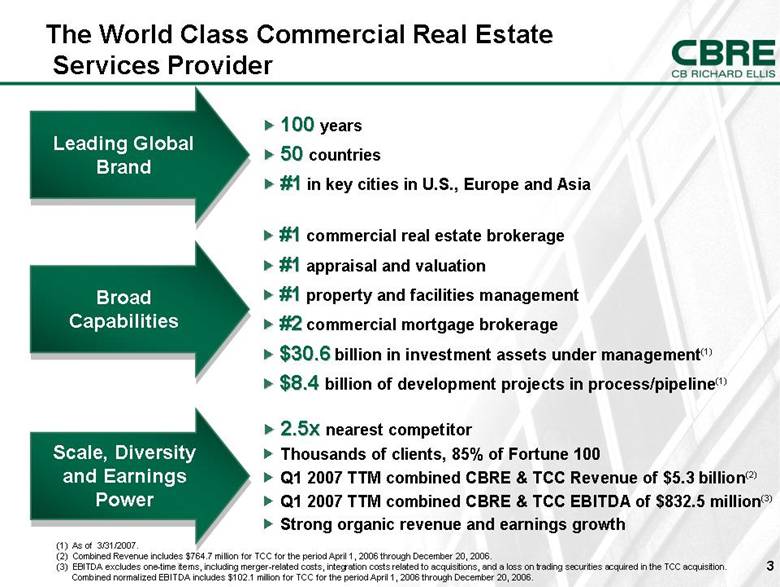
(1) As of 3/31/2007. (2) Combined Revenue includes $764.7 million for TCC for the period April 1, 2006 through December 20, 2006. (3) EBITDA excludes one-time items, including merger-related costs, integration costs related to acquisitions, and a loss on trading securities acquired in the TCC acquisition. Combined normalized EBITDA includes $102.1 million for TCC for the period April 1, 2006 through December 20, 2006. 2.5x nearest competitor Thousands of clients, 85% of Fortune 100 Q1 2007 TTM combined CBRE & TCC Revenue of $5.3 billion(2) Q1 2007 TTM combined CBRE & TCC EBITDA of $832.5 million(3) Strong organic revenue and earnings growth #1 commercial real estate brokerage #1 appraisal and valuation #1 property and facilities management #2 commercial mortgage brokerage $30.6 billion in investment assets under management(1) $8.4 billion of development projects in process/pipeline(1) Leading Global Brand Broad Capabilities Scale, Diversity and Earnings Power 100 years 50 countries #1 in key cities in U.S., Europe and Asia The World Class Commercial Real Estate Services Provider |
|
|
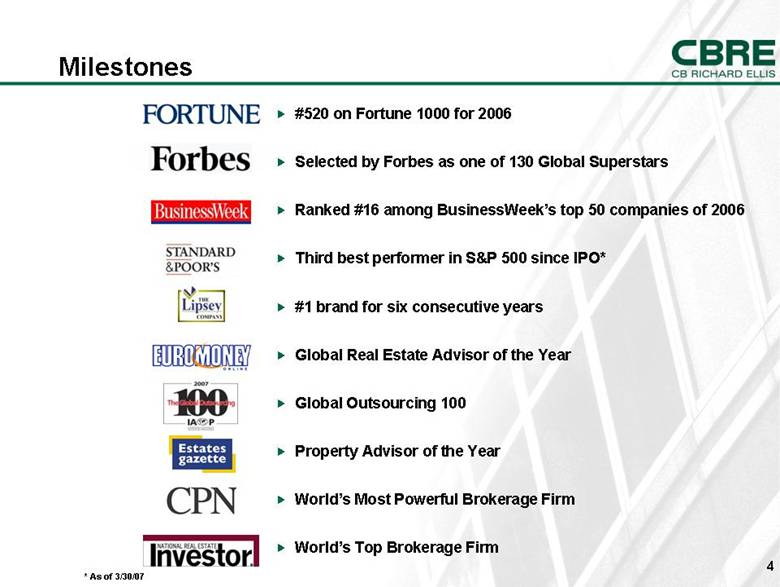
Milestones #520 on Fortune 1000 for 2006 Selected by Forbes as one of 130 Global Superstars Ranked #16 among BusinessWeek’s top 50 companies of 2006 Third best performer in S&P 500 since IPO* #1 brand for six consecutive years Global Real Estate Advisor of the Year Global Outsourcing 100 Property Advisor of the Year World’s Most Powerful Brokerage Firm World’s Top Brokerage Firm * As of 3/30/07 |
|
|
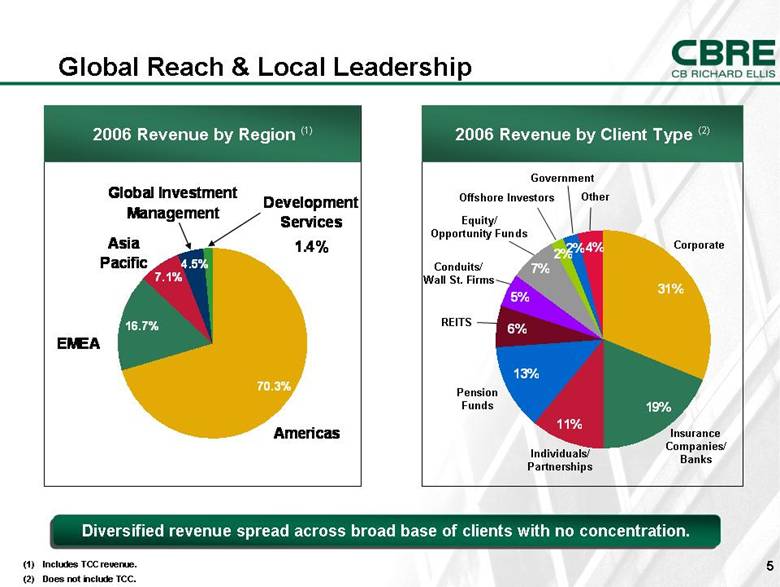
Global Reach & Local Leadership Individuals/Partnerships 2006 Revenue by Client Type (2) Corporate REITS Insurance Companies/Banks Pension Funds Government Other Conduits/Wall St. Firms Equity/Opportunity Funds Offshore Investors 2006 Revenue by Region (1) Diversified revenue spread across broad base of clients with no concentration. (1) Includes TCC revenue. (2) Does not include TCC. 4.5% 7.1% 1.4% 70.3% 16.7% Development Services EMEA Asia Pacific Americas Global Investment Management 4% 2% 2% 13% 6% 5% 7% 31% 19% 11% |
|
|
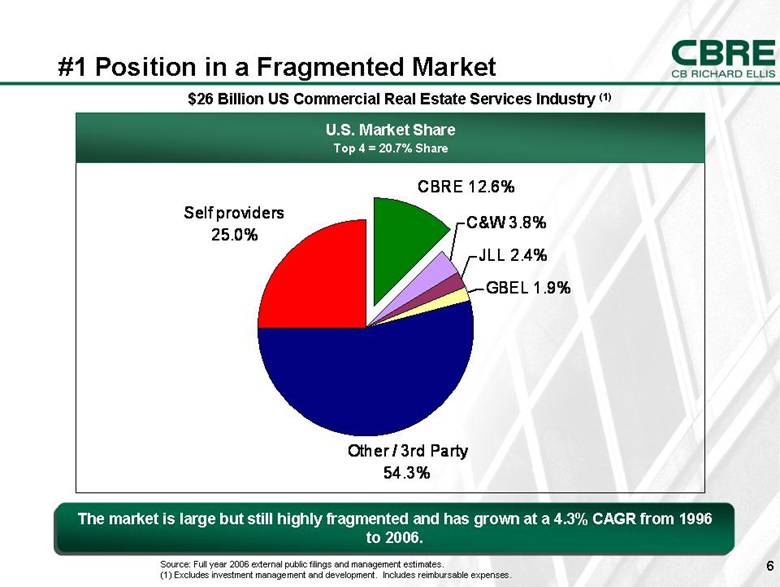
#1 Position in a Fragmented Market $26 Billion US Commercial Real Estate Services Industry (1) U.S. Market Share Top 4 = 20.7% Share Source: Full year 2006 external public filings and management estimates. (1) Excludes investment management and development. Includes reimbursable expenses. The market is large but still highly fragmented and has grown at a 4.3% CAGR from 1996 to 2006. Self providers 25.0% CBRE 12.6% C&W 3.8% JLL 2.4% GBEL 1.9% Other / 3rd Party 54.3% |
|
|
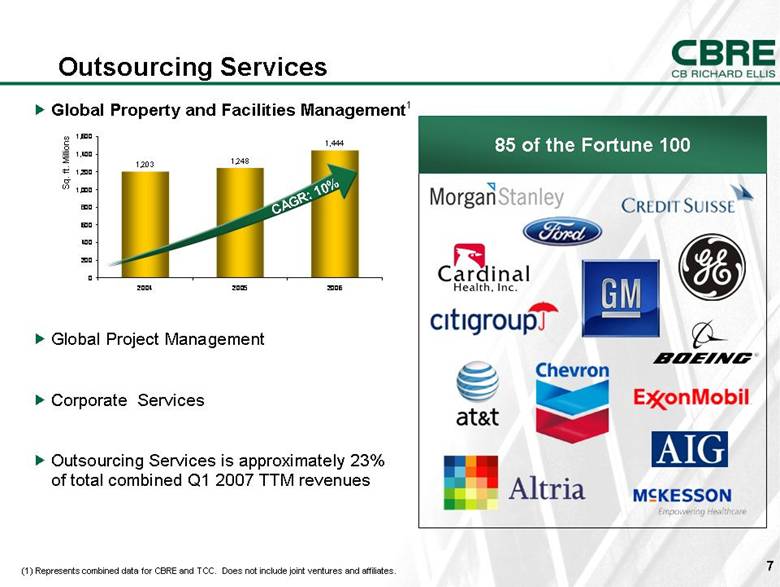
Outsourcing Services 85 of the Fortune 100 Sq. ft. Millions CAGR: 10% Global Property and Facilities Management1 Global Project Management Corporate Services Outsourcing Services is approximately 23% of total combined Q1 2007 TTM revenues (1) Represents combined data for CBRE and TCC. Does not include joint ventures and affiliates. |
|
|
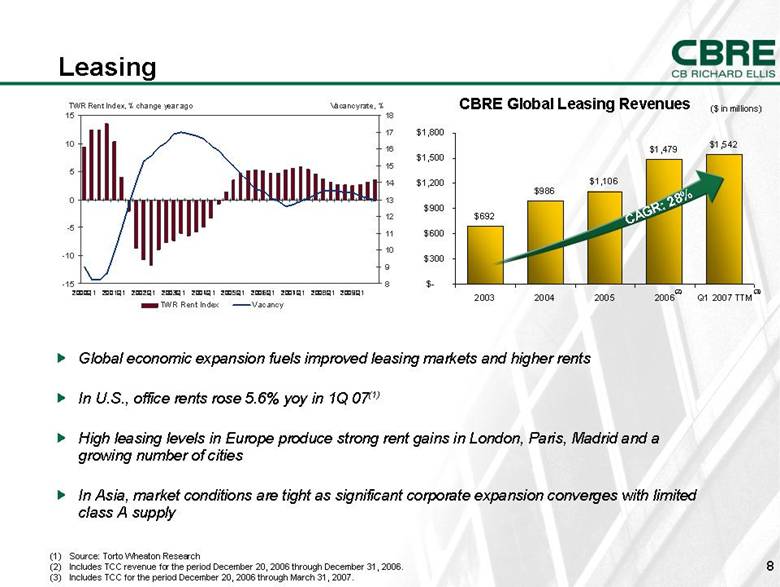
Global economic expansion fuels improved leasing markets and higher rents In U.S., office rents rose 5.6% yoy in 1Q 07(1) High leasing levels in Europe produce strong rent gains in London, Paris, Madrid and a growing number of cities In Asia, market conditions are tight as significant corporate expansion converges with limited class A supply Source: Torto Wheaton Research Includes TCC revenue for the period December 20, 2006 through December 31, 2006. Includes TCC for the period December 20, 2006 through March 31, 2007. Leasing CAGR: 28% CBRE Global Leasing Revenues ($ in millions) (2) (3) $692 $986 $1,106 $1,479 $1,542 $- $300 $600 $900 $1,200 $1,500 $1,800 2003 2004 2005 2006 Q1 2007 TTM -15 -10 -5 0 5 10 15 2000Q1 2001Q1 2002Q1 2003Q1 2004Q1 2005Q1 2006Q1 2007Q1 2008Q1 2009Q1 8 9 10 11 12 13 14 15 16 17 18 TWR Rent Index Vacancy TWR Rent Index, % change year ago Vacancy rate, % |
|
|
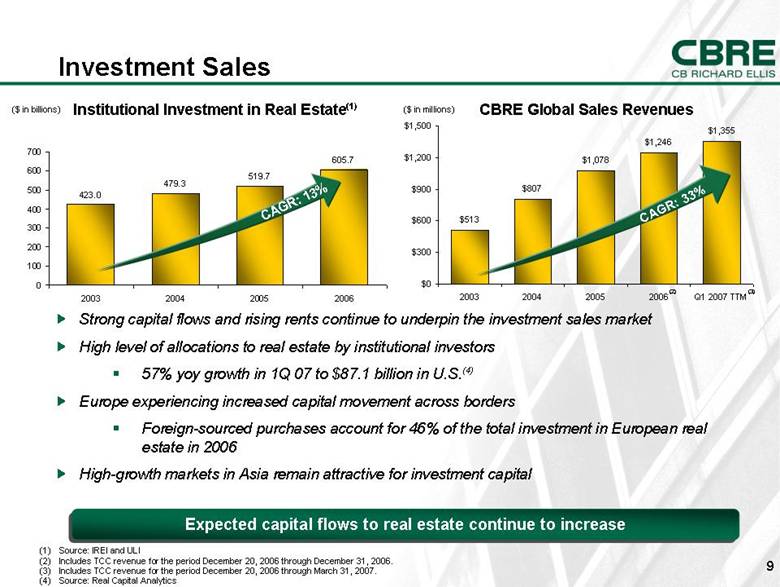
(1) Source: IREI and ULI Includes TCC revenue for the period December 20, 2006 through December 31, 2006. Includes TCC revenue for the period December 20, 2006 through March 31, 2007. Source: Real Capital Analytics Investment Sales Strong capital flows and rising rents continue to underpin the investment sales market High level of allocations to real estate by institutional investors 57% yoy growth in 1Q 07 to $87.1 billion in U.S.(4) Europe experiencing increased capital movement across borders Foreign-sourced purchases account for 46% of the total investment in European real estate in 2006 High-growth markets in Asia remain attractive for investment capital ($ in billions) CAGR: 13% Expected capital flows to real estate continue to increase CAGR: 33% ($ in millions) CBRE Global Sales Revenues Institutional Investment in Real Estate(1) (2) (3) $513 $807 $1,078 $1,246 $1,355 $0 $300 $600 $900 $1,200 $1,500 2003 2004 2005 2006 Q1 2007 TTM 423.0 479.3 519.7 605.7 0 100 200 300 400 500 600 700 2003 2004 2005 2006 |
|
|
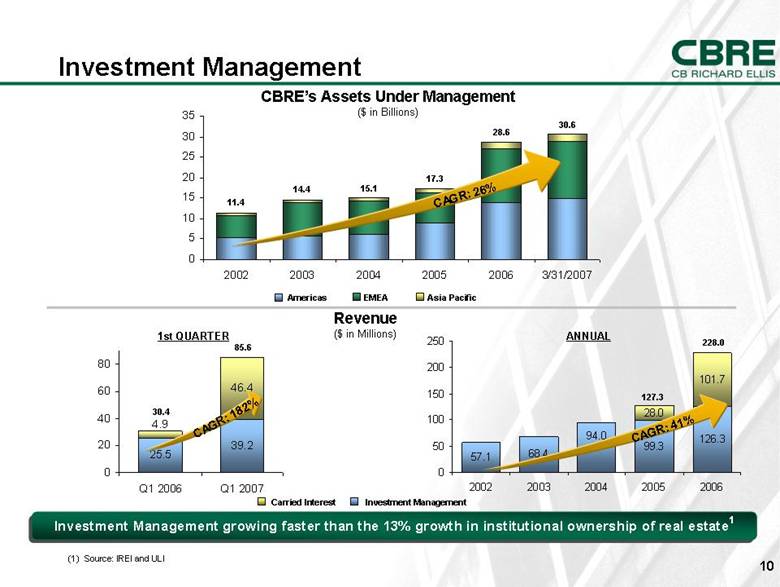
Investment Management Americas EMEA Asia Pacific Investment Management growing faster than the 13% growth in institutional ownership of real estate1 CBRE’s Assets Under Management ($ in Billions) Revenue ($ in Millions) (1) Source: IREI and ULI CAGR: 41% 127.3 228.0 CAGR: 26% Carried Interest Investment Management 17.3 28.6 15.1 11.4 14.4 ANNUAL 1st QUARTER 85.6 30.4 CAGR: 182% 30.6 0 5 10 15 20 25 30 35 2002 2003 2004 2005 2006 3/31/2007 57.1 68.4 99.3 126.3 28.0 101.7 94.0 0 50 100 150 200 250 2002 2003 2004 2005 2006 46.4 25.5 39.2 4.9 0 20 40 60 80 Q1 2006 Q1 2007 |
|
|
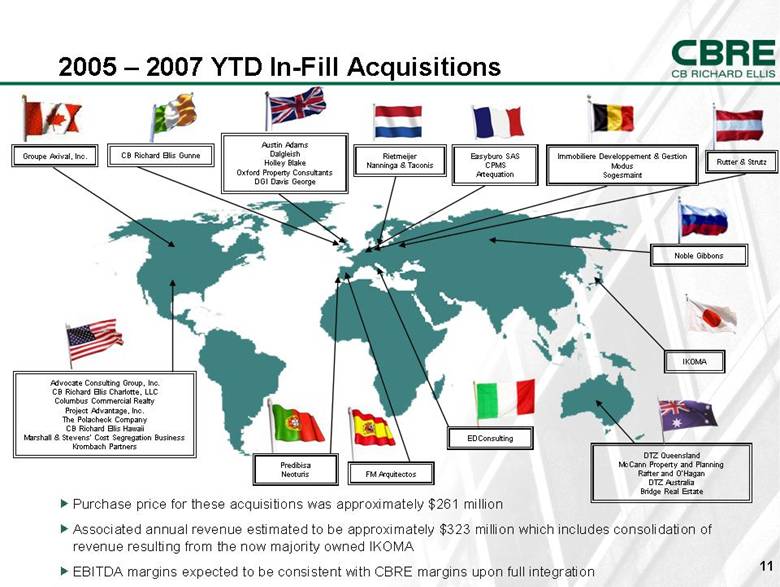
2005 – 2007 YTD In-Fill Acquisitions Easyburo SAS CPMS Artequation DTZ Queensland McCann Property and Planning Rafter and O’Hagan DTZ Australia Bridge Real Estate Advocate Consulting Group, Inc. CB Richard Ellis Charlotte, LLC Columbus Commercial Realty Project Advantage, Inc. The Polacheck Company CB Richard Ellis Hawaii Marshall & Stevens’ Cost Segregation Business Krombach Partners Rutter & Strutz Groupe Axival, Inc. Noble Gibbons IKOMA Purchase price for these acquisitions was approximately $261 million Associated annual revenue estimated to be approximately $323 million which includes consolidation of revenue resulting from the now majority owned IKOMA EBITDA margins expected to be consistent with CBRE margins upon full integration CB Richard Ellis Gunne Immobiliere Developpement & Gestion Modus Sogesmaint Austin Adams Dalgleish Holley Blake Oxford Property Consultants DGI Davis George Predibisa Neoturis Rietmeijer Nanninga & Taconis EDConsulting FM Arquitectos |
|
|
Trammell Crow Company Acquisition Business is comprised of: Global Corporate Services (GCS) and Development Services GCS consists of the following businesses: Property & Facilities Management Project Management Corporate Advisory Transaction Management Statistics # of Employees – 7,600 # of Offices – 71 Revenue of approximately $1 billion Further diversification of revenue mix Significant revenue synergy potential Complementary alignment, in particular our strength in Transaction Management is a perfect match with their strength in Property & Facilities Management and other outsourcing services Enhances operating leverage potential Transaction expected to produce net synergies of $65M Projected EPS accretion in the low teens |
|
|
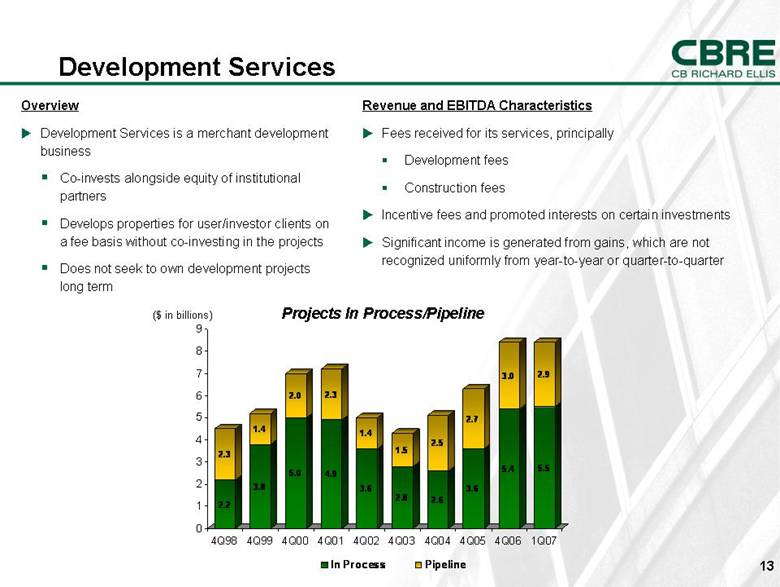
Development Services Overview Development Services is a merchant development business Co-invests alongside equity of institutional partners Develops properties for user/investor clients on a fee basis without co-investing in the projects Does not seek to own development projects long term Revenue and EBITDA Characteristics Fees received for its services, principally Development fees Construction fees Incentive fees and promoted interests on certain investments Significant income is generated from gains, which are not recognized uniformly from year-to-year or quarter-to-quarter ($ in billions) Projects In Process/Pipeline 2.2 2.3 3.8 1.4 5.0 2.0 4.9 2.3 3.6 1.4 2.8 1.5 2.6 2.5 3.6 2.7 5.4 3.0 5.5 2.9 0 1 2 3 4 5 6 7 8 9 4Q98 4Q99 4Q00 4Q01 4Q02 4Q03 4Q04 4Q05 4Q06 1Q07 In Process Pipeline |
|
|
Financial Overview |
|
|
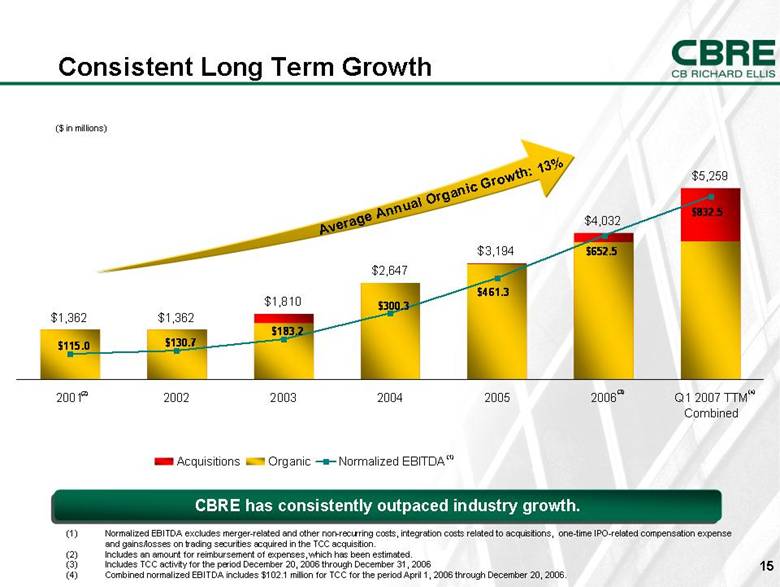
Consistent Long Term Growth CBRE has consistently outpaced industry growth. Normalized EBITDA excludes merger-related and other non-recurring costs, integration costs related to acquisitions, one-time IPO-related compensation expense and gains/losses on trading securities acquired in the TCC acquisition. Includes an amount for reimbursement of expenses, which has been estimated. Includes TCC activity for the period December 20, 2006 through December 31, 2006 Combined normalized EBITDA includes $102.1 million for TCC for the period April 1, 2006 through December 20, 2006. ($ in millions) Average Annual Organic Growth: 13% (1) (2) (3) (4) $1,362 $1,362 $1,810 $2,647 $3,194 $4,032 $5,259 $832.5 $115.0 $130.7 $183.2 $300.3 $461.3 $652.5 2001 2002 2003 2004 2005 2006 Q1 2007 TTM Combined Acquisitions Organic Normalized EBITDA |
|
|
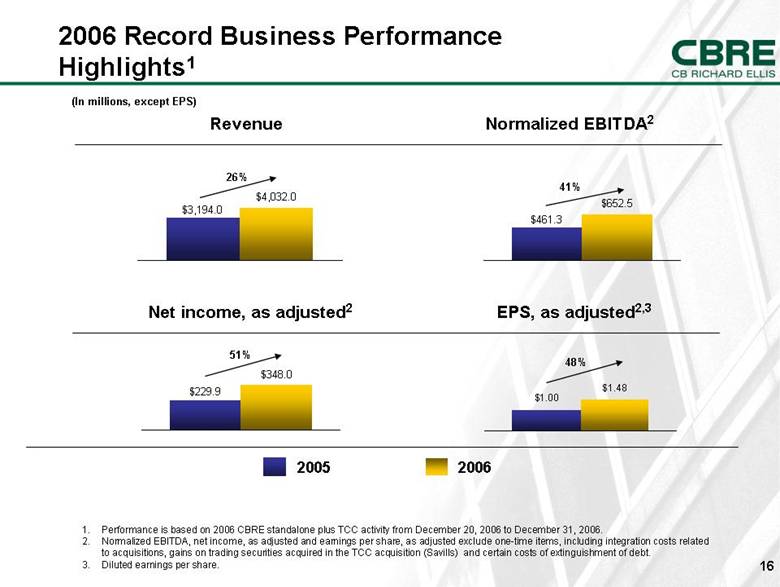
2006 Record Business Performance Highlights1 2005 2006 26% (In millions, except EPS) 41% Revenue Normalized EBITDA2 51% 48% Net income, as adjusted2 EPS, as adjusted2,3 Performance is based on 2006 CBRE standalone plus TCC activity from December 20, 2006 to December 31, 2006. Normalized EBITDA, net income, as adjusted and earnings per share, as adjusted exclude one-time items, including integration costs related to acquisitions, gains on trading securities acquired in the TCC acquisition (Savills) and certain costs of extinguishment of debt. 3. Diluted earnings per share. $1.00 $1.48 $348.0 $229.9 $652.5 $461.3 |
|
|
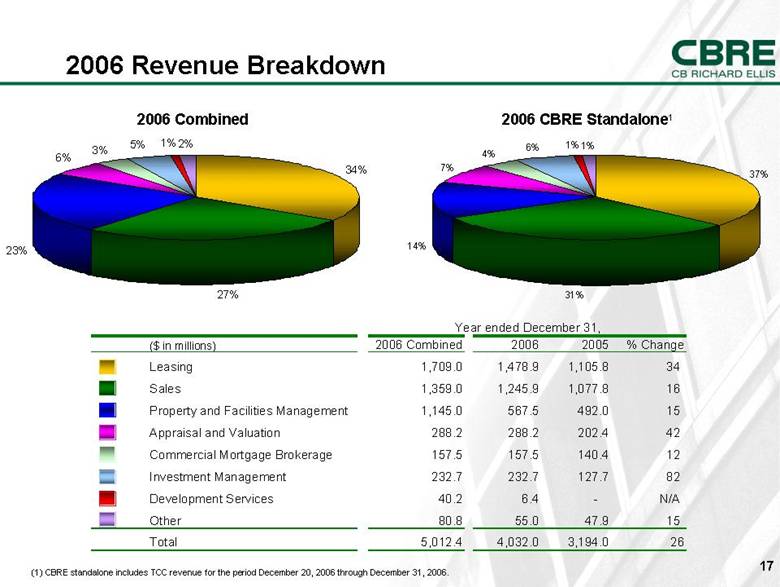
2006 Revenue Breakdown 2006 CBRE Standalone1 2006 Combined (1) CBRE standalone includes TCC revenue for the period December 20, 2006 through December 31, 2006. 34% 27% 23% 6% 3% 5% 1% 2% 37% 31% 14% 7% 4% 6% 1% 1% ($ in millions) 2006 Combined 2006 2005 % Change Leasing 1,709.0 1,478.9 1,105.8 34 Sales 1,359.0 1,245.9 1,077.8 16 Property and Facilities Management 1,145.0 567.5 492.0 15 Appraisal and Valuation 288.2 288.2 202.4 42 Commercial Mortgage Brokerage 157.5 157.5 140.4 12 Investment Management 232.7 232.7 127.7 82 Development Services 40.2 6.4 - N/A Other 80.8 55.0 47.9 15 Total 5,012.4 4,032.0 3,194.0 26 Year ended December 31, |
|
|
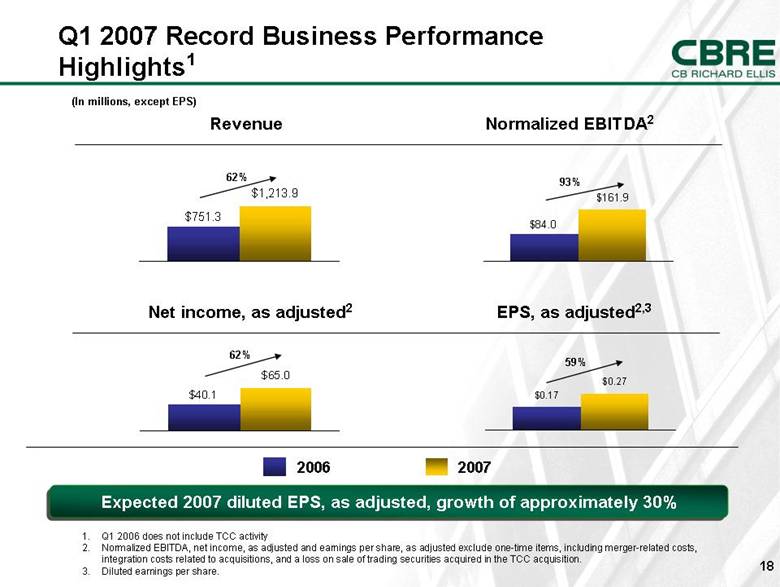
Q1 2007 Record Business Performance Highlights1 2006 2007 62% (In millions, except EPS) 93% Revenue Normalized EBITDA2 62% 59% Net income, as adjusted2 EPS, as adjusted2,3 Q1 2006 does not include TCC activity Normalized EBITDA, net income, as adjusted and earnings per share, as adjusted exclude one-time items, including merger-related costs, integration costs related to acquisitions, and a loss on sale of trading securities acquired in the TCC acquisition. 3. Diluted earnings per share. Expected 2007 diluted EPS, as adjusted, growth of approximately 30% $161.9 $84.0 $65.0 $40.1 $1,213.9 $751.3 $0.17 $0.27 |
|
|
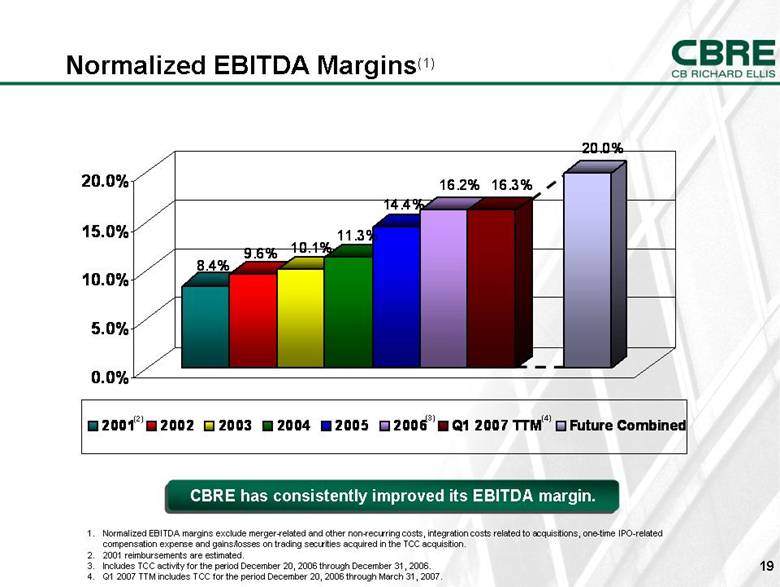
Normalized EBITDA Margins(1) CBRE has consistently improved its EBITDA margin. Normalized EBITDA margins exclude merger-related and other non-recurring costs, integration costs related to acquisitions, one-time IPO-related compensation expense and gains/losses on trading securities acquired in the TCC acquisition. 2001 reimbursements are estimated. Includes TCC activity for the period December 20, 2006 through December 31, 2006. Q1 2007 TTM includes TCC for the period December 20, 2006 through March 31, 2007. (2) (3) (4) 8.4% 9.6% 10.1% 11.3% 14.4% 16.2% 16.3% 20.0% 0.0% 5.0% 10.0% 15.0% 20.0% 2001 2002 2003 2004 2005 2006 Q1 2007 TTM Future Combined |
|
|
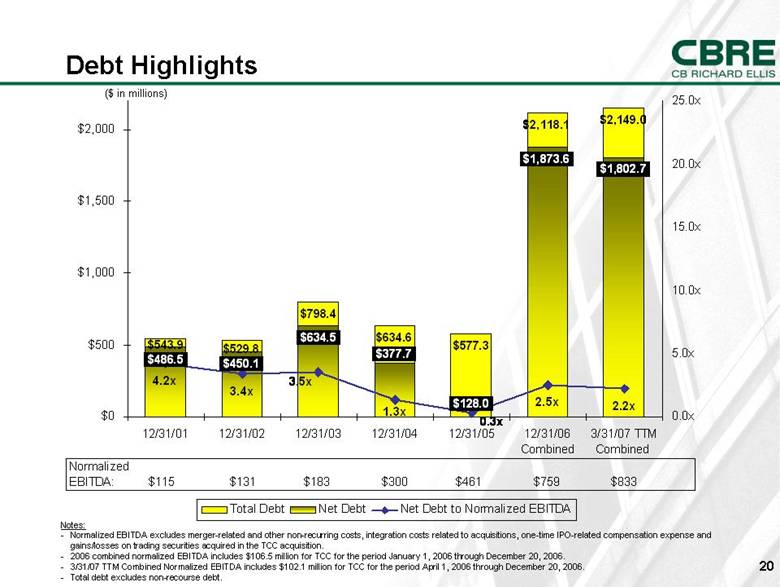
($ in millions) Debt Highlights Notes: Normalized EBITDA excludes merger-related and other non-recurring costs, integration costs related to acquisitions, one-time IPO-related compensation expense and gains/losses on trading securities acquired in the TCC acquisition. 2006 combined normalized EBITDA includes $106.5 million for TCC for the period January 1, 2006 through December 20, 2006. 3/31/07 TTM Combined Normalized EBITDA includes $102.1 million for TCC for the period April 1, 2006 through December 20, 2006. Total debt excludes non-recourse debt. $798.4 $634.6 $577.3 $2,118.1 $2,149.0 $450.1 $634.5 $128.0 $1,873.6 $1,802.7 $543.9 $529.8 $377.7 $486.5 4.2x 3.4x 2.5x 2.2x 1.3x 0.3x 3.5x $0 $500 $1,000 $1,500 $2,000 12/31/01 12/31/02 12/31/03 12/31/04 12/31/05 12/31/06 Combined 3/31/07 TTM Combined 0.0x 5.0x 10.0x 15.0x 20.0x 25.0x Total Debt Net Debt Net Debt to Normalized EBITDA Normalized EBITDA: $115 $131 $183 $300 $461 $759 $833 |
|
|
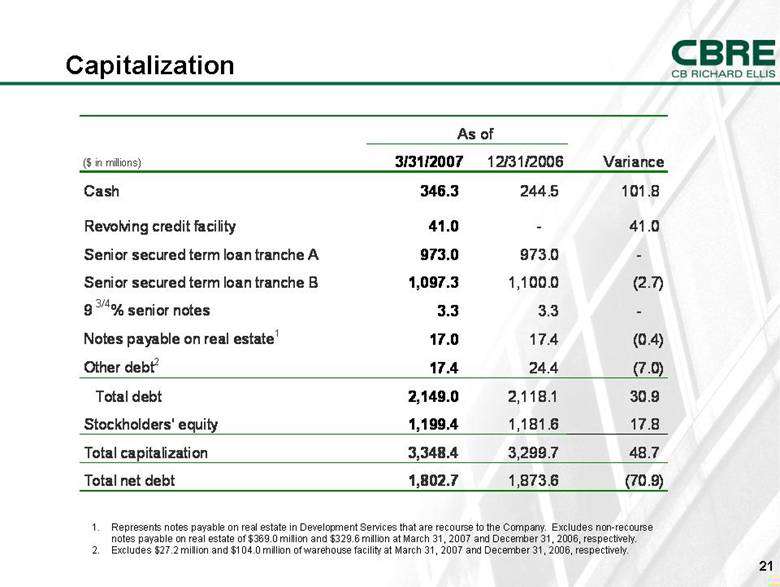
Capitalization Represents notes payable on real estate in Development Services that are recourse to the Company. Excludes non-recourse notes payable on real estate of $369.0 million and $329.6 million at March 31, 2007 and December 31, 2006, respectively. Excludes $27.2 million and $104.0 million of warehouse facility at March 31, 2007 and December 31, 2006, respectively. ($ in millions) 3/31/2007 12/31/2006 Variance Cash 346.3 244.5 101.8 Revolving credit facility 41.0 - 41.0 Senior secured term loan tranche A 973.0 973.0 - Senior secured term loan tranche B 1,097.3 1,100.0 (2.7) 9 3/4 % senior notes 3.3 3.3 - Notes payable on real estate 1 17.0 17.4 (0.4) Other debt 2 17.4 24.4 (7.0) Total debt 2,149.0 2,118.1 30.9 Stockholders' equity 1,199.4 1,181.6 17.8 Total capitalization 3,348.4 3,299.7 48.7 Total net debt 1,802.7 1,873.6 (70.9) As of |
|
|
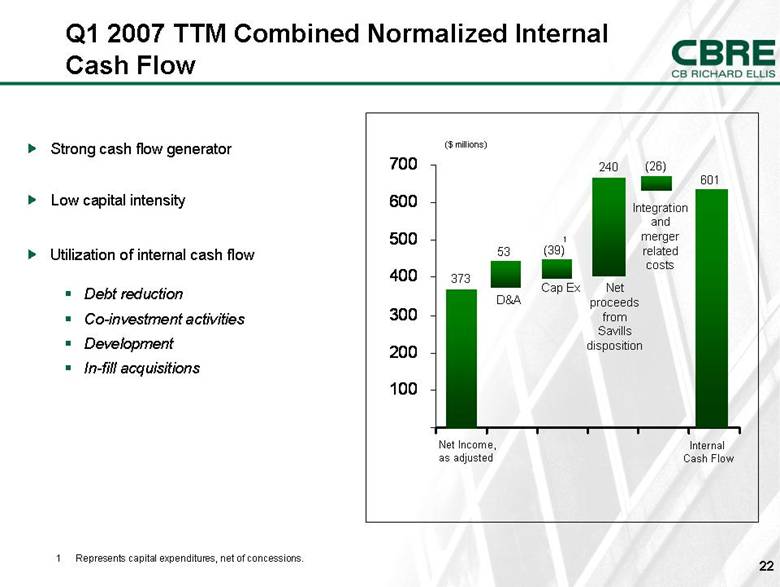
Strong cash flow generator Low capital intensity Utilization of internal cash flow Debt reduction Co-investment activities Development In-fill acquisitions 1 Represents capital expenditures, net of concessions. Q1 2007 TTM Combined Normalized Internal Cash Flow ($ millions) 373 Net Income, as adjusted D&A Cap Ex (39) 601 Internal Cash Flow 1 53 240 (26) Net proceeds from Savills disposition Integration and merger related costs - 100 200 300 400 500 600 700 |
|
|
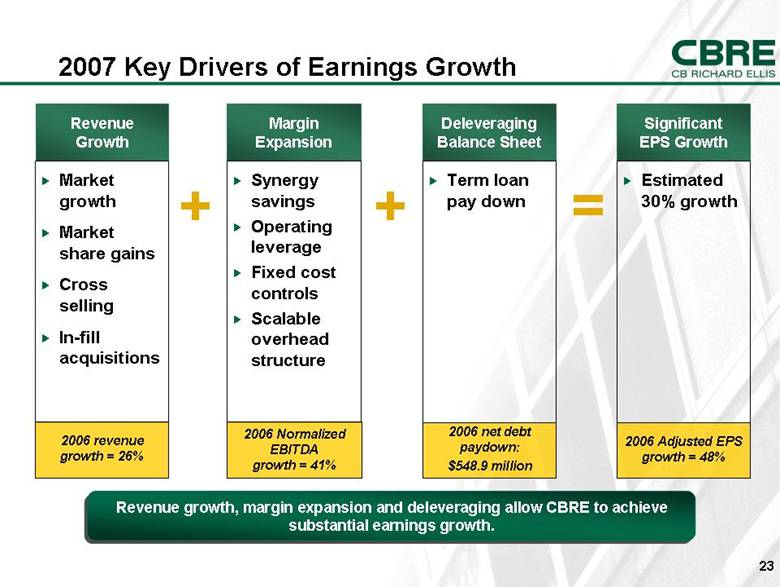
2007 Key Drivers of Earnings Growth Revenue Growth Margin Expansion Market growth Market share gains Cross selling In-fill acquisitions Synergy savings Operating leverage Fixed cost controls Scalable overhead structure Deleveraging Balance Sheet Term loan pay down Revenue growth, margin expansion and deleveraging allow CBRE to achieve substantial earnings growth. = + + Significant EPS Growth Estimated 30% growth 2006 revenue growth = 26% 2006 Normalized EBITDA growth = 41% 2006 net debt paydown: $548.9 million 2006 Adjusted EPS growth = 48% |
|
|
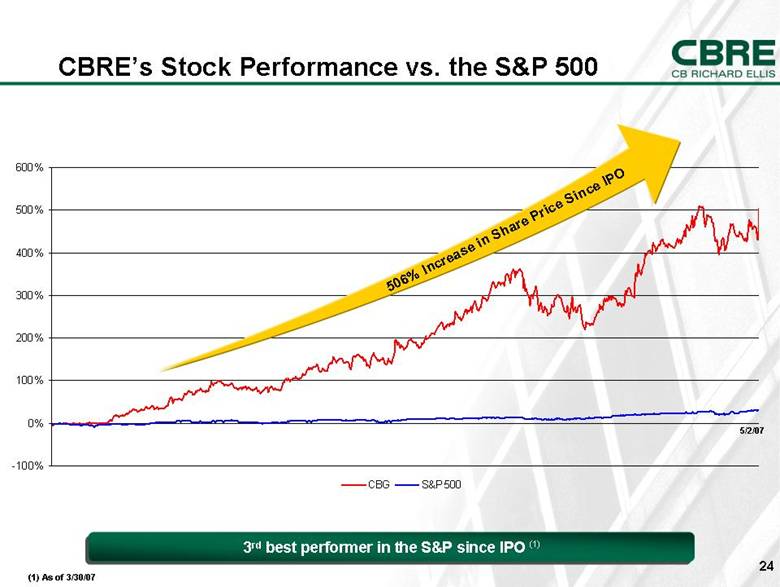
506% Increase in Share Price Since IPO CBRE’s Stock Performance vs. the S&P 500 3rd best performer in the S&P since IPO (1) 5/2/07 (1) As of 3/30/07 -100% 0% 100% 200% 300% 400% 500% 600% CBG S&P 500 |
|
|
Appendix |
|
|
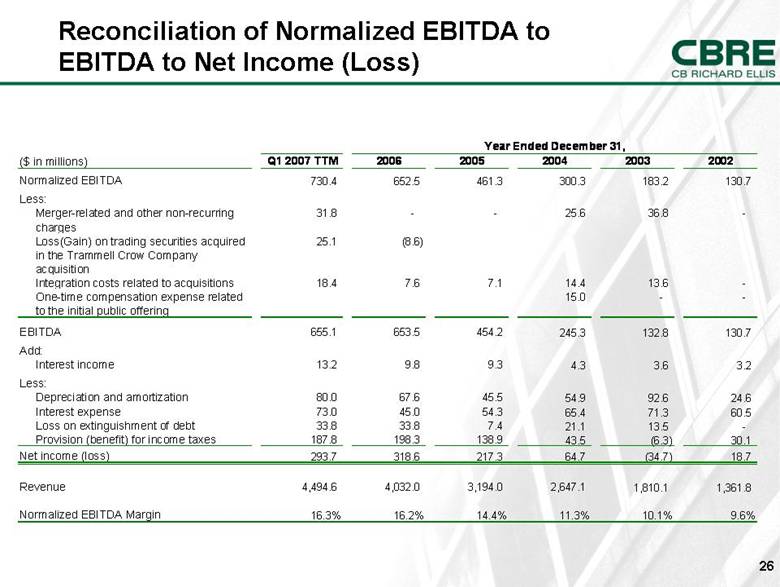
Reconciliation of Normalized EBITDA to EBITDA to Net Income (Loss) ($ in millions) Q1 2007 TTM 2006 2005 2004 2003 2002 Normalized EBITDA 730.4 652.5 461.3 300.3 183.2 130.7 Less: Merger-related and other non-recurring charges 31.8 - - 25.6 36.8 - Loss(Gain) on trading securities acquired in the Trammell Crow Company acquisition 25.1 (8.6) Integration costs related to acquisitions 18.4 7.6 7.1 14.4 13.6 - One-time compensation expense related to the initial public offering 15.0 - - EBITDA 655.1 653.5 454.2 245.3 132.8 130.7 Add: 13.2 9.8 9.3 4.3 3.6 3.2 Less: 80.0 67.6 45.5 54.9 92.6 24.6 73.0 45.0 54.3 65.4 71.3 60.5 33.8 33.8 7.4 21.1 13.5 - 187.8 198.3 138.9 43.5 (6.3) 30.1 Net income (loss) 293.7 318.6 217.3 64.7 (34.7) 18.7 Revenue 4,494.6 4,032.0 3,194.0 2,647.1 1,810.1 1,361.8 Normalized EBITDA Margin 16.3% 16.2% 14.4% 11.3% 10.1% 9.6% Year Ended December 31, Provision (benefit) for income taxes Loss on extinguishment of debt Interest expense Depreciation and amortization Interest income |
|
|
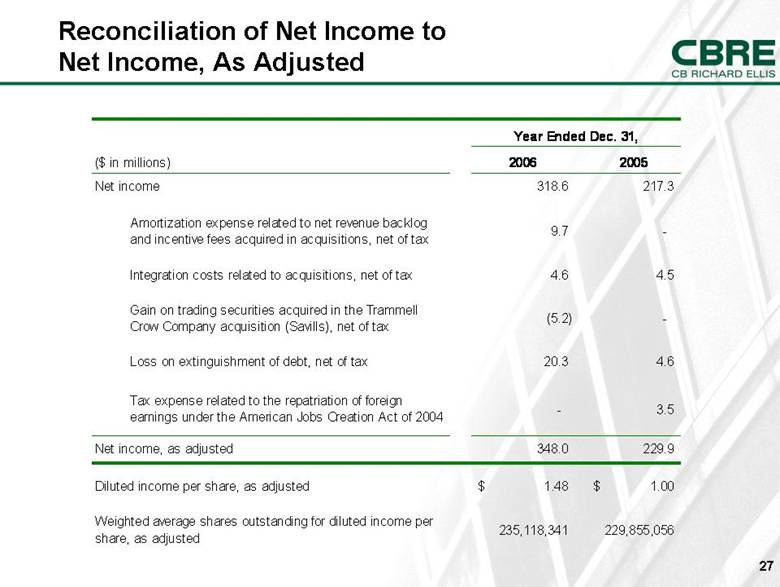
Reconciliation of Net Income to Net Income, As Adjusted Year Ended Dec. 31, ($ in millions) 2006 2005 Net income 318.6 217.3 Amortization expense related to net revenue backlog and incentive fees acquired in acquisitions, net of tax 9.7 - Integration costs related to acquisitions, net of tax 4.6 4.5 Gain on trading securities acquired in the Trammell Crow Company acquisition (Savills), net of tax (5.2) - Loss on extinguishment of debt, net of tax 20.3 4.6 Tax expense related to the repatriation of foreign earnings under the American Jobs Creation Act of 2004 - 3.5 Net income, as adjusted 348.0 229.9 Diluted income per share, as adjusted $ 1.48 $ 1.00 Weighted average shares outstanding for diluted income per share, as adjusted 235,118,341 229,855,056 |
|
|
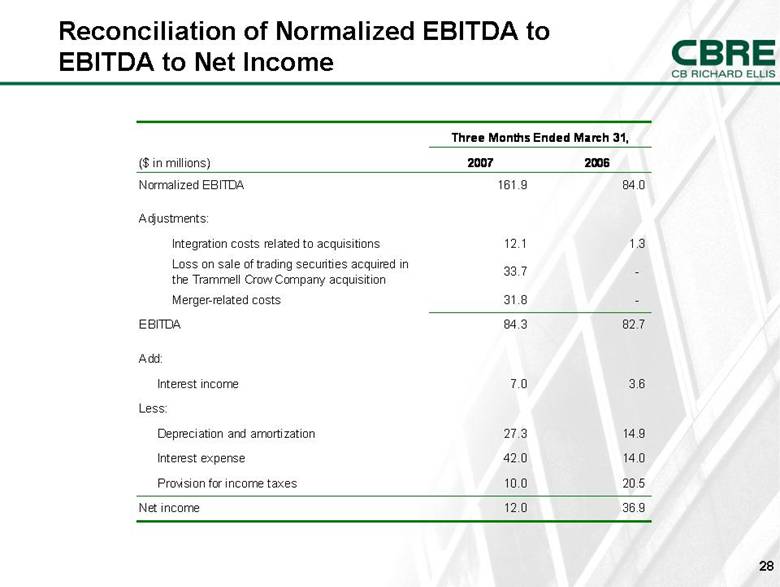
Reconciliation of Normalized EBITDA to EBITDA to Net Income ($ in millions) 2007 2006 Normalized EBITDA 161.9 84.0 Adjustments: Integration costs related to acquisitions 12.1 1.3 Loss on sale of trading securities acquired in the Trammell Crow Company acquisition 33.7 - Merger-related costs 31.8 - EBITDA 84.3 82.7 Add: 7.0 3.6 Less: 27.3 14.9 42.0 14.0 10.0 20.5 Net income 12.0 36.9 Three Months Ended March 31, Provision for income taxes Interest expense Depreciation and amortization Interest income |
|
|
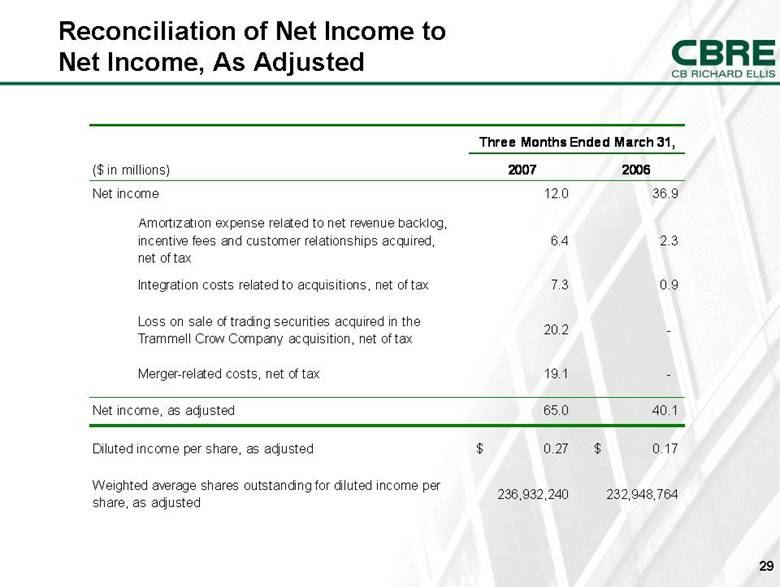
Reconciliation of Net Income to Net Income, As Adjusted ($ in millions) 2007 2006 Net income 12.0 36.9 Amortization expense related to net revenue backlog, incentive fees and customer relationships acquired, net of tax 6.4 2.3 Integration costs related to acquisitions, net of tax 7.3 0.9 Loss on sale of trading securities acquired in the Trammell Crow Company acquisition, net of tax 20.2 - Merger-related costs, net of tax 19.1 - Net income, as adjusted 65.0 40.1 Diluted income per share, as adjusted $ 0.27 $ 0.17 Weighted average shares outstanding for diluted income per share, as adjusted 236,932,240 232,948,764 Three Months Ended March 31, |
|
|
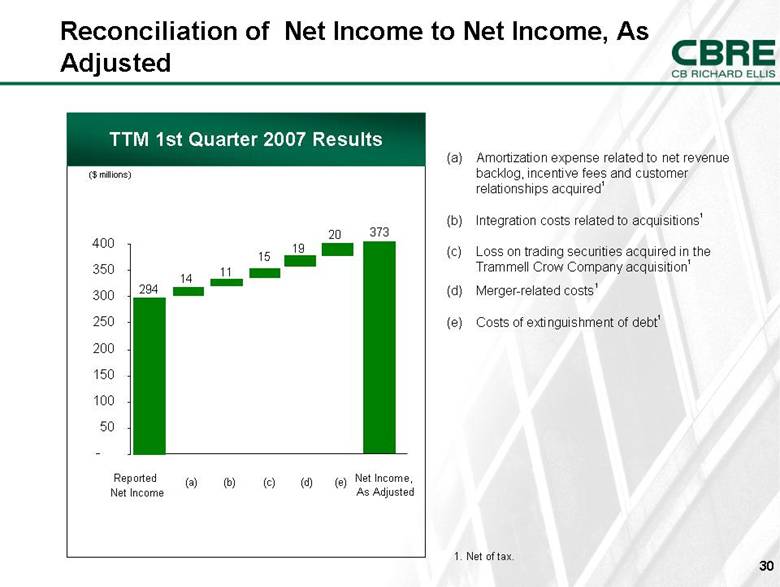
(a) Amortization expense related to net revenue backlog, incentive fees and customer relationships acquired1 (b) Integration costs related to acquisitions1 (c) Loss on trading securities acquired in the Trammell Crow Company acquisition1 (d) Merger-related costs1 (e) Costs of extinguishment of debt1 Reconciliation of Net Income to Net Income, As Adjusted Net Income, As Adjusted TTM 1st Quarter 2007 Results ($ millions) 294 373 14 11 Reported Net Income (a) (b) (c) 1. Net of tax. 15 19 (d) 20 (e) - 50 100 150 200 250 300 350 400 |
|
|
|