Exhibit 99.2
|
|
CB Richard Ellis Group, Inc. First Quarter 2007 Earnings Conference Call May 2, 2007 |
Exhibit 99.2
|
|
CB Richard Ellis Group, Inc. First Quarter 2007 Earnings Conference Call May 2, 2007 |
|
|
Forward Looking Statements This presentation contains statements that are forward looking within the meaning of the Private Securities Litigation Reform Act of 1995, including statements regarding our growth momentum in 2007, future operations, the impact of acquisitions and future financial performance. These statements should be considered as estimates only and actual results may ultimately differ from these estimates. Except to the extent required by applicable securities laws, we undertake no obligation to update or publicly revise any of the forward-looking statements that you may hear today. Please refer to our current annual report on Form 10-K (in particular, Risk Factors), which is filed with the SEC and available at the SEC’s website (http://www.sec.gov), for a full discussion of the risks and other factors that may impact any estimates that you may hear today. We may make certain statements during the course of this presentation which include references to “non-GAAP financial measures,” as defined by SEC regulations. As required by these regulations, we have provided reconciliations of these measures to what we believe are the most directly comparable GAAP measures, which are attached hereto within the appendix. |
|
|
Conference Call Participants Brett White, President and Chief Executive Officer Kenneth J. Kay, Sr. Executive Vice President & Chief Financial Officer Diane Paddison, President, Global Corporate Services - Client Accounts Shelley Young, Director, Investor Relations |
|
|
Q1 2007 Summary Record performance underscores the significant power of the enhanced global platform and initial success in integrating the Trammell Crow Company Continued growth in the outsourcing business through major account wins and expansion of existing client relationships Exceptional performance from the Global Investment Management segment |
|
|
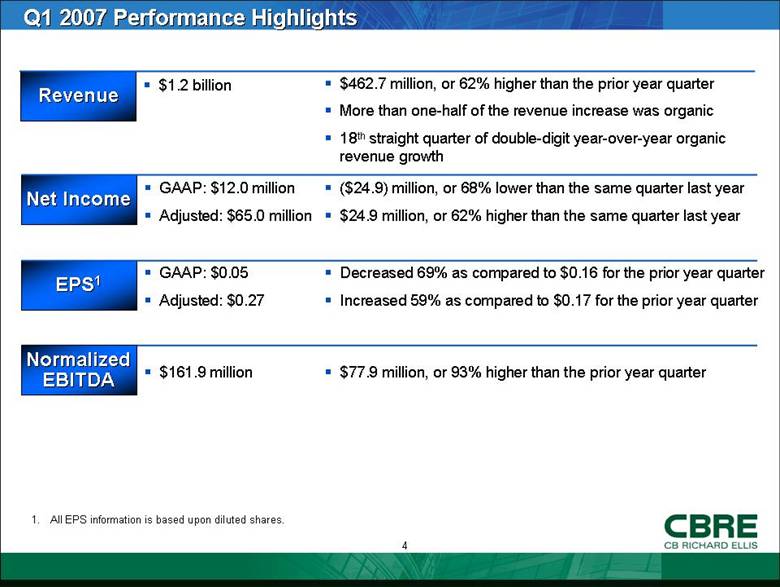
Q1 2007 Performance Highlights Revenue $1.2 billion $462.7 million, or 62% higher than the prior year quarter More than one-half of the revenue increase was organic 18th straight quarter of double-digit year-over-year organic revenue growth ($24.9) million, or 68% lower than the same quarter last year $24.9 million, or 62% higher than the same quarter last year GAAP: $12.0 million Adjusted: $65.0 million Decreased 69% as compared to $0.16 for the prior year quarter Increased 59% as compared to $0.17 for the prior year quarter GAAP: $0.05 Adjusted: $0.27 $77.9 million, or 93% higher than the prior year quarter $161.9 million Net Income EPS1 NormalizedEBITDA 1. All EPS information is based upon diluted shares. |
|
|
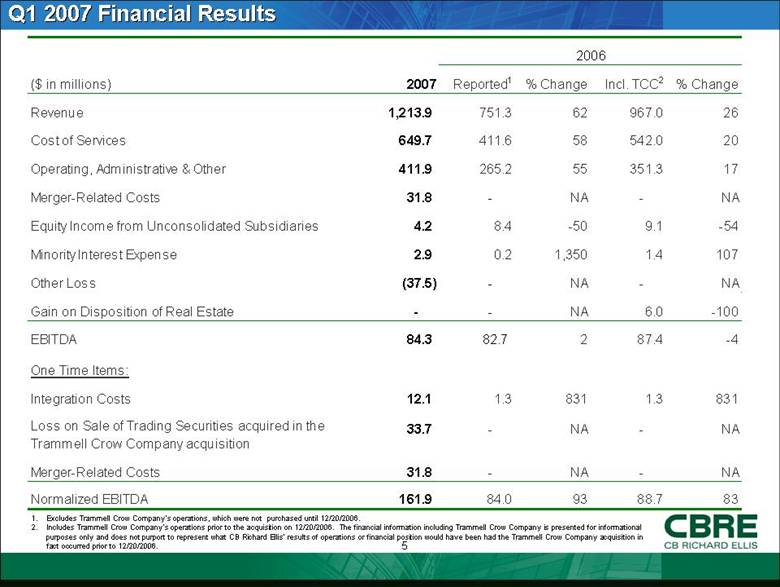
Q1 2007 Financial Results Excludes Trammell Crow Company’s operations, which were not purchased until 12/20/2006. Includes Trammell Crow Company’s operations prior to the acquisition on 12/20/2006. The financial information including Trammell Crow Company is presented for informational purposes only and does not purport to represent what CB Richard Ellis’ results of operations or financial position would have been had the Trammell Crow Company acquisition in fact occurred prior to 12/20/2006. 2006 ($ in millions) 2007 Reported 1 % Change Incl. TCC 2 % Change Revenue 1,213.9 751.3 62 967.0 26 Cost of Services 649.7 411.6 58 542.0 20 Operating, Administrative & Other 411.9 265.2 55 351.3 17 Merger-Related Costs 31.8 - NA - NA Equity Income from Unconsolidated Subsidiaries 4.2 8.4 -50 9.1 -54 Minority Interest Expense 2.9 0.2 1,350 1.4 107 Other Loss (37.5) - NA - NA Gain on Disposition of Real Estate - - NA 6.0 -100 EBITDA 84.3 82.7 2 87.4 -4 One Time Items: Integration Costs 12.1 1.3 831 1.3 831 Loss on Sale of Trading Securities acquired in the Trammell Crow Company acquisition 33.7 - NA - NA Merger-Related Costs 31.8 - NA - NA Normalized EBITDA 161.9 84.0 93 88.7 83 |
|
|
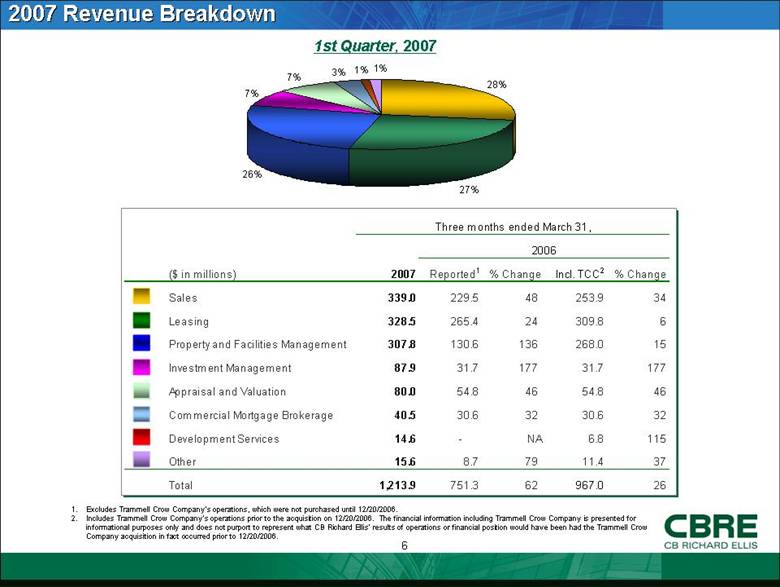
2007 Revenue Breakdown 1st Quarter, 2007 Excludes Trammell Crow Company’s operations, which were not purchased until 12/20/2006. Includes Trammell Crow Company’s operations prior to the acquisition on 12/20/2006. The financial information including Trammell Crow Company is presented for informational purposes only and does not purport to represent what CB Richard Ellis’ results of operations or financial position would have been had the Trammell Crow Company acquisition in fact occurred prior to 12/20/2006. ($ in millions) 2007 Reported 1 % Change Incl. TCC 2 % Change Sales 339.0 229.5 48 253.9 34 Leasing 328.5 265.4 24 309.8 6 Property and Facilities Management 307.8 130.6 136 268.0 15 Investment Management 87.9 31.7 177 31.7 177 Appraisal and Valuation 80.0 54.8 46 54.8 46 Commercial Mortgage Brokerage 40.5 30.6 32 30.6 32 Development Services 14.6 - NA 6.8 115 Other 15.6 8.7 79 11.4 37 Total 1,213.9 751.3 62 967.0 26 Three months ended March 31, 2006 28% 27% 26% 7% 7% 3% 1% 1% |
|
|
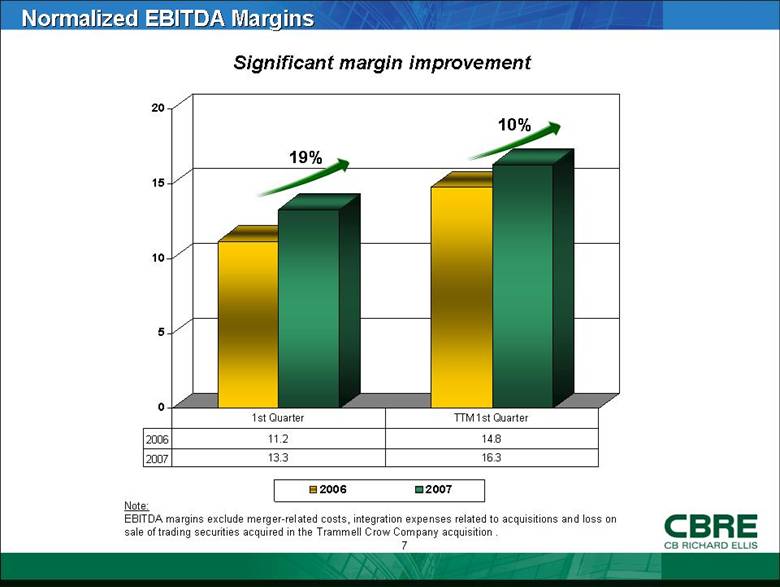
Normalized EBITDA Margins Significant margin improvement Note: EBITDA margins exclude merger-related costs, integration expenses related to acquisitions and loss on sale of trading securities acquired in the Trammell Crow Company acquisition . 19% 10% 0 5 10 15 20 2006 2007 2006 11.2 14.8 2007 13.3 16.3 1st Quarter TTM 1st Quarter |
|
|
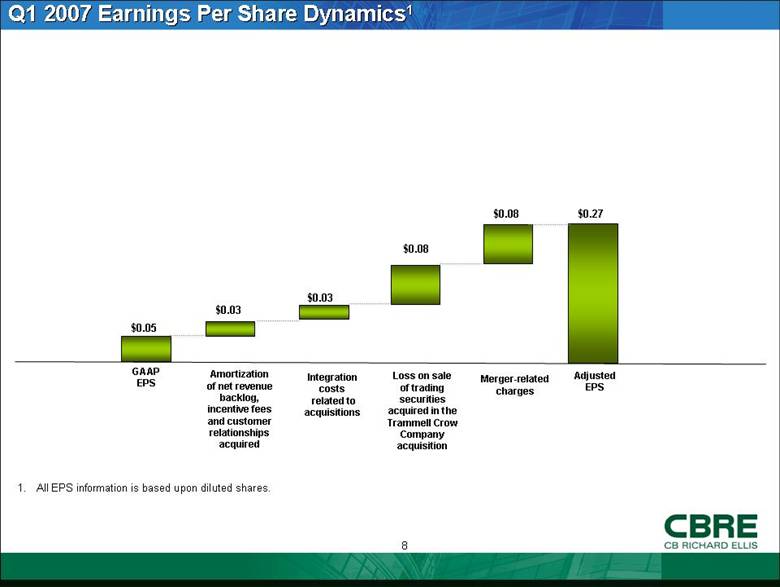
Q1 2007 Earnings Per Share Dynamics1 1. All EPS information is based upon diluted shares. GAAP EPS Integration costs related to acquisitions Adjusted EPS $0.05 $0.03 $0.27 Loss on sale of trading securities acquired in the Trammell Crow Company acquisition $0.08 Merger-related charges $0.08 Amortization of net revenue backlog, incentive fees and customer relationships acquired $0.03 |
|
|
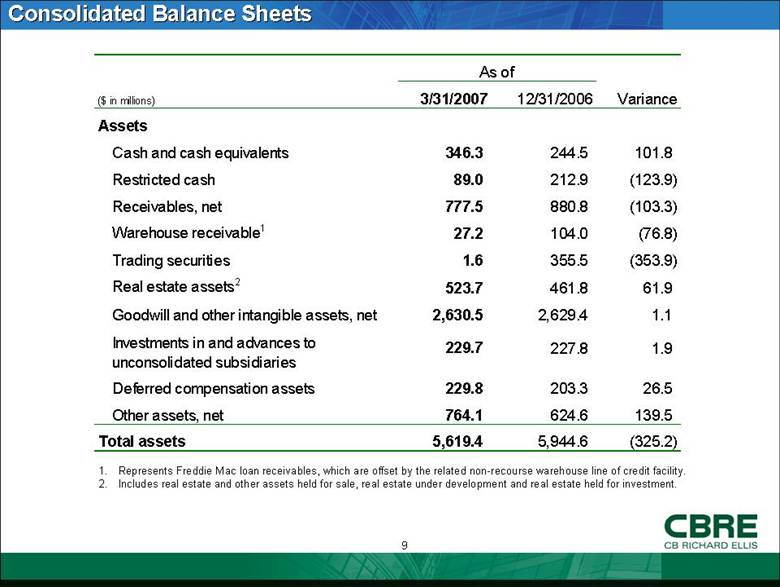
Consolidated Balance Sheets Represents Freddie Mac loan receivables, which are offset by the related non-recourse warehouse line of credit facility. Includes real estate and other assets held for sale, real estate under development and real estate held for investment. ($ in millions) 3/31/2007 12/31/2006 Variance Assets Cash and cash equivalents 346.3 244.5 101.8 Restricted cash 89.0 212.9 (123.9) Receivables, net 777.5 880.8 (103.3) Warehouse receivable 1 27.2 104.0 (76.8) Trading securities 1.6 355.5 (353.9) Real estate assets 2 523.7 461.8 61.9 Goodwill and other intangible assets, net 2,630.5 2,629.4 1.1 Investments in and advances to unconsolidated subsidiaries 229.7 227.8 1.9 Deferred compensation assets 229.8 203.3 26.5 Other assets, net 764.1 624.6 139.5 Total assets 5,619.4 5,944.6 (325.2) As of |
|
|
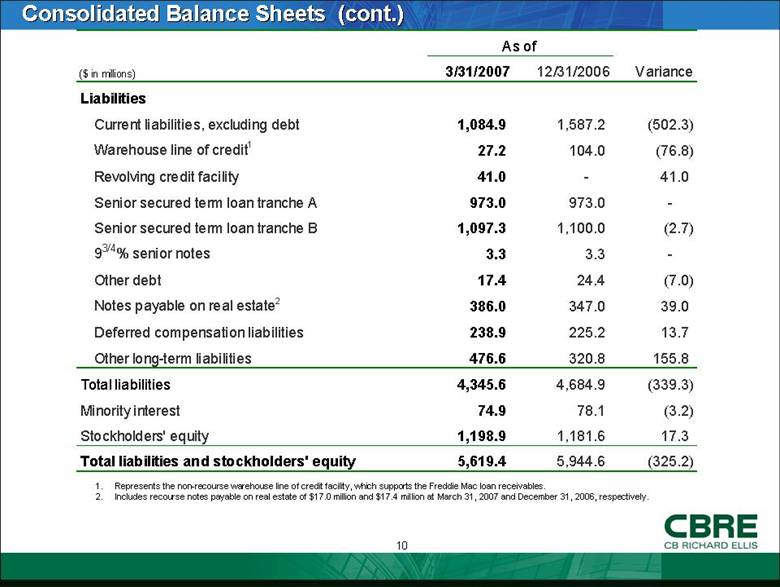
Consolidated Balance Sheets (cont.) Represents the non-recourse warehouse line of credit facility, which supports the Freddie Mac loan receivables. Includes recourse notes payable on real estate of $17.0 million and $17.4 million at March 31, 2007 and December 31, 2006, respectively. ($ in millions) 3/31/2007 12/31/2006 Variance Liabilities Current liabilities, excluding debt 1,084.9 1,587.2 (502.3) Warehouse line of credit 1 27.2 104.0 (76.8) Revolving credit facility 41.0 - 41.0 Senior secured term loan tranche A 973.0 973.0 - Senior secured term loan tranche B 1,097.3 1,100.0 (2.7) 9 3/4 % senior notes 3.3 3.3 - Other debt 17.4 24.4 (7.0) Notes payable on real estate 2 386.0 347.0 39.0 Deferred compensation liabilities 238.9 225.2 13.7 Other long-term liabilities 476.6 320.8 155.8 Total liabilities 4,345.6 4,684.9 (339.3) Minority interest 74.9 78.1 (3.2) Stockholders' equity 1,198.9 1,181.6 17.3 Total liabilities and stockholders' equity 5,619.4 5,944.6 (325.2) As of |
|
|
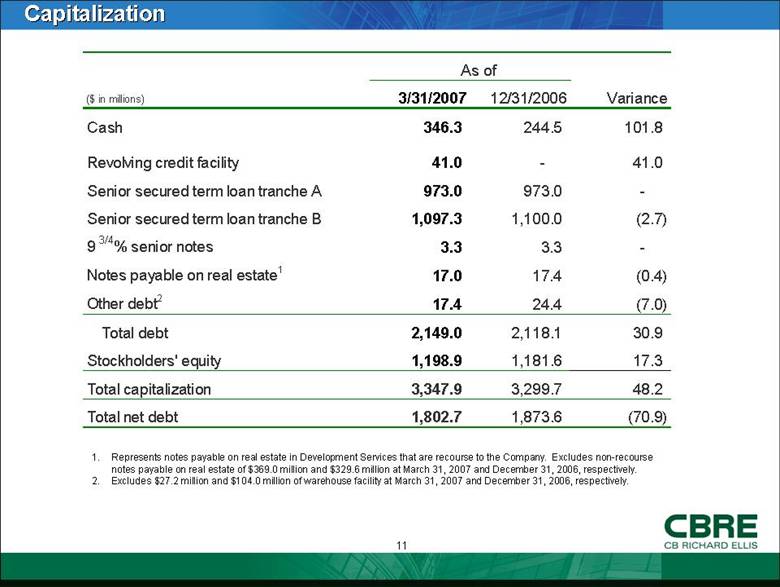
Capitalization Represents notes payable on real estate in Development Services that are recourse to the Company. Excludes non-recourse notes payable on real estate of $369.0 million and $329.6 million at March 31, 2007 and December 31, 2006, respectively. Excludes $27.2 million and $104.0 million of warehouse facility at March 31, 2007 and December 31, 2006, respectively. ($ in millions) 3/31/2007 12/31/2006 Variance Cash 346.3 244.5 101.8 Revolving credit facility 41.0 - 41.0 Senior secured term loan tranche A 973.0 973.0 - Senior secured term loan tranche B 1,097.3 1,100.0 (2.7) 9 3/4 % senior notes 3.3 3.3 - Notes payable on real estate 1 17.0 17.4 (0.4) Other debt 2 17.4 24.4 (7.0) Total debt 2,149.0 2,118.1 30.9 Stockholders' equity 1,198.9 1,181.6 17.3 Total capitalization 3,347.9 3,299.7 48.2 Total net debt 1,802.7 1,873.6 (70.9) As of |
|
|
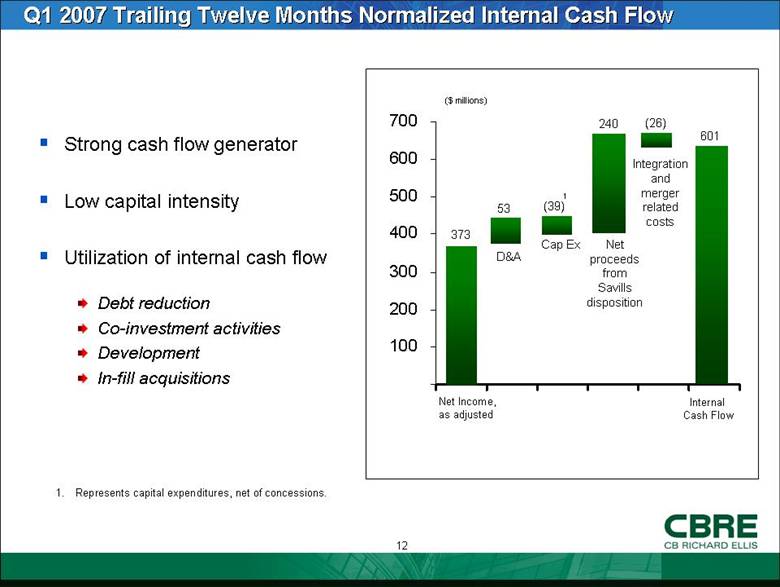
Strong cash flow generator Low capital intensity Utilization of internal cash flow Debt reduction Co-investment activities Development In-fill acquisitions Q1 2007 Trailing Twelve Months Normalized Internal Cash Flow ($ millions) 373 Net Income, as adjusted D&A Cap Ex (39) 601 Represents capital expenditures, net of concessions. Internal Cash Flow 1 53 240 (26) Net proceeds from Savills disposition Integration and merger related costs - 100 200 300 400 500 600 700 |
|
|
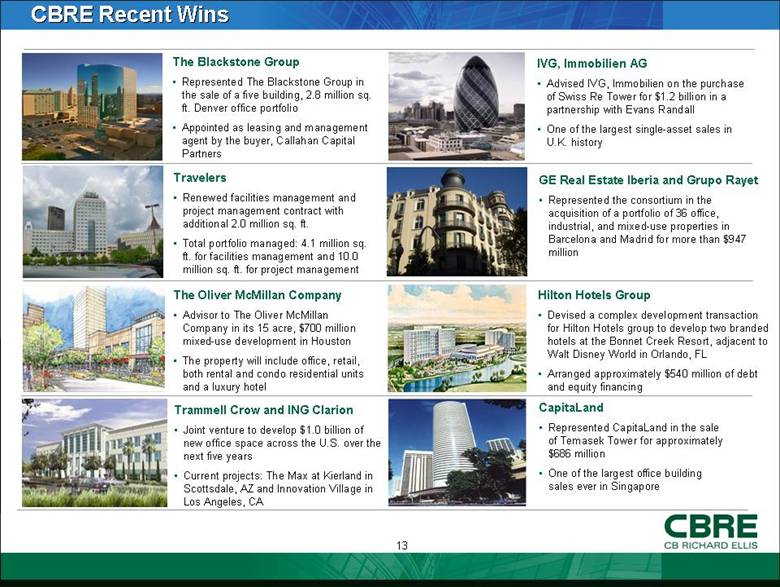
CBRE Recent Wins The Blackstone Group Represented The Blackstone Group in the sale of a five building, 2.8 million sq. ft. Denver office portfolio Appointed as leasing and management agent by the buyer, Callahan Capital Partners IVG, Immobilien AG Advised IVG, Immobilien on the purchase of Swiss Re Tower for $1.2 billion in a partnership with Evans Randall One of the largest single-asset sales in U.K. history Travelers Renewed facilities management and project management contract with additional 2.0 million sq. ft. Total portfolio managed: 4.1 million sq. ft. for facilities management and 10.0 million sq. ft. for project management GE Real Estate Iberia and Grupo Rayet Represented the consortium in the acquisition of a portfolio of 36 office, industrial, and mixed-use properties in Barcelona and Madrid for more than $947 million CapitaLand Represented CapitaLand in the sale of Temasek Tower for approximately $686 million One of the largest office building sales ever in Singapore The Oliver McMillan Company Advisor to The Oliver McMillan Company in its 15 acre, $700 million mixed-use development in Houston The property will include office, retail, both rental and condo residential units and a luxury hotel Trammell Crow and ING Clarion Joint venture to develop $1.0 billion of new office space across the U.S. over the next five years Current projects: The Max at Kierland in Scottsdale, AZ and Innovation Village in Los Angeles, CA Hilton Hotels Group Devised a complex development transaction for Hilton Hotels group to develop two branded hotels at the Bonnet Creek Resort, adjacent to Walt Disney World in Orlando, FL Arranged approximately $540 million of debt and equity financing |
|
|
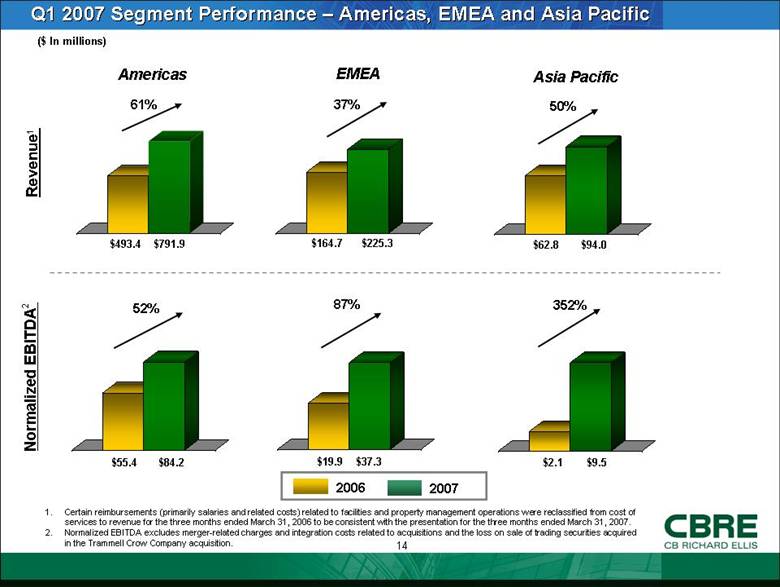
Q1 2007 Segment Performance – Americas, EMEA and Asia Pacific $791.9 ($ In millions) Revenue1 Normalized EBITDA2 Americas EMEA Asia Pacific $493.4 $225.3 $164.7 $94.0 $62.8 $84.2 $55.4 $37.3 $19.9 $9.5 $2.1 61% 37% 50% 52% 87% 2007 2006 352% Certain reimbursements (primarily salaries and related costs) related to facilities and property management operations were reclassified from cost of services to revenue for the three months ended March 31, 2006 to be consistent with the presentation for the three months ended March 31, 2007. Normalized EBITDA excludes merger-related charges and integration costs related to acquisitions and the loss on sale of trading securities acquired in the Trammell Crow Company acquisition. |
|
|
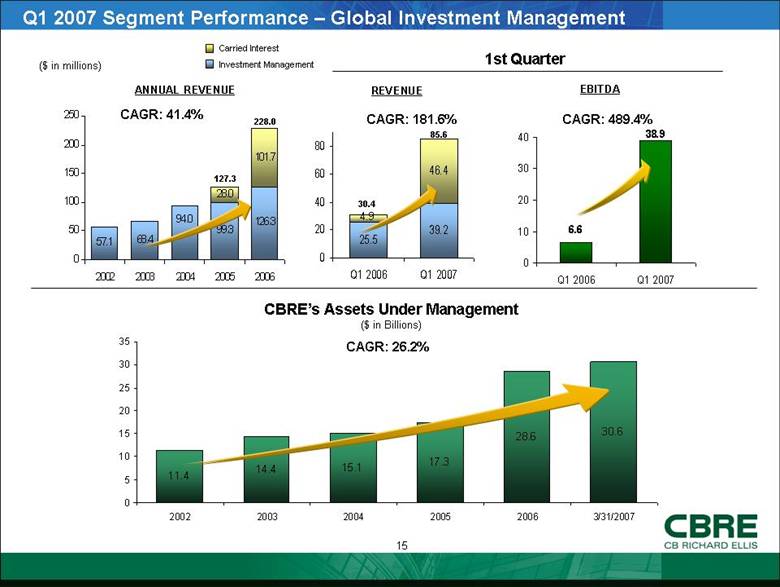
Q1 2007 Segment Performance – Global Investment Management 1st Quarter CAGR: 41.4% CAGR: 181.6% ANNUAL REVENUE REVENUE 127.3 Carried Interest Investment Management CAGR: 26.2% CBRE’s Assets Under Management ($ in Billions) 85.6 228.0 CAGR: 489.4% EBITDA ($ in millions) 30.4 4.9 46.4 25.5 39.2 4.9 0 20 40 60 80 Q1 2006 Q1 2007 57.1 68.4 99.3 126.3 28.0 101.7 94.0 0 50 100 150 200 250 2002 2003 2004 2005 2006 6.6 38.9 0 10 20 30 40 Q1 2006 Q1 2007 11.4 14.4 15.1 17.3 28.6 30.6 0 5 10 15 20 25 30 35 2002 2003 2004 2005 2006 3/31/2007 |
|
|
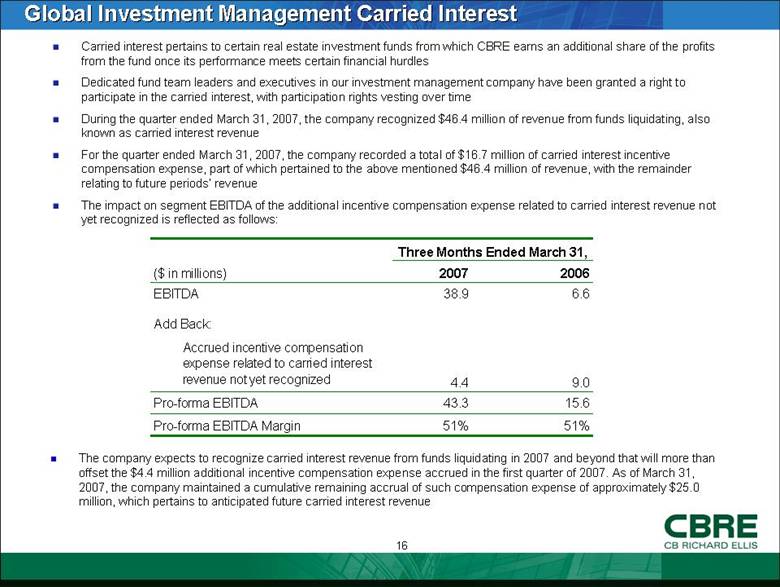
Global Investment Management Carried Interest Carried interest pertains to certain real estate investment funds from which CBRE earns an additional share of the profits from the fund once its performance meets certain financial hurdles Dedicated fund team leaders and executives in our investment management company have been granted a right to participate in the carried interest, with participation rights vesting over time During the quarter ended March 31, 2007, the company recognized $46.4 million of revenue from funds liquidating, also known as carried interest revenue For the quarter ended March 31, 2007, the company recorded a total of $16.7 million of carried interest incentive compensation expense, part of which pertained to the above mentioned $46.4 million of revenue, with the remainder relating to future periods’ revenue The impact on segment EBITDA of the additional incentive compensation expense related to carried interest revenue not yet recognized is reflected as follows: The company expects to recognize carried interest revenue from funds liquidating in 2007 and beyond that will more than offset the $4.4 million additional incentive compensation expense accrued in the first quarter of 2007. As of March 31, 2007, the company maintained a cumulative remaining accrual of such compensation expense of approximately $25.0 million, which pertains to anticipated future carried interest revenue Three Months Ended March 31, ($ in millions) 2007 2006 EBITDA 38.9 6.6 Add Back: Accrued incentive compensation expense related to carried interest revenue not yet recognized 4.4 9.0 Pro-forma EBITDA 43.3 15.6 Pro-forma EBITDA Margin 51% 51% |
|
|
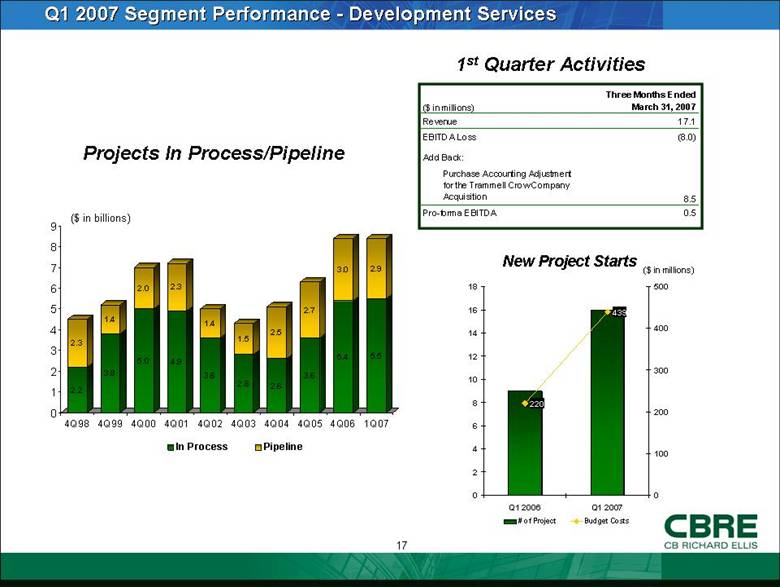
Q1 2007 Segment Performance - Development Services ($ in billions) Projects In Process/Pipeline 1st Quarter Activities ($ in millions) New Project Starts 2.2 2.3 3.8 1.4 5.0 2.0 4.9 2.3 3.6 1.4 2.8 1.5 2.6 2.5 3.6 2.7 5.4 3.0 5.5 2.9 0 1 2 3 4 5 6 7 8 9 4Q98 4Q99 4Q00 4Q01 4Q02 4Q03 4Q04 4Q05 4Q06 1Q07 In Process Pipeline ($ in millions) Three Months Ended March 31, 2007 Revenue 17.1 EBITDA Loss (8.0) Add Back: Purchase Accounting Adjustment for the Trammell Crow Company Acquisition 8.5 Pro-forma EBITDA 0.5 220 439 0 2 4 6 8 10 12 14 16 18 Q1 2006 Q1 2007 0 100 200 300 400 500 # of Project Budget Costs |
|
|
Summary Major markets around the world remain strong, fueled by global economic expansion, substantial marketplace liquidity and increased cross-border capital flows Rental rates continue to rise in key markets around the world Success in client base and market share expansion Trammell Crow Company integration ahead of schedule |
|
|
Appendix |
|
|
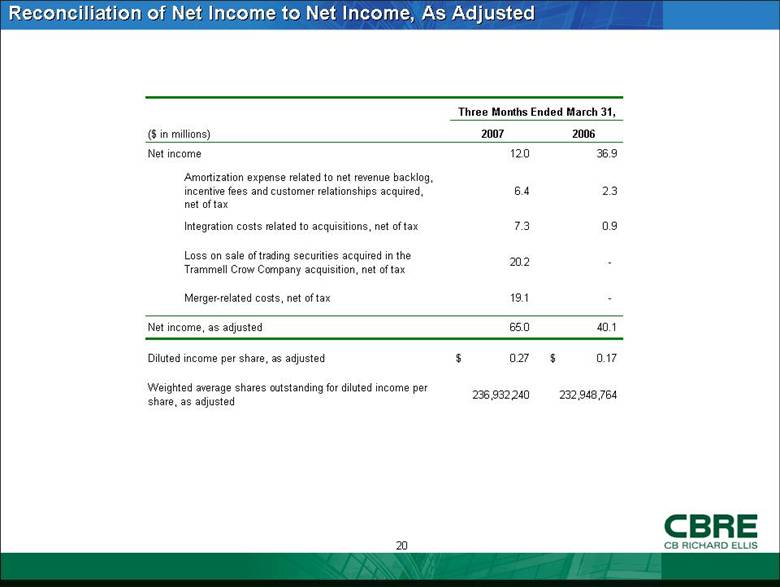
Reconciliation of Net Income to Net Income, As Adjusted ($ in millions) 2007 2006 Net income 12.0 36.9 Amortization expense related to net revenue backlog, incentive fees and customer relationships acquired, net of tax 6.4 2.3 Integration costs related to acquisitions, net of tax 7.3 0.9 Loss on sale of trading securities acquired in the Trammell Crow Company acquisition, net of tax 20.2 - Merger-related costs, net of tax 19.1 - Net income, as adjusted 65.0 40.1 Diluted income per share, as adjusted 0.27 $ 0.17 $ Weighted average shares outstanding for diluted income per share, as adjusted 236,932,240 232,948,764 Three Months Ended March 31, |
|
|
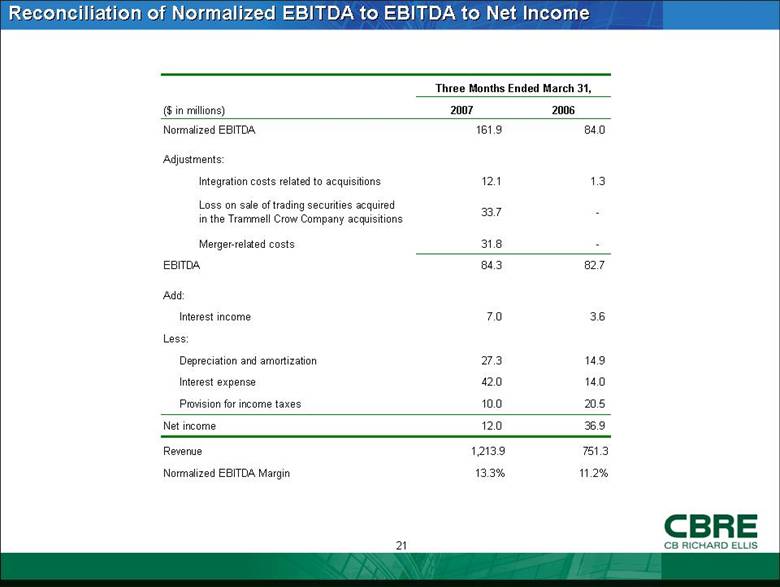
Reconciliation of Normalized EBITDA to EBITDA to Net Income ($ in millions) 2007 2006 Normalized EBITDA 161.9 84.0 Adjustments: Integration costs related to acquisitions 12.1 1.3 Loss on sale of trading securities acquired in the Trammell Crow Company acquisitions 33.7 - Merger-related costs 31.8 - EBITDA 84.3 82.7 Add: 7.0 3.6 Less: 27.3 14.9 42.0 14.0 10.0 20.5 Net income 12.0 36.9 Revenue 1,213.9 751.3 Normalized EBITDA Margin 13.3% 11.2% Three Months Ended March 31, Provision for income taxes Interest expense Depreciation and amortization Interest income |
|
|
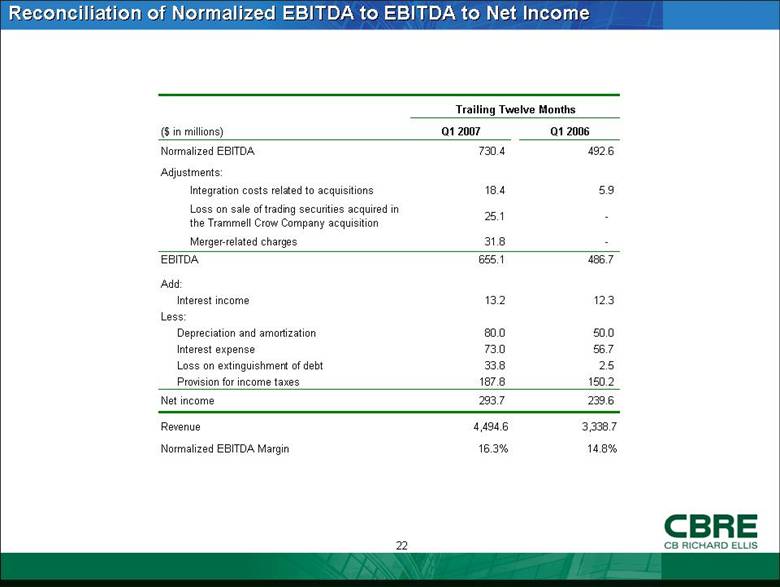
Reconciliation of Normalized EBITDA to EBITDA to Net Income ($ in millions) Q1 2007 Q1 2006 Normalized EBITDA 730.4 492.6 Adjustments: Integration costs related to acquisitions 18.4 5.9 Loss on sale of trading securities acquired in the Trammell Crow Company acquisition 25.1 - Merger-related charges 31.8 - EBITDA 655.1 486.7 Add: 13.2 12.3 Less: 80.0 50.0 73.0 56.7 33.8 2.5 187.8 150.2 Net income 293.7 239.6 Revenue 4,494.6 3,338.7 Normalized EBITDA Margin 16.3% 14.8% Trailing Twelve Months Provision for income taxes Loss on extinguishment of debt Interest expense Depreciation and amortization Interest income |
|
|
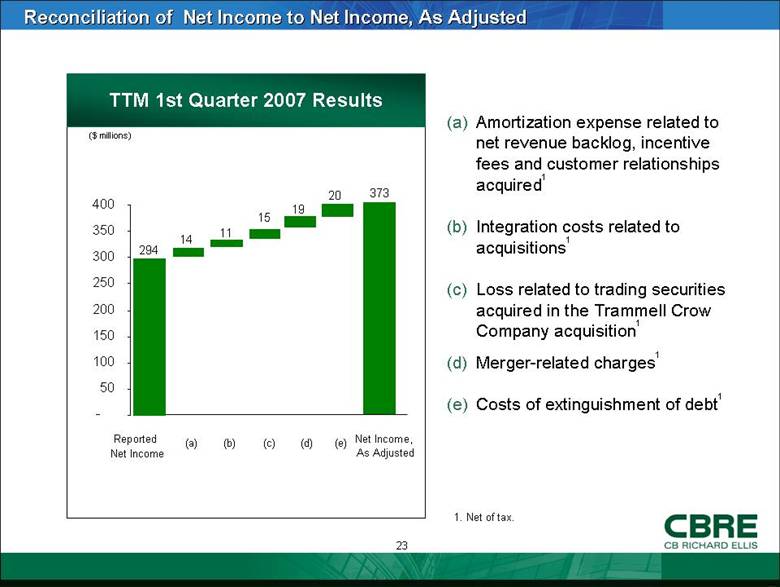
Amortization expense related to net revenue backlog, incentive fees and customer relationships acquired1 Integration costs related to acquisitions1 Loss related to trading securities acquired in the Trammell Crow Company acquisition1 Merger-related charges1 Costs of extinguishment of debt1 Reconciliation of Net Income to Net Income, As Adjusted Net Income, As Adjusted TTM 1st Quarter 2007 Results ($ millions) 294 373 14 11 Reported Net Income (a) (b) (c) 1. Net of tax. 15 19 (d) 20 (e) - 50 100 150 200 250 300 350 400 |
|
|
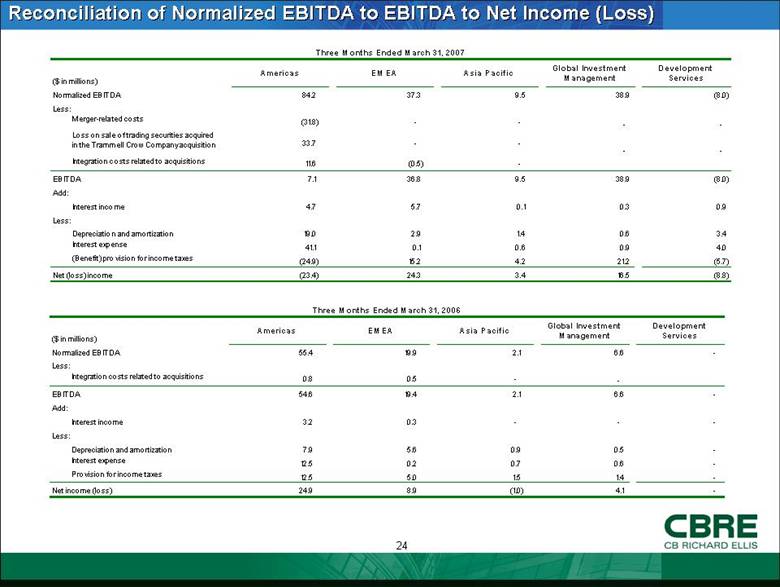
Reconciliation of Normalized EBITDA to EBITDA to Net Income (Loss) Three Months Ended March 31, 2006 ($ in millions) Americas EMEA Asia Pacific Global Investment Management Development Services Normalized EBITDA 55.4 19.9 2.1 6.6 - Less: Integration costs related to acquisitions 0.8 0.5 - - EBITDA 54.6 19.4 2.1 6.6 - Add: Interest income 3.2 0.3 - - - Less: Depreciation and amortization 7.9 5.6 0.9 0.5 - Interest expense 12.5 0.2 0.7 0.6 - Provision for income taxes 12.5 5.0 1.5 1.4 - Net income (loss) 24.9 8.9 (1.0) 4.1 - ($ in millions)
Americas EM EA Asia Pacific Global Investment Management Development Services Normalized EBITDA 842 373 9.5 389 (8.0) Less: Merger-related costs (318) - - - - Loss on sale of trading securities acquired in the Trammell Crow Company acquisition 33.7 - - - - Integration costs related to acquisitions 116 (0.5) - - - EBITDA 7.1 36.8 9.5 38.9 (8.0) Add: Interest income 4.7 5.7 0.1 0.3 0.9 Less: Depreciation and amortization 19.0 2.9 1.4 0.6 3.4 Interest expense 41.1 0.1 0.6 0.9 4.0 (Benefit) provision for income taxes (24.9) 15.2 4.2 212 (5.7) Net (loss) income (23.4) 24.3 3.4 16.5 (8.8) |
|
|
CBRE CB RICHARD ELLIS |