Exhibit 99.2
|
|
CB Richard Ellis Group, Inc. Fourth Quarter 2006 Earnings Conference Call February 7, 2007 |
Exhibit 99.2
|
|
CB Richard Ellis Group, Inc. Fourth Quarter 2006 Earnings Conference Call February 7, 2007 |
|
|
Forward Looking Statements This presentation contains statements that are forward looking within the meaning of the Private Securities Litigation Reform Act of 1995, including statements regarding our growth momentum in 2007, future operations, the impact of acquisitions and future financial performance. These statements should be considered as estimates only and actual results may ultimately differ from these estimates. Except to the extent required by applicable securities laws, we undertake no obligation to update or publicly revise any of the forward-looking statements that you may hear today. Please refer to our current annual report on Form 10-K (in particular, Risk Factors) and our current quarterly report on Form 10-Q, which are filed with the SEC and available at the SEC’s website (http://www.sec.gov), for a full discussion of the risks and other factors that may impact any estimates that you may hear today. We may make certain statements during the course of this presentation which include references to “non-GAAP financial measures,” as defined by SEC regulations. As required by these regulations, we have provided reconciliations of these measures to what we believe are the most directly comparable GAAP measures, which are attached hereto within the appendix. |
|
|
Conference Call Participants Brett White, President and Chief Executive Officer Kenneth J. Kay, Sr. Executive Vice President & Chief Financial Officer Bob Sulentic, Group President, EMEA, Asia Pacific and Development Sevices Shelley Young, Director, Investor Relations |
|
|
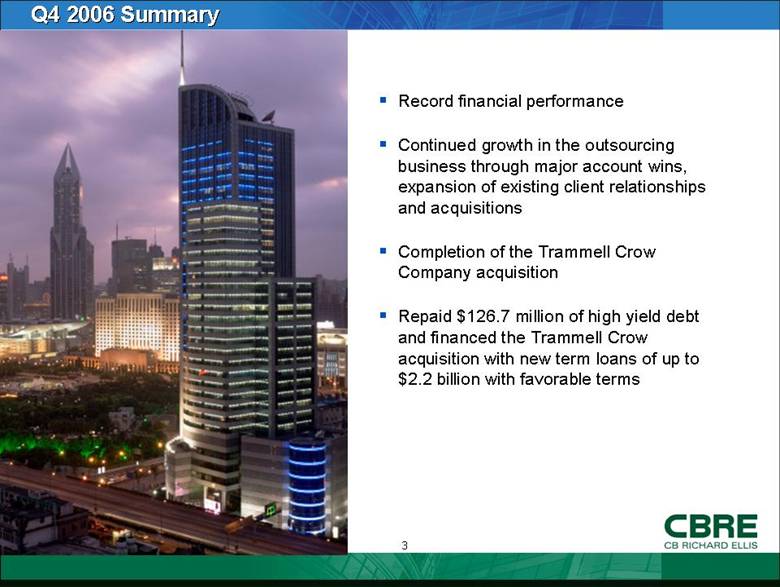
Record financial performance Continued growth in the outsourcing business through major account wins, expansion of existing client relationships and acquisitions Completion of the Trammell Crow Company acquisition Repaid $126.7 million of high yield debt and financed the Trammell Crow acquisition with new term loans of up to $2.2 billion with favorable terms Q4 2006 Summary |
|
|
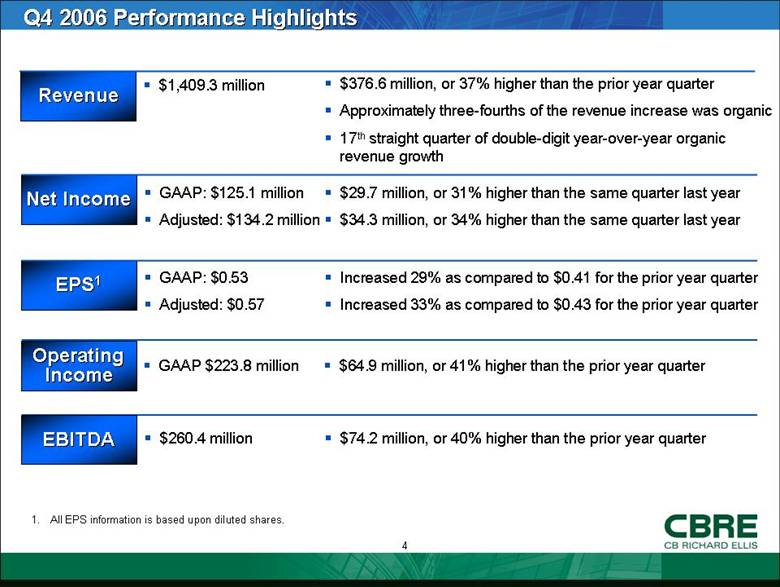
Q4 2006 Performance Highlights Revenue $1,409.3 million $376.6 million, or 37% higher than the prior year quarter Approximately three-fourths of the revenue increase was organic 17th straight quarter of double-digit year-over-year organic revenue growth $29.7 million, or 31% higher than the same quarter last year $34.3 million, or 34% higher than the same quarter last year GAAP: $125.1 million Adjusted: $134.2 million Increased 29% as compared to $0.41 for the prior year quarter Increased 33% as compared to $0.43 for the prior year quarter GAAP: $0.53 Adjusted: $0.57 GAAP $223.8 million $64.9 million, or 41% higher than the prior year quarter $74.2 million, or 40% higher than the prior year quarter $260.4 million Net Income EPS1 Operating Income EBITDA 1. All EPS information is based upon diluted shares. |
|
|
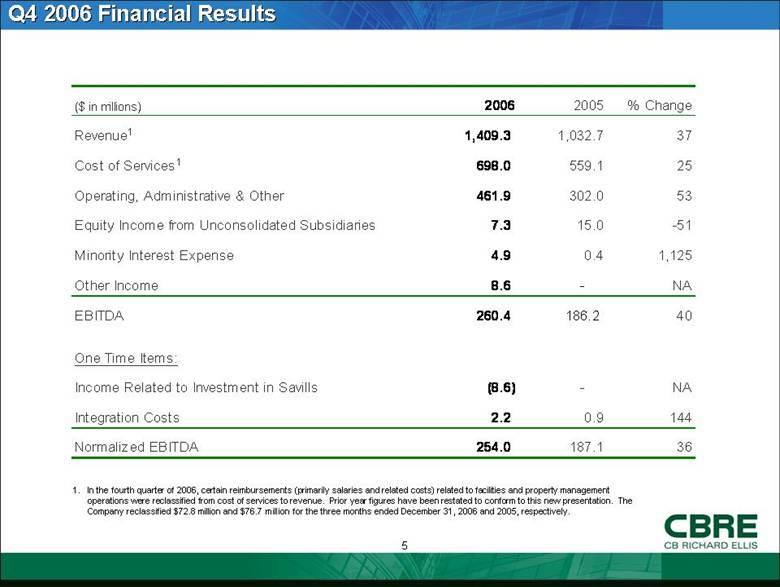
Q4 2006 Financial Results 1. In the fourth quarter of 2006, certain reimbursements (primarily salaries and related costs) related to facilities and property management operations were reclassified from cost of services to revenue. Prior year figures have been restated to conform to this new presentation. The Company reclassified $72.8 million and $76.7 million for the three months ended December 31, 2006 and 2005, respectively. ($ in millions) 2006 2005 % Change Revenue 1 1,409.3 1,032.7 37 Cost of Services 1 698.0 559.1 25 Operating, Administrative & Other 461.9 302.0 53 Equity Income from Unconsolidated Subsidiaries 7.3 15.0 -51 Minority Interest Expense 4.9 0.4 1,125 Other Income 8.6 - NA EBITDA 260.4 186.2 40 One Time Items: Income Related to Investment in Savills (8.6) - NA Integration Costs 2.2 0.9 144 Normalized EBITDA 254.0 187.1 36 |
|
|
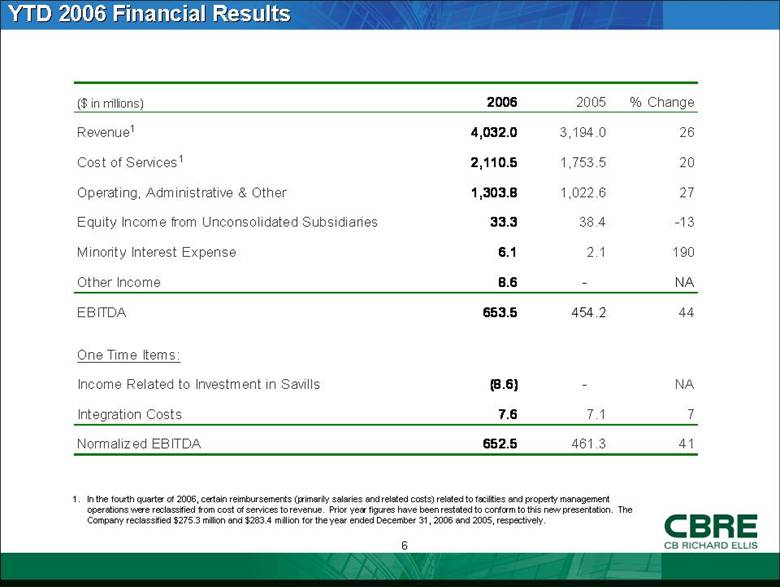
YTD 2006 Financial Results 1. In the fourth quarter of 2006, certain reimbursements (primarily salaries and related costs) related to facilities and property management operations were reclassified from cost of services to revenue. Prior year figures have been restated to conform to this new presentation. The Company reclassified $275.3 million and $283.4 million for the year ended December 31, 2006 and 2005, respectively. ($ in millions) 2006 2005 % Change Revenue 1 4,032.0 3,194.0 26 Cost of Services 1 2,110.5 1,753.5 20 Operating, Administrative & Other 1,303.8 1,022.6 27 Equity Income from Unconsolidated Subsidiaries 33.3 38.4 -13 Minority Interest Expense 6.1 2.1 190 Other Income 8.6 - NA EBITDA 653.5 454.2 44 One Time Items: Income Related to Investment in Savills (8.6) - NA Integration Costs 7.6 7.1 7 Normalized EBITDA 652.5 461.3 41 |
|
|
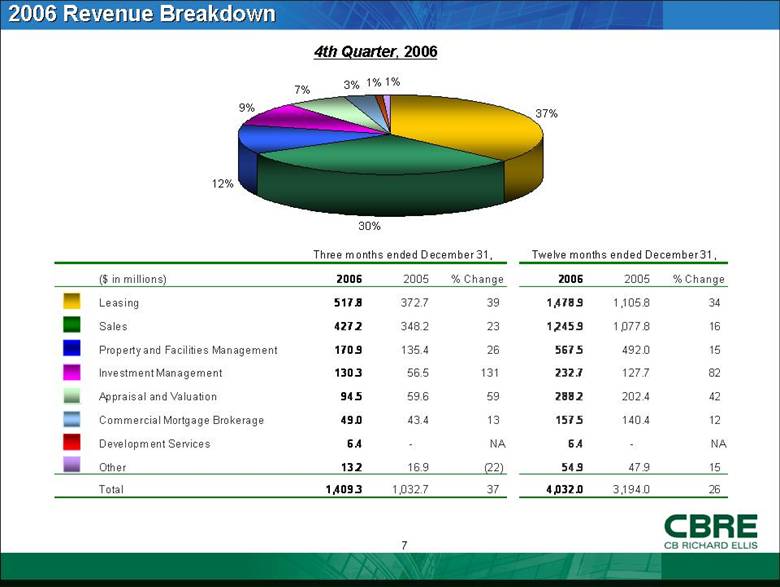
2006 Revenue Breakdown 4th Quarter, 2006 ($ in millions) 2006 2005 % Change 2006 2005 % Change Leasing 517.8 372.7 39 1,478.9 1,105.8 34 Sales 427.2 348.2 23 1,245.9 1,077.8 16 Property and Facilities Management 170.9 135.4 26 567.5 492.0 15 Investment Management 130.3 56.5 131 232.7 127.7 82 Appraisal and Valuation 94.5 59.6 59 288.2 202.4 42 Commercial Mortgage Brokerage 49.0 43.4 13 157.5 140.4 12 Development Services 6.4 - NA 6.4 - NA Other 13.2 16.9 (22) 54.9 47.9 15 Total 1,409.3 1,032.7 37 4,032.0 3,194.0 26 Three months ended December 31, Twelve months ended December 31, 37% 30% 12% 9% 7% 3% 1% 1% |
|
|
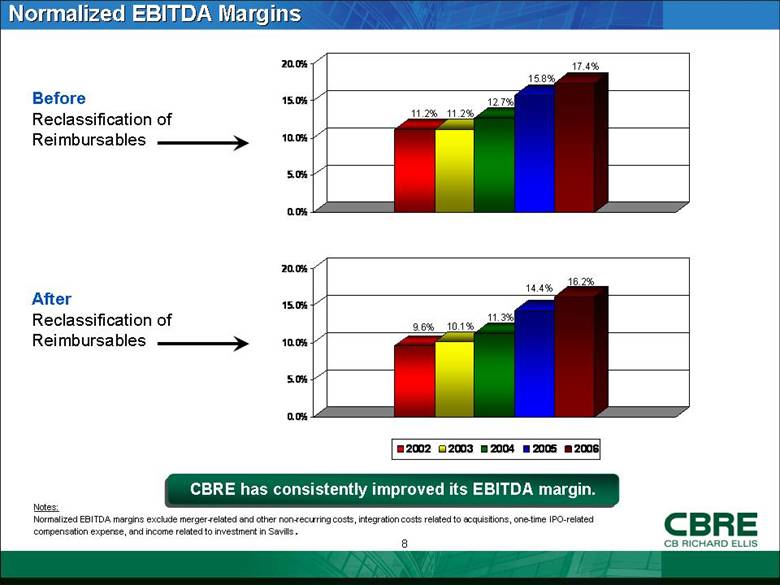
Normalized EBITDA Margins CBRE has consistently improved its EBITDA margin. Before Reclassification of Reimbursables After Reclassification of Reimbursables Notes: Normalized EBITDA margins exclude merger-related and other non-recurring costs, integration costs related to acquisitions, one-time IPO-related compensation expense, and income related to investment in Savills. 11.2% 11.2% 12.7% 15.8% 17.4% 0.0% 5.0% 10.0% 15.0% 20.0% 9.6% 10.1% 11.3% 14.4% 16.2% 0.0% 5.0% 10.0% 15.0% 20.0% 2002 2003 2004 2005 2006 |
|
|
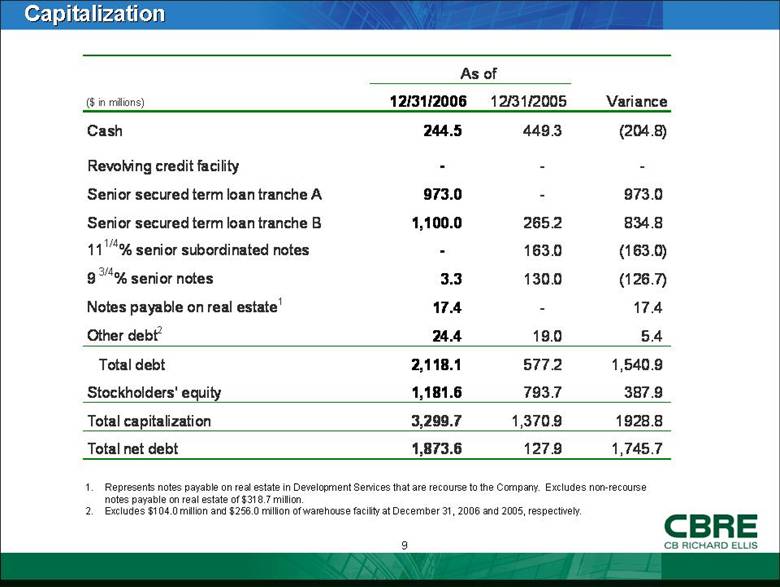
Capitalization 1. Represents notes payable on real estate in Development Services that are recourse to the Company. Excludes non-recourse notes payable on real estate of $318.7 million. 2. Excludes $104.0 million and $256.0 million of warehouse facility at December 31, 2006 and 2005, respectively. ($ in millions) 12/31/2006 12/31/2005 Variance Cash 244.5 449.3 (204.8) Revolving credit facility - - - Senior secured term loan tranche A 973.0 - 973.0 Senior secured term loan tranche B 1,100.0 265.2 834.8 11 1/4 % senior subordinated notes - 163.0 (163.0) 9 3/4 % senior notes 3.3 130.0 (126.7) Notes payable on real estate 1 17.4 - 17.4 Other debt 2 24.4 19.0 5.4 Total debt 2,118.1 577.2 1,540.9 Stockholders' equity 1,181.6 793.7 387.9 Total capitalization 3,299.7 1,370.9 1928.8 Total net debt 1,873.6 127.9 1,745.7 As of |
|
|
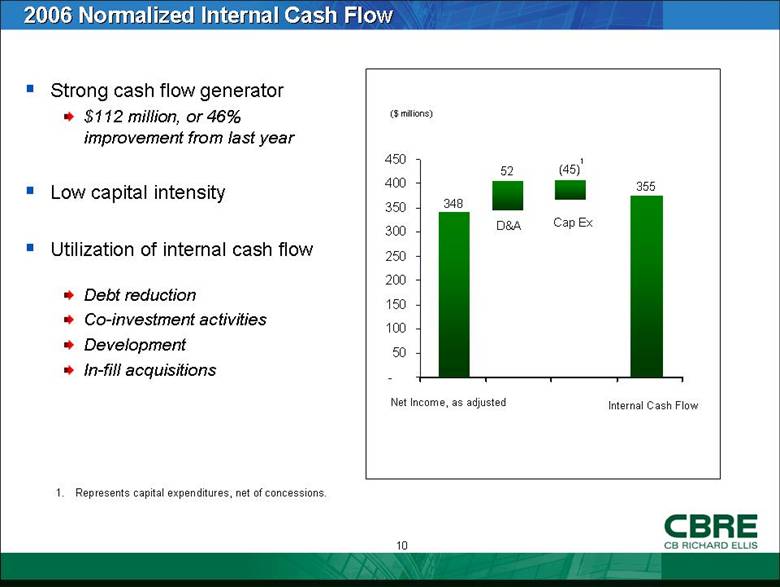
Strong cash flow generator $112 million, or 46% improvement from last year Low capital intensity Utilization of internal cash flow Debt reduction Co-investment activities Development In-fill acquisitions 2006 Normalized Internal Cash Flow ($ millions) 52 348 Net Income, as adjusted D&A Cap Ex (45) 355 1. Represents capital expenditures, net of concessions. Internal Cash Flow 1 - 50 100 150 200 250 300 350 400 450 |
|
|
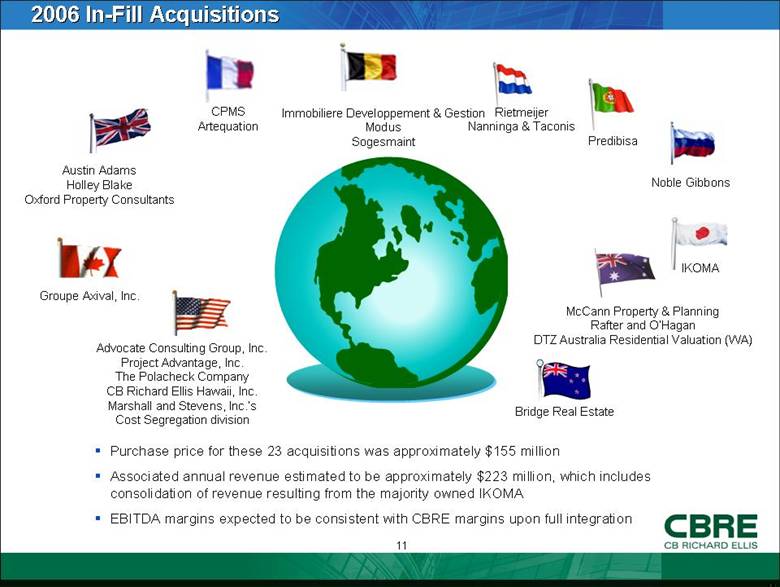
2006 In-Fill Acquisitions Austin Adams Holley Blake Oxford Property Consultants Groupe Axival, Inc. CPMS Artequation McCann Property & Planning Rafter and O’Hagan DTZ Australia Residential Valuation (WA) Advocate Consulting Group, Inc. Project Advantage, Inc. The Polacheck Company CB Richard Ellis Hawaii, Inc. Marshall and Stevens, Inc.’s Cost Segregation division Rietmeijer Nanninga & Taconis Immobiliere Developpement & Gestion Modus Sogesmaint Noble Gibbons IKOMA Purchase price for these 23 acquisitions was approximately $155 million Associated annual revenue estimated to be approximately $223 million, which includes consolidation of revenue resulting from the majority owned IKOMA EBITDA margins expected to be consistent with CBRE margins upon full integration Predibisa Bridge Real Estate |
|
|
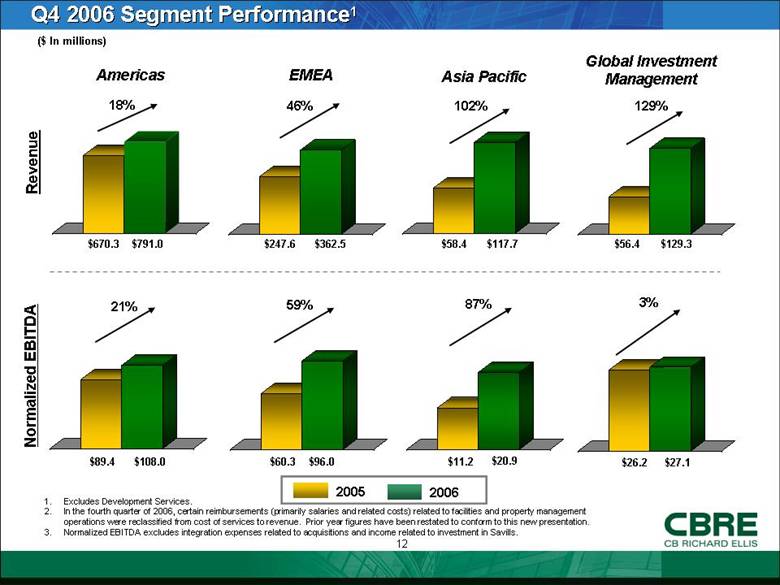
Q4 2006 Segment Performance1 $791.0 ($ In millions) Revenue Normalized EBITDA Americas EMEA Asia Pacific Global Investment Management $670.3 $362.5 $247.6 $117.7 $58.4 $129.3 $56.4 $108.0 $89.4 $96.0 $60.3 $20.9 $11.2 $27.1 $26.2 18% 46% 102% 129% 21% 59% 3% 2006 2005 87% 1. Excludes Development Services. 2. In the fourth quarter of 2006, certain reimbursements (primarily salaries and related costs) related to facilities and property management operations were reclassified from cost of services to revenue. Prior year figures have been restated to conform to this new presentation. 3. Normalized EBITDA excludes integration expenses related to acquisitions and income related to investment in savills. |
|
|
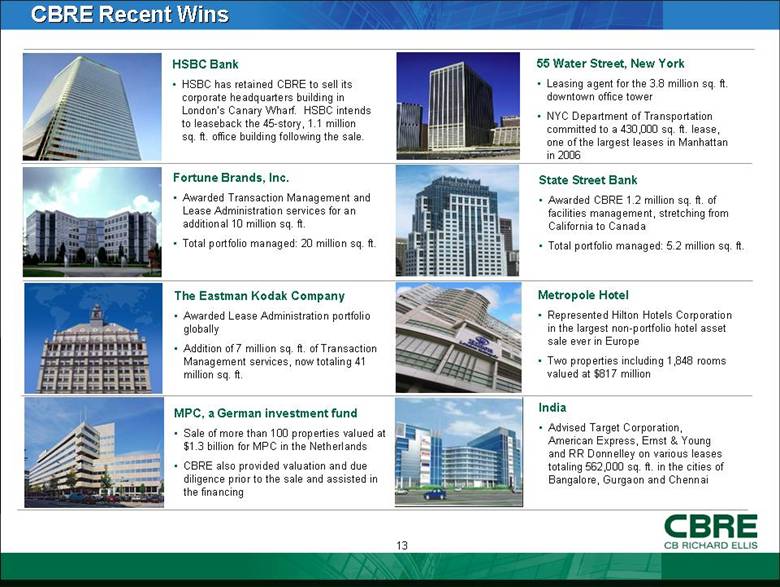
CBRE Recent Wins HSBC Bank HSBC has retained CBRE to sell its corporate headquarters building in London’s Canary Wharf. HSBC intends to leaseback the 45-story, 1.1 million sq. ft. office building following the sale. 55 Water Street, New York Leasing agent for the 3.8 million sq. ft. downtown office tower NYC Department of Transportation committed to a 430,000 sq. ft. lease, one of the largest leases in Manhattan in 2006 Fortune Brands, Inc. Awarded Transaction Management and Lease Administration services for an additional 10 million sq. ft. Total portfolio managed: 20 million sq. ft. State Street Bank Awarded CBRE 1.2 million sq. ft. of facilities management, stretching from California to Canada Total portfolio managed: 5.2 million sq. ft. India Advised Target Corporation, American Express, Ernst & Young and RR Donnelley on various leases totaling 562,000 sq. ft. in the cities of Bangalore, Gurgaon and Chennai The Eastman Kodak Company Awarded Lease Administration portfolio globally Addition of 7 million sq. ft. of Transaction Management services, now totaling 41 million sq. ft. MPC, a German investment fund Sale of more than 100 properties valued at $1.3 billion for MPC in the Netherlands CBRE also provided valuation and due diligence prior to the sale and assisted in the financing Metropole Hotel Represented Hilton Hotels Corporation in the largest non-portfolio hotel asset sale ever in Europe Two properties including 1,848 rooms valued at $817 million |
|
|
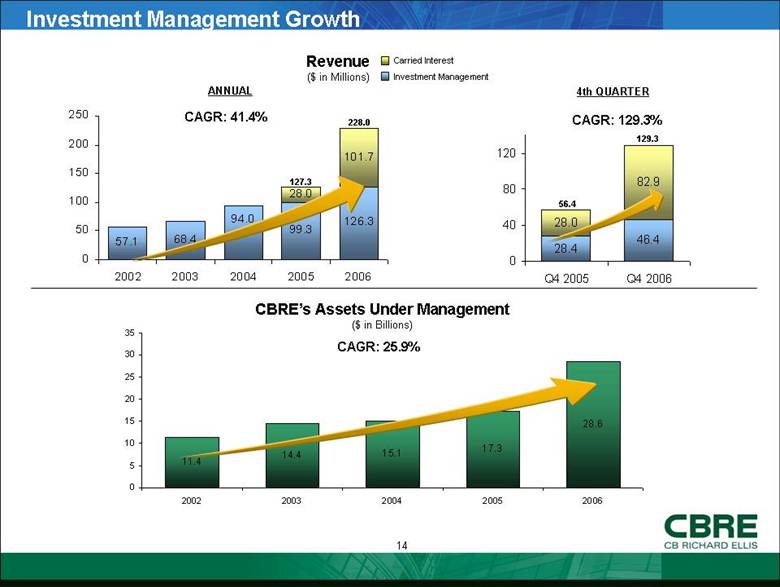
Investment Management Growth Revenue ($ in Millions) CAGR: 41.4% CAGR: 129.3% ANNUAL 4th QUARTER 127.3 Carried Interest Investment Management CAGR: 25.9% CBRE’s Assets Under Management ($ in Billions) 129.3 56.4 228.0 57.1 68.4 99.3 126.3 28.0 101.7 94.0 0 50 100 150 200 250 2002 2003 2004 2005 2006 28.0 82.9 46.4 28.4 0 40 80 120 Q4 2005 Q4 2006 11.4 14.4 15.1 17.3 28.6 0 5 10 15 20 25 30 35 2002 2003 2004 2005 2006 |
|
|
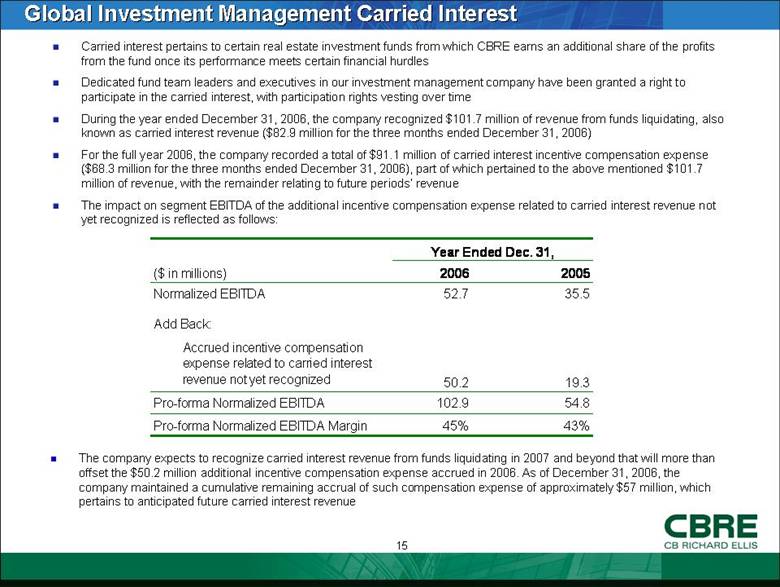
Global Investment Management Carried Interest Carried interest pertains to certain real estate investment funds from which CBRE earns an additional share of the profits from the fund once its performance meets certain financial hurdles Dedicated fund team leaders and executives in our investment management company have been granted a right to participate in the carried interest, with participation rights vesting over time During the year ended December 31, 2006, the company recognized $101.7 million of revenue from funds liquidating, also known as carried interest revenue ($82.9 million for the three months ended December 31, 2006) For the full year 2006, the company recorded a total of $91.1 million of carried interest incentive compensation expense ($68.3 million for the three months ended December 31, 2006), part of which pertained to the above mentioned $101.7 million of revenue, with the remainder relating to future periods’ revenue The impact on segment EBITDA of the additional incentive compensation expense related to carried interest revenue not yet recognized is reflected as follows: The company expects to recognize carried interest revenue from funds liquidating in 2007 and beyond that will more than offset the $50.2 million additional incentive compensation expense accrued in 2006. As of December 31, 2006, the company maintained a cumulative remaining accrual of such compensation expense of approximately $57 million, which pertains to anticipated future carried interest revenue Year Ended Dec. 31, ($ in millions) Normalized EBITDA 52.7 35.5 Add Back: Accrued incentive compensation expense related to carried interest revenue not yet recognized 50.2 19.3 Pro-forma Normalized EBITDA 102.9 54.8 Pro-forma Normalized EBITDA Margin 45% 43% 2005 2006 |
|
|
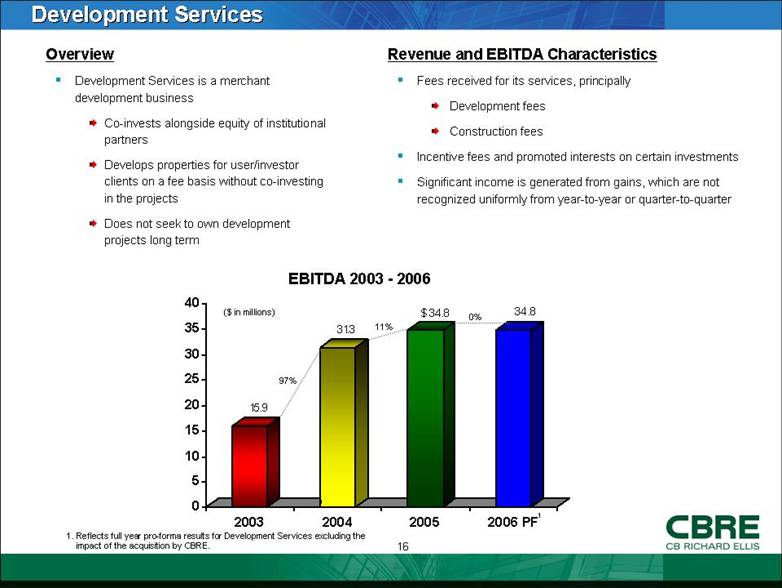
Development Services Overview Development Services is a merchant development business Co-invests alongside equity of institutional partners Develops properties for user/investor clients on a fee basis without co-investing in the projects Does not seek to own development projects long term Revenue and EBITDA Characteristics Fees received for its services, principally Development fees Construction fees Incentive fees and promoted interests on certain investments Significant income is generated from gains, which are not recognized uniformly from year-to-year or quarter-to-quarter EBITDA 2003 - 2006 ($ in millions) 97% 11% 0% 1 1. Reflects full year pro-forma results for Development Services excluding the impact of the acquisition by CBRE. 1 15.9 31.3 $34.8 34.8 0 5 10 15 20 25 30 35 40 2003 2004 2005 2006 PF |
|
|
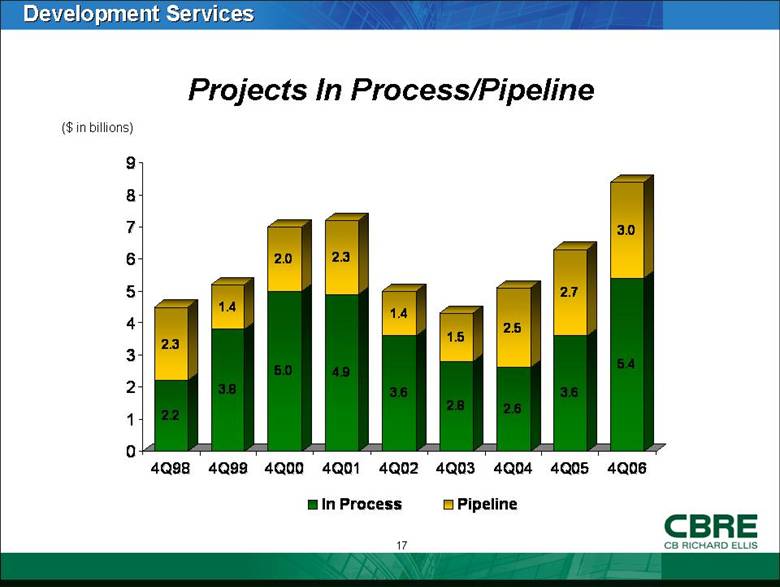
Development Services ($ in billions) Projects In Process/Pipeline 2.2 2.3 3.8 1.4 5.0 2.0 4.9 2.3 3.6 1.4 2.8 1.5 2.6 2.5 3.6 2.7 5.4 3.0 0 1 2 3 4 5 6 7 8 9 4Q98 4Q99 4Q00 4Q01 4Q02 4Q03 4Q04 4Q05 4Q06 In Process Pipeline |
|
|
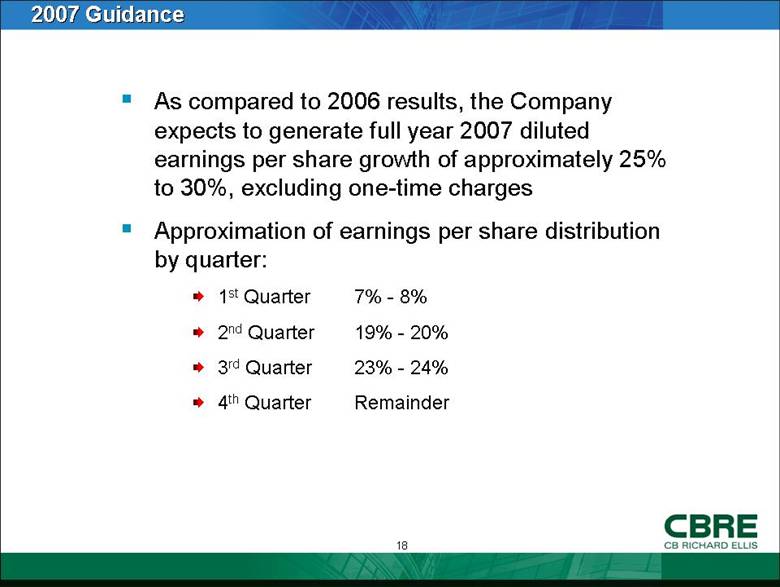
2007 Guidance As compared to 2006 results, the Company expects to generate full year 2007 diluted earnings per share growth of approximately 25% to 30%, excluding one-time charges Approximation of earnings per share distribution by quarter: 1st Quarter 7% - 8% 2nd Quarter 19% - 20% 3rd Quarter 23% - 24% 4th Quarter Remainder |
|
|
Summary Leasing markets continue to improve globally with economic expansion resulting in lower vacancies and increased rental rates Institutional allocations of capital to real estate remain at high levels Increasing cross-border flow of investment capital Favorable trends in outsourcing due to supplier consolidation and client globalization |
|
|
Appendix |
|
|
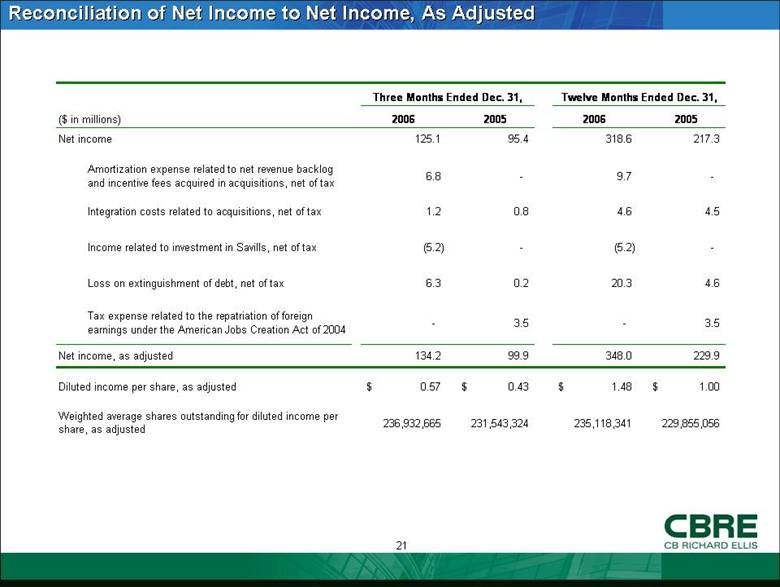
Reconciliation of Net Income to Net Income, As Adjusted Twelve Months Ended Dec. 31, ($ in millions) 2006 2005 2006 2005 Net income 125.1 95.4 318.6 217.3 Amortization expense related to net revenue backlog and incentive fees acquired in acquisitions, net of tax 6.8 - 9.7 - Integration costs related to acquisitions, net of tax 1.2 0.8 4.6 4.5 Income related to investment in Savills, net of tax (5.2) - (5.2) - Loss on extinguishment of debt, net of tax 6.3 0.2 20.3 4.6 Tax expense related to the repatriation of foreign earnings under the American Jobs Creation Act of 2004 - 3.5 - 3.5 Net income, as adjusted 134.2 99.9 348.0 229.9 Diluted income per share, as adjusted 0.57 $ 0.43 $ 1.48 $ 1.00 $ Weighted average shares outstanding for diluted income per share, as adjusted 236,932,665 231,543,324 235,118,341 229,855,056 Three Months Ended Dec. 31, |
|
|
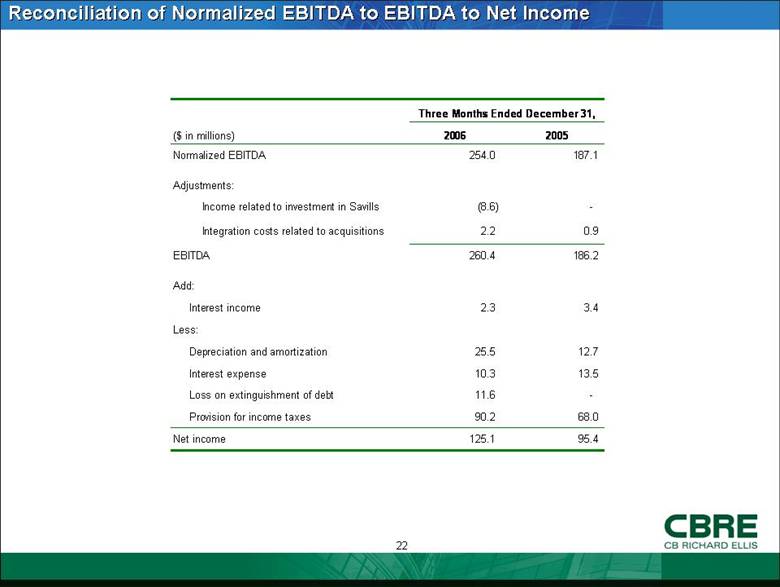
Reconciliation of Normalized EBITDA to EBITDA to Net Income ($ in millions) 2006 2005 Normalized EBITDA 254.0 187.1 Adjustments: Income related to investment in Savills (8.6) - Integration costs related to acquisitions 2.2 0.9 EBITDA 260.4 186.2 Add: 2.3 3.4 Less: 25.5 12.7 10.3 13.5 11.6 - 90.2 68.0 Net income 125.1 95.4 Three Months Ended December 31, Provision for income taxes Loss on extinguishment of debt Interest expense Depreciation and amortization Interest income |
|
|
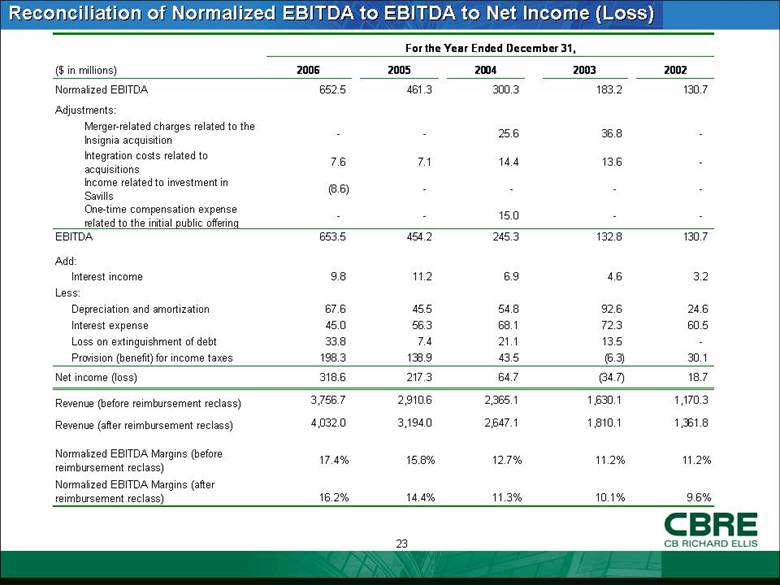
Reconciliation of Normalized EBITDA to EBITDA to Net Income (Loss) For the Year Ended December 31, ($ in millions) 2006 2005 2004 2003 2002 Normalized EBITDA 652.5 461.3 300.3 183.2 130.7 Adjustments: Merger-related charges related to the Insignia acquisition - - 25.6 36.8 - Integration costs related to acquisitions 7.6 7.1 14.4 13.6 - Income related to investment in Savills (8.6) - - - - One-time compensation expense related to the initial public offering - - 15.0 - - EBITDA 653.5 454.2 245.3 132.8 130.7 Add: 9.8 11.2 6.9 4.6 3.2 Less: 67.6 45.5 54.8 92.6 24.6 45.0 56.3 68.1 72.3 60.5 33.8 7.4 21.1 13.5 - 198.3 138.9 43.5 (6.3) 30.1 Net income (loss) 318.6 217.3 64.7 (34.7) 18.7 Revenue (before reimbursement reclass) 3,756.7 2,910.6 2,365.1 1,630.1 1,170.3 Revenue (after reimbursement reclass) 4,032.0 3,194.0 2,647.1 1,810.1 1,361.8 Normalized EBITDA Margins (before reimbursement reclass) 17.4% 15.8% 12.7% 11.2% 11.2% Normalized EBITDA Margins (after reimbursement reclass) 16.2% 14.4% 11.3% 10.1% 9.6% Provision (benefit) for income taxes Loss on extinguishment of debt Interest expense Depreciation and amortization Interest income |
|
|
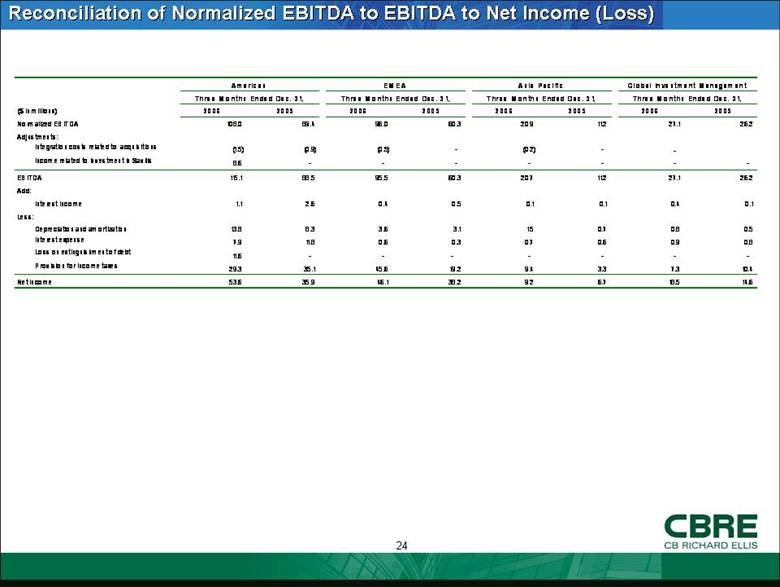
Reconciliation of Normalized EBITDA to EBITDA to Net Income (Loss) Americas EMEA Asia Pacific Global Investment Management Three Months Ended Dec. 31, Three Months Ended Dec. 31, Three Months Ended Dec. 31, Three Months Ended Dec. 31, ($ in millions) 2006 2005 2006 2005 2006 2005 2006 2005 Normalized EBITDA 108.0 89.4 96.0 60.3 20.9 11.2 27.1 26.2 Adjustments: Integration costs related to acquisitions (1.5) (0.9) (0.5) - (0.2) - - Income related to investment in Savills 8.6 - - - - - - - EBITDA 115.1 88.5 95.5 60.3 20.7 11.2 27.1 26.2 Add: Interest income 1.1 2.6 0.4 0.5 0.1 0.1 0.4 0.1 Less: Depreciation and amortization 13.8 8.3 3.6 3.1 1.5 0.7 0.8 0.5 Interest expense 7.9 11.8 0.6 0.3 0.7 0.6 0.9 0.8 Loss on extinguishment of debt 11.6 - - - - - - - Provision for income taxes 29.3 35.1 45.6 19.2 9.4 3.3 7.3 10.4 Net income 53.6 35.9 46.1 38.2 9.2 6.7 18.5 14.6 |
|
|
|