Exhibit 99.1
|
|
Investor Presentation November 2006 |

Exhibit 99.1
|
|
Investor Presentation November 2006 |
|
|
Forward Looking Statements This presentation contains statements that are forward looking within the meaning of the Private Securities Litigation Reform Act of 1995, including statements regarding our growth momentum in 2006, future operations, future financial performance, and the impact of our acquisition of the Trammell Crow Company and related financing. These statements should be considered as estimates only and actual results may ultimately differ from these estimates. Except to the extent required by applicable securities laws, we undertake no obligation to update or publicly revise any of the forward-looking statements that you may hear today. Please refer to our current annual report on Form 10-K (in particular, “Risk Factors”) and our current quarterly report on Form 10-Q which are filed with the SEC and available at the SEC’s website (http://www.sec.gov), for a full discussion of the risks and other factors that may impact any estimates that you may hear today. We may make certain statements during the course of this presentation which include references to “non-GAAP financial measures”, as defined by SEC regulations. As required by these regulations, we have provided reconciliations of these measures to what we believe are the most directly comparable GAAP measures, which are attached hereto within the appendix. |
|
|
Industry/Company Trends |
|
|
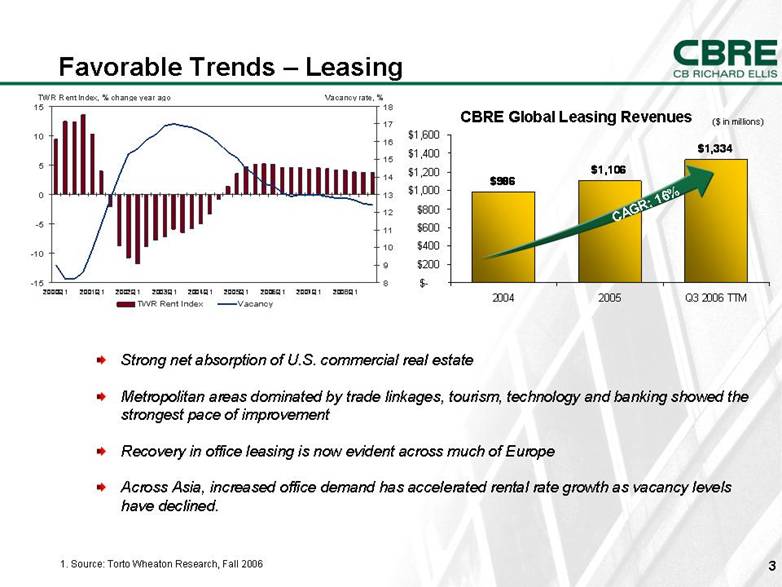
Strong net absorption of U.S. commercial real estate Metropolitan areas dominated by trade linkages, tourism, technology and banking showed the strongest pace of improvement Recovery in office leasing is now evident across much of Europe Across Asia, increased office demand has accelerated rental rate growth as vacancy levels have declined. 1. Source: Torto Wheaton Research, Fall 2006 Favorable Trends – Leasing CAGR: 16%CBRE Global Leasing Revenues ($ in millions)$986$1,106$1,334$-$200$400$600$800$1,000$1,200$1,400$1,60020042005Q3 2006 TTM-15-10-50510152000Q12001Q12002Q12003Q12004Q12005Q12006Q12007Q12008Q189101112131415161718TWR Rent IndexVacancyTWR Rent Index, % change year agoVacancy rate, % |
|
|
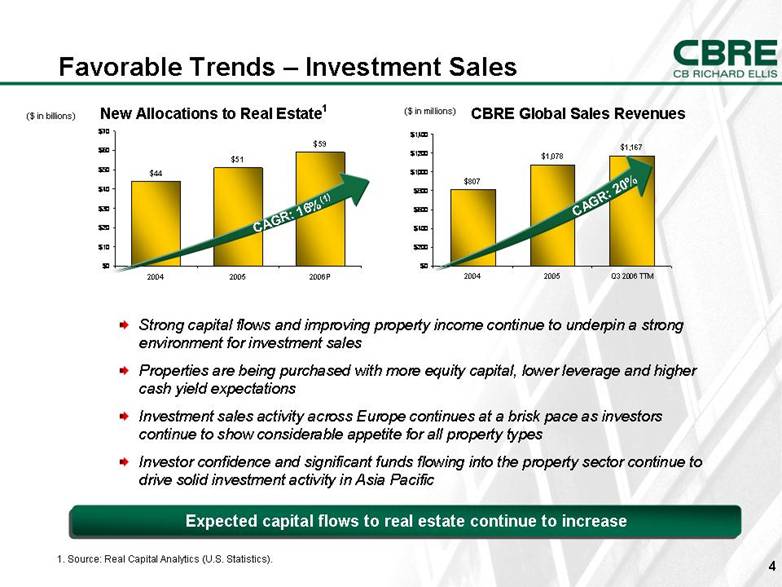
Favorable Trends – Investment Sales Strong capital flows and improving property income continue to underpin a strong environment for investment sales Properties are being purchased with more equity capital, lower leverage and higher cash yield expectations Investment sales activity across Europe continues at a brisk pace as investors continue to show considerable appetite for all property types Investor confidence and significant funds flowing into the property sector continue to drive solid investment activity in Asia Pacific($ in billions)1. Source: Real Capital Analytics (U.S. Statistics). CAGR: 16%(1) Expected capital flows to real estate continue to increase CAGR: 20%($ in millions)CBRE Global Sales Revenues New Allocations to Real Estate1 $807$1,078$1,167$0$200$400$600$800$1,000$1,200$1,40020042005Q3 2006 TTM$44$51$59$0$10$20$30$40$50$60$70200420052006P |
|
|
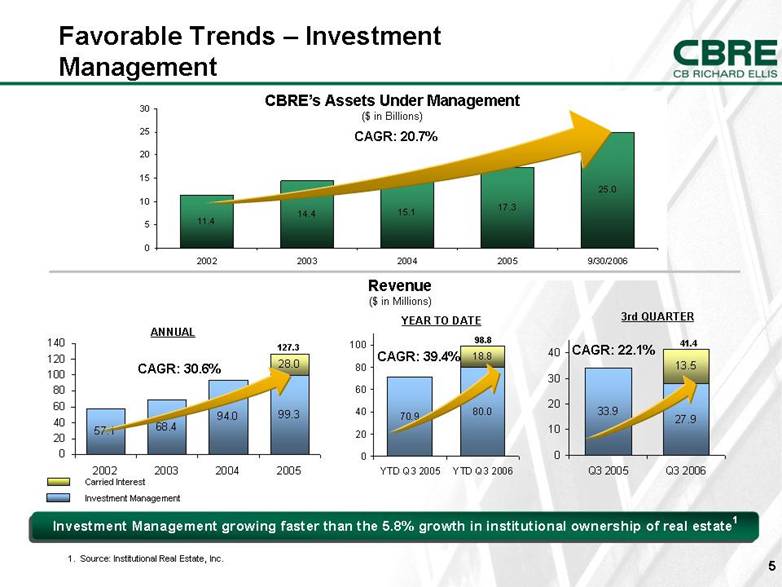
Favorable Trends – Investment Management CAGR: 20.7%Investment Management growing faster than the 5.8% growth in institutional ownership of real estate1 CBRE’s Assets Under Management ($ in Billions) Revenue ($ in Millions) CAGR: 30.6%ANNUAL Carried Interest Investment Management 1. Source: Institutional Real Estate, Inc. CAGR: 22.1%CAGR: 39.4%YEAR TO DATE 3rd QUARTER 98.8 41.4 127.3 13.527.933.9010203040Q3 2005Q3 200657.168.494.099.328.0020406080100120140200220032004200511.414.415.117.325.005101520253020022003200420059/30/200670.980.018.8020406080100YTD Q3 2005YTD Q3 2006 |
|
|
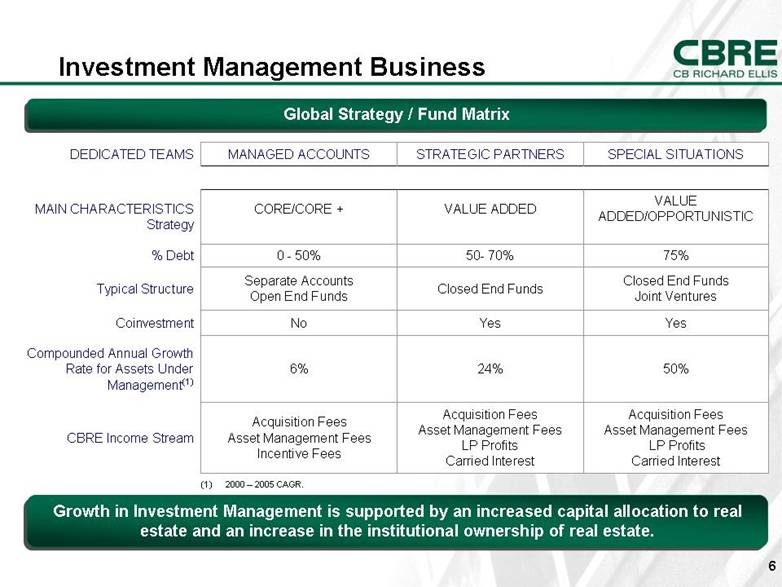
Investment Management Business Global Strategy / Fund Matrix 50% 24% 6% Compounded Annual Growth Rate for Assets Under Management(1) Yes Yes No Coinvestment Acquisition Fees Asset Management Fees LP Profits Carried Interest Acquisition Fees Asset Management Fees LP Profits Carried Interest Acquisition Fees Asset Management Fees Incentive Fees CBRE Income Stream Closed End Funds Joint Ventures Closed End Funds Separate Accounts Open End Funds Typical Structure 75% 50- 70% 0 - 50% % Debt VALUE ADDED/OPPORTUNISTIC VALUE ADDED CORE/CORE + MAIN CHARACTERISTICS Strategy SPECIAL SITUATIONSSTRATEGIC PARTNERSMANAGED ACCOUNTSDEDICATED TEAMS(1) 2000 – 2005 CAGR. Growth in Investment Management is supported by an increased capital allocation to real estate and an increase in the institutional ownership of real estate. |
|
|
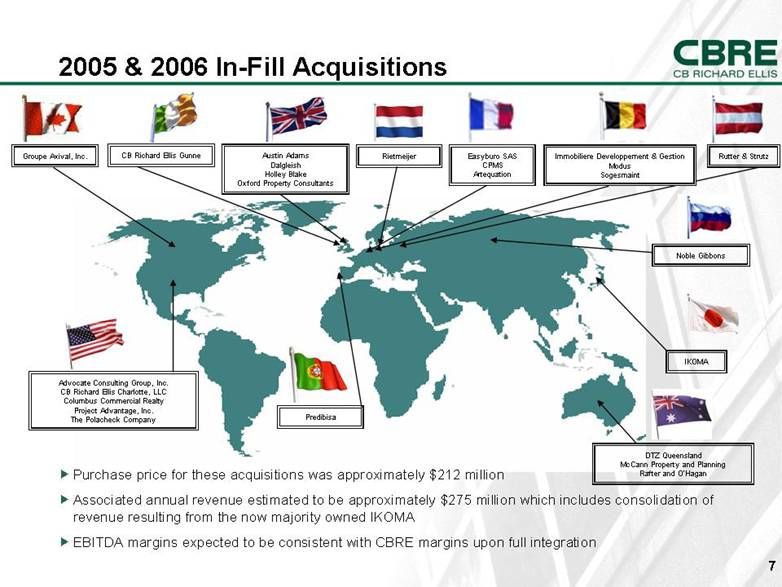
2005 & 2006 In-Fill Acquisitions Easyburo SAS CPMS Artequation DTZ Queensland McCann Property and Planning Rafter and O’Hagan Advocate Consulting Group, Inc. CB Richard Ellis Charlotte, LLC Columbus Commercial Realty Project Advantage, Inc. The Polacheck Company Rutter & Strutz Groupe Axival, Inc. Noble Gibbons IKOMA Purchase price for these acquisitions was approximately $212 million Associated annual revenue estimated to be approximately $275 million which includes consolidation of revenue resulting from the now majority owned IKOMA EBITDA margins expected to be consistent with CBRE margins upon full integration CB Richard Ellis Gunne Immobiliere Developpement & Gestion Modus Sogesmaint Rietmeijer Austin Adams Dalgleish Holley Blake Oxford Property Consultants Predibisa |
|
|
Financial Overview |
|
|
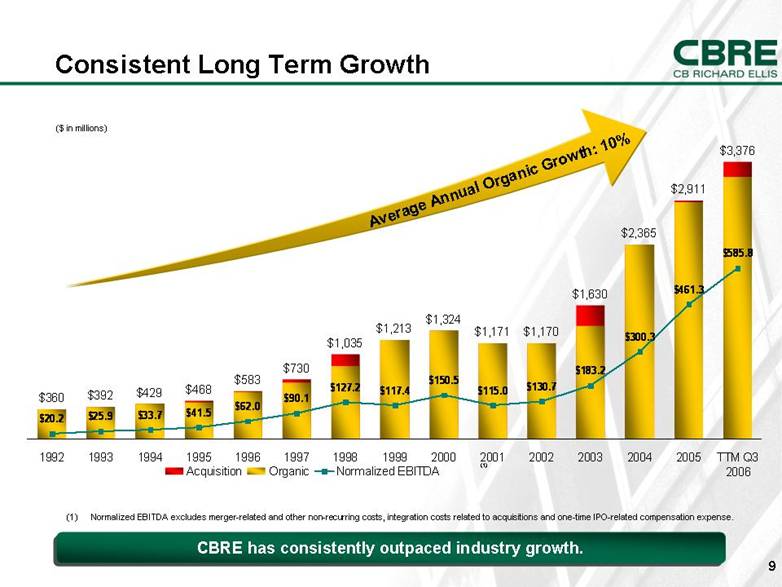
Consistent Long Term Growth CBRE has consistently outpaced industry growth. (1) Normalized EBITDA excludes merger-related and other non-recurring costs, integration costs related to acquisitions and one-time IPO-related compensation expense. ($ in millions)Average Annual Organic Growth: 10%(1) $360$392$429$468$583$730$1,035$1,213$1,324$1,171$1,170$1,630$2,365$2,911$3,376$20.2$25.9$33.7$41.5$62.0$90.1$127.2$117.4$150.5$115.0$130.7$183.2$300.3$461.3$585.819921993199419951996199719981999200020012002200320042005TTM Q32006AcquisitionOrganicNormalized EBITDA |
|
|
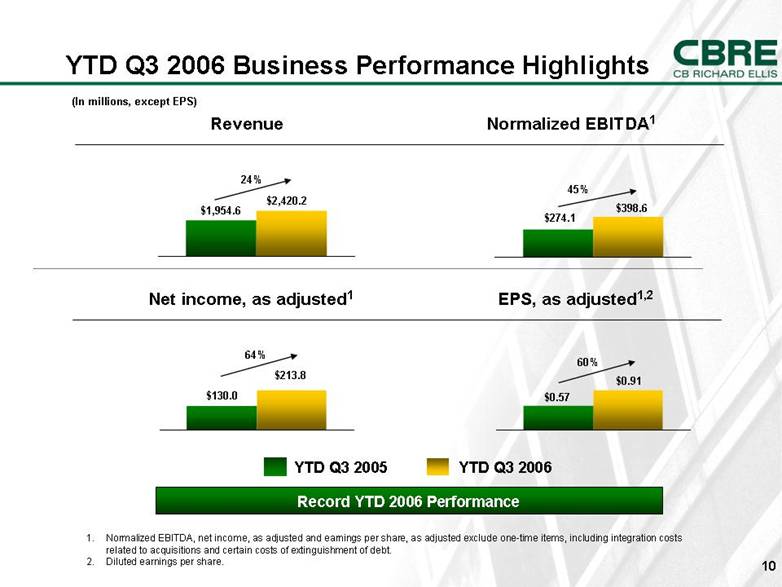
YTD Q3 2006 Business Performance Highlights YTD Q3 2005 Record YTD 2006 Performance YTD Q3 2006 $2,420.2 $1,954.6 24% (In millions, except EPS) $274.1 $398.6 45% Revenue Normalized EBITDA1 $130.0 $213.8 64% $0.57 $0.91 60% Net income, as adjusted1 EPS, as adjusted1,2 1. Normalized EBITDA, net income, as adjusted and earnings per share, as adjusted exclude one-time items, including integration costs related to acquisitions and certain costs of extinguishment of debt. 2. Diluted earnings per share. |
|
|
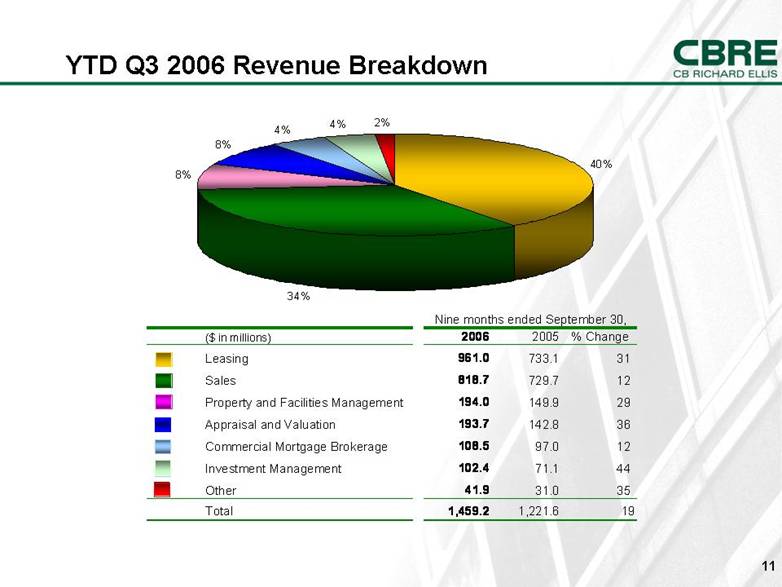
YTD Q3 2006 Revenue Breakdown ($ in millions)20062005% ChangeLeasing961.0733.131Sales818.7729.712Property and Facilities Management194.0149.929Appraisal and Valuation193.7142.836Commercial Mortgage Brokerage108.597.012Investment Management102.471.144Other41.931.035Total1,459.21,221.619Nine months ended September 30,34%8%8%4%4%2%40% |
|
|
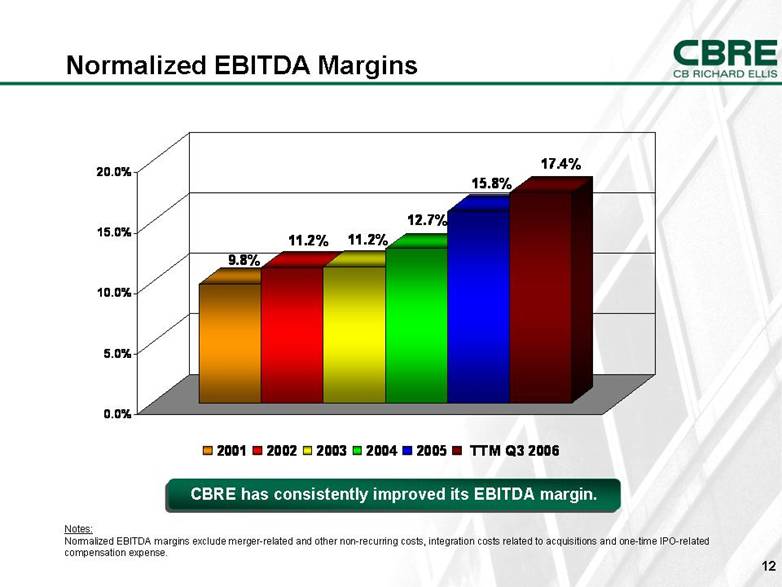
Normalized EBITDA Margins Notes: Normalized EBITDA margins exclude merger-related and other non-recurringcosts, integration costs related to acquisitions and one-time IPO-related compensation expense. CBRE has consistently improved its EBITDA margin. 9.8%11.2%11.2%12.7%15.8%17.4%0.0%5.0%10.0%15.0%20.0%20012002200320042005TTM Q3 2006 |
|
|
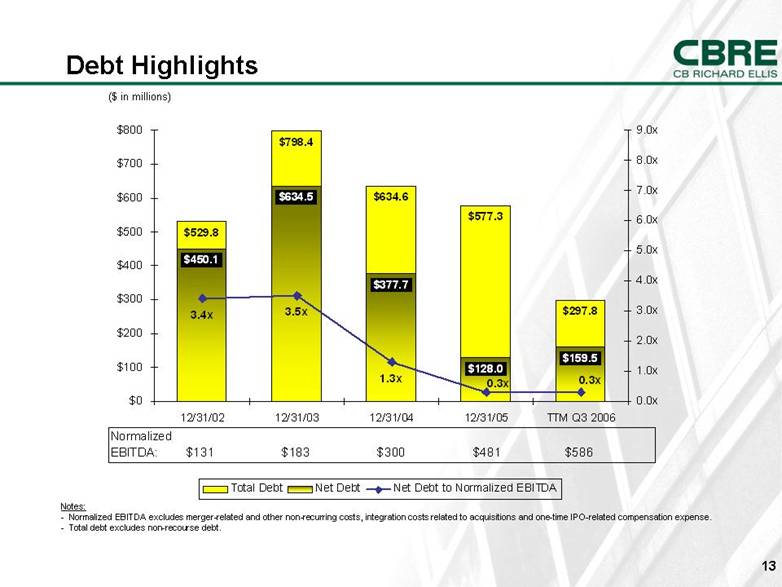
($ in millions)Debt Highlights Notes: - Normalized EBITDA excludes merger-related and other non-recurring costs, integration costs related to acquisitions and one-time IPO-related compensation expense. - Total debt excludes non-recourse debt. $529.8$798.4$634.6$577.3$297.8$450.1$634.5$377.7$128.0$159.53.4x3.5x1.3x0.3x0.3x$0$100$200$300$400$500$600$700$80012/31/0212/31/0312/31/0412/31/05TTM Q3 20060.0x1.0x2.0x3.0x4.0x5.0x6.0x7.0x8.0x9.0xTotal DebtNet DebtNet Debt to Normalized EBITDANormalized EBITDA: $131 $183 $300 $481 $586 |
|
|
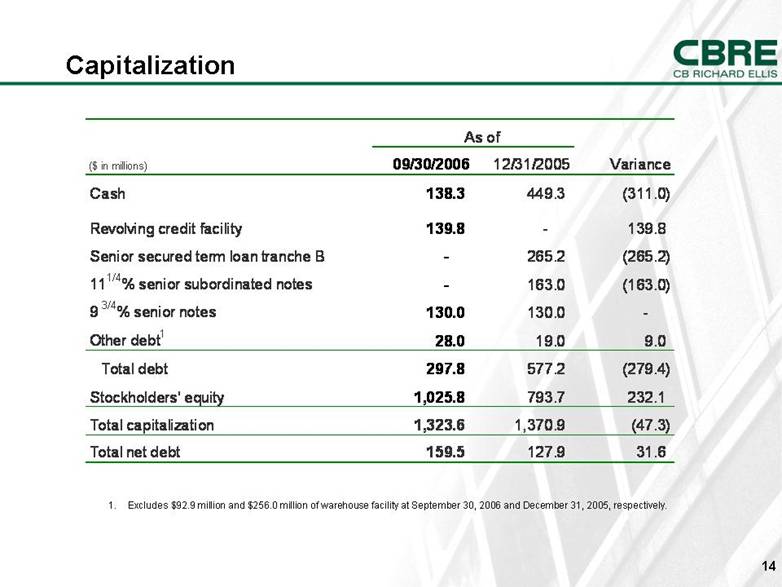
Excludes $92.9 million and $256.0 million of warehouse facility at September 30, 2006 and December 31, 2005, respectively. Capitalization ($ in millions)09/30/200612/31/2005VarianceCash138.3449.3(311.0)Revolving credit facility139.8-139.8Senior secured term loan tranche B-265.2(265.2)111/4% senior subordinated notes-163.0(163.0)9 3/4% senior notes130.0130.0-Other debt128.019.09.0Total debt297.8577.2(279.4)Stockholders' equity1,025.8793.7232.1Total capitalization1,323.61,370.9(47.3)Total net debt159.5127.931.6As of |
|
|
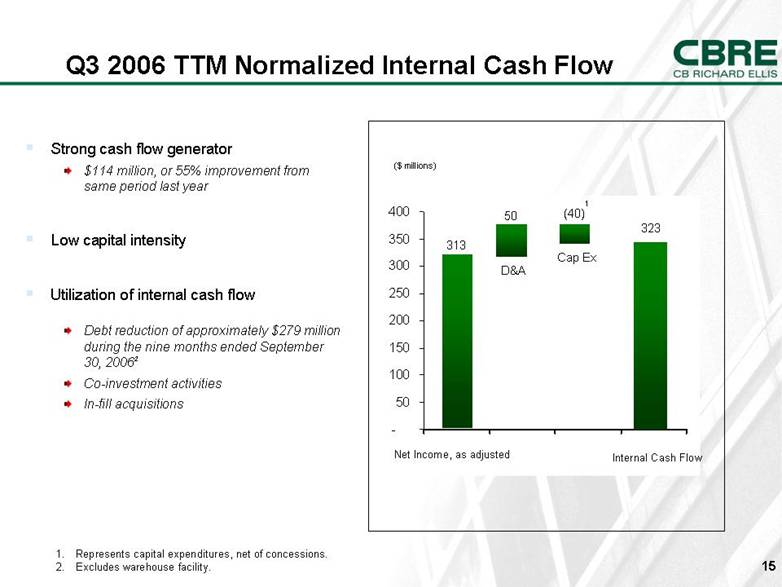
Strong cash flow generator $114 million, or 55% improvement from same period last year Low capital intensity Utilization of internal cash flow Debt reduction of approximately $279 million during the nine months ended September 30, 20062 Co-investment activities In-fill acquisitions Represents capital expenditures, net of concessions. Excludes warehouse facility. Q3 2006 TTM Normalized Internal Cash Flow ($ millions) 50 313 Net Income, as adjustedD&A Cap Ex (40) 323 Internal Cash Flow 1 -50100150200250300350400 |
|
|
Transaction Overview |
|
|
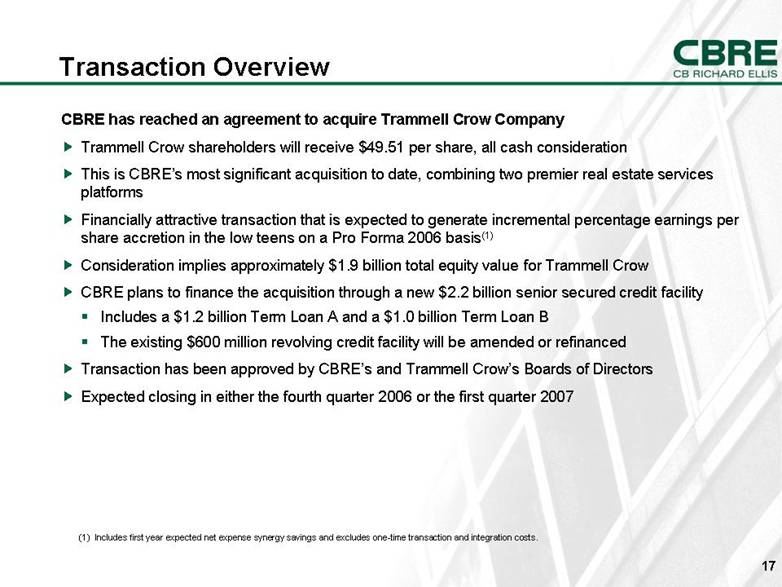
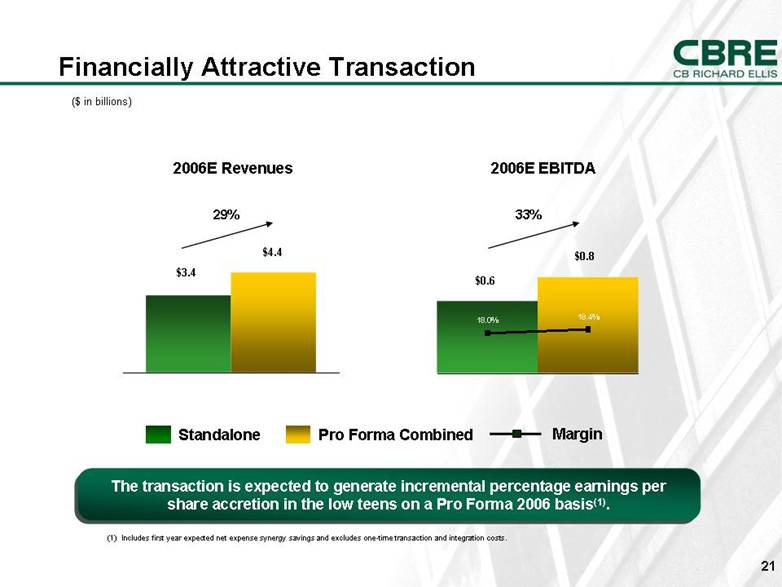
Transaction Overview CBRE has reached an agreement to acquire Trammell Crow Company Trammell Crow shareholders will receive $49.51 per share, all cash consideration This is CBRE’s most significant acquisition to date, combining two premier real estate services platforms Financially attractive transaction that is expected to generate incremental percentage earnings per share accretion in the low teens on a Pro Forma 2006 basis(1) Consideration implies approximately $1.9 billion total equity value for Trammell Crow CBRE plans to finance the acquisition through a new $2.2 billion senior secured credit facility Includes a $1.2 billion Term Loan A and a $1.0 billion Term Loan B The existing $600 million revolving credit facility will be amended or refinanced Transaction has been approved by CBRE’s and Trammell Crow’s Boards of Directors Expected closing in either the fourth quarter 2006 or the first quarter 2007 (1) Includes first year expected net expense synergy savings and excludes one-time transaction and integration costs. |
|
|
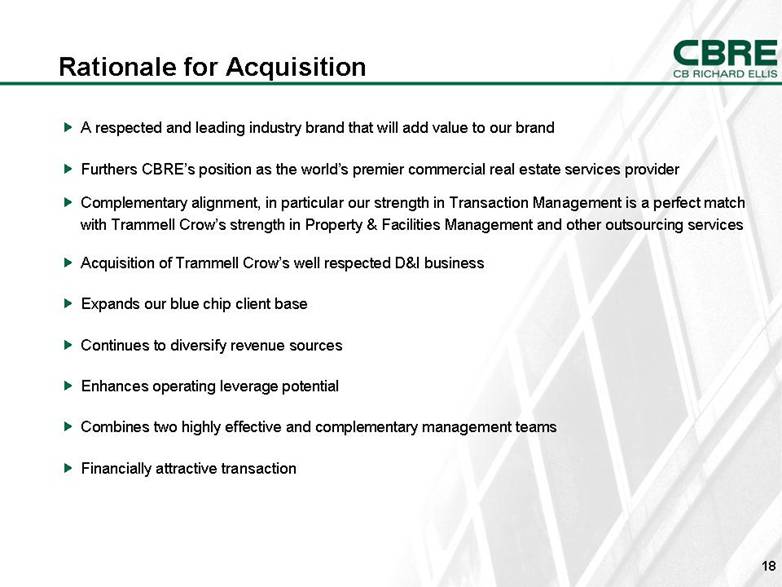
Rationale for Acquisition A respected and leading industry brand that will add value to our brand Furthers CBRE’s position as the world’s premier commercial real estate services provider Complementary alignment, in particular our strength in Transaction Management is a perfect match with Trammell Crow’s strength in Property & Facilities Management and other outsourcing services Acquisition of Trammell Crow’s well respected D&I business Expands our blue chip client base Continues to diversify revenue sources Enhances operating leverage potential Combines two highly effective and complementary management teams Financially attractive transaction |
|
|
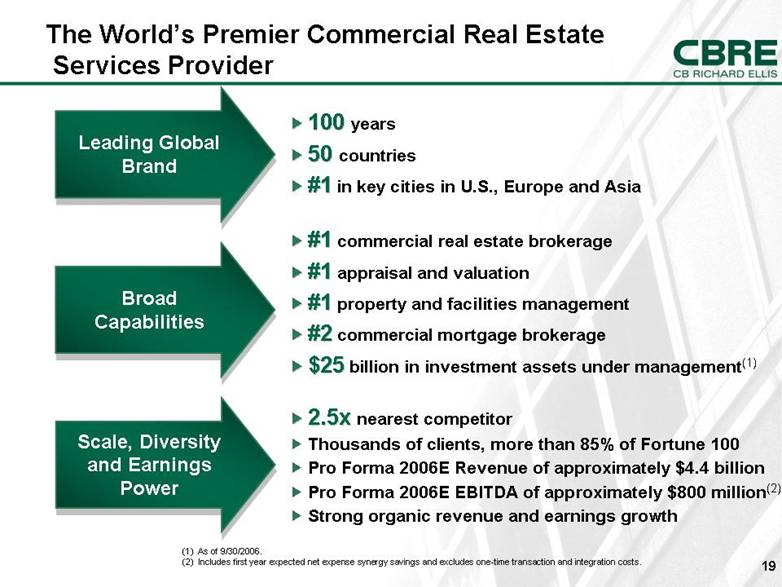
2.5x nearest competitor Thousands of clients, more than 85% of Fortune 100 Pro Forma 2006E Revenue of approximately $4.4 billion Pro Forma 2006E EBITDA of approximately $800 million(2) Strong organic revenue and earnings growth #1 commercial real estate brokerage #1 appraisal and valuation #1 property and facilities management #2 commercial mortgage brokerage $25 billion in investment assets under management(1) Leading Global Brand Broad Capabilities Scale, Diversity and Earnings Power 100 years 50 countries #1 in key cities in U.S., Europe and Asia (1) As of 9/30/2006. (2) Includes first year expected net expense synergy savings and excludes one-time transaction and integration costs. The World’s Premier Commercial Real Estate Services Provider |
|
|
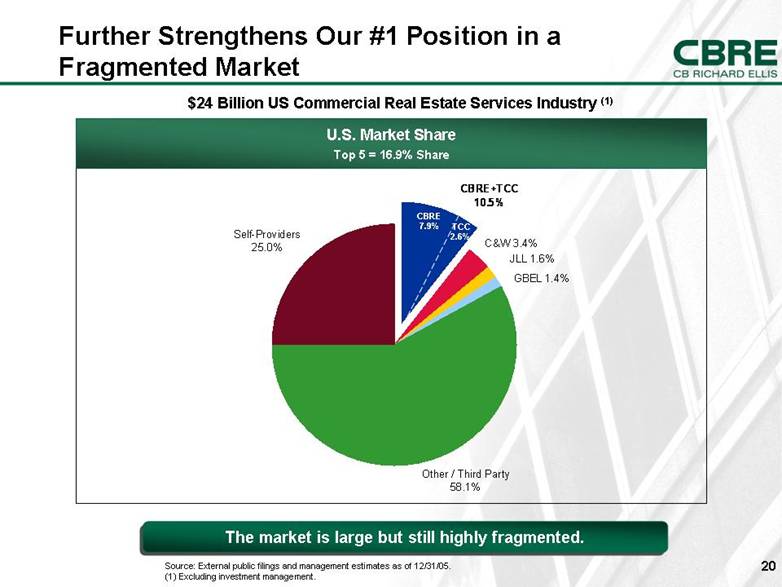
$24 Billion US Commercial Real Estate Services Industry (1)U.S. Market Share Top 5 = 16.9% Share Further Strengthens Our #1 Position in a Fragmented Market Source: External public filings and management estimates as of 12/31/05. (1) Excluding investment management. The market is large but still highly fragmented. CBRE 7.9% TCC 2.6% CBRE+TCC 10.5%C&W 3.4%JLL 1.6%GBEL 1.4%Other / Third Party 58.1%Self-Providers 25.0% |
|
|
Financially Attractive Transaction $3.4 $4.4 29% ($ in billions) 2006E Revenues 2006E EBITDA The transaction is expected to generate incremental percentage earnings per share accretion in the low teens on a Pro Forma 2006 basis(1). Standalone Pro Forma Combined $0.6 $0.8 33% (1) Includes first year expected net expense synergy savings and excludes one-time transaction and integration costs.Margin 18.4% 18.0% |
|
|
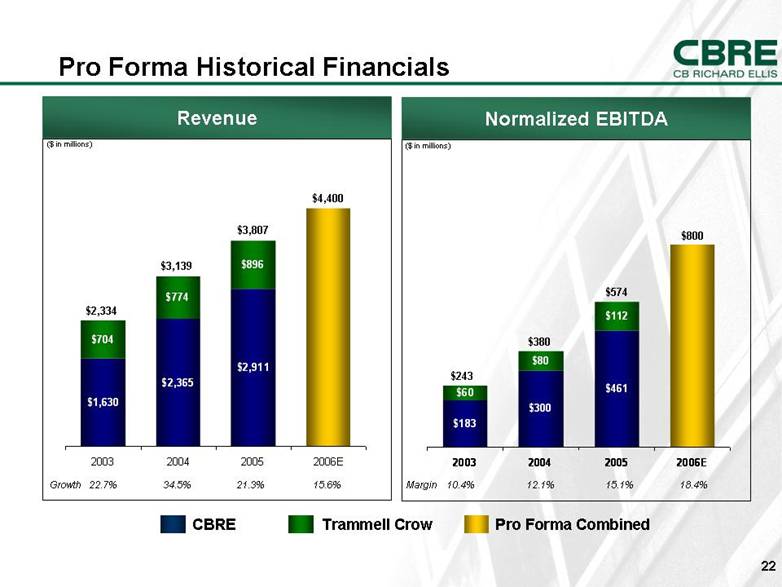
Pro Forma Historical Financials Revenue Normalized EBITDA ($ in millions) Margin 10.4% 12.1% 15.1% 18.4% ($ in millions) Growth 22.7% 34.5% 21.3% 15.6% CBRE Trammell Crow Pro Forma Combined $243 $380 $574 $800 $2,334 $3,139 $3,807 $4,400 $1,630$2,365$2,911$704$774$8962003200420052006E$183$300$461$60$80$1122003200420052006E |
|
|
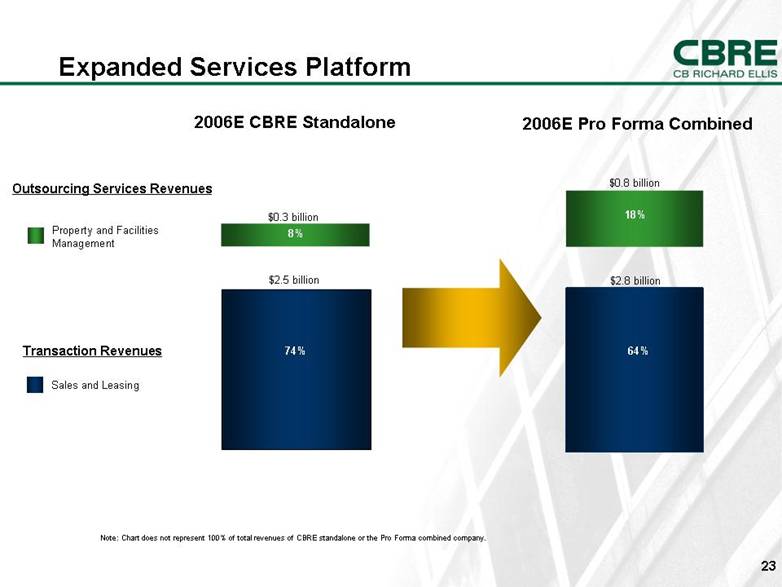
Expanded Services Platform Property and Facilities Management Sales and Leasing $0.3 billion $0.8 billion $2.8 billion 8% 18% 2006E CBRE Standalone 2006E Pro Forma Combined Outsourcing Services Revenues Transaction Revenues$2.5 billion 74% 64% Note: Chart does not represent 100% of total revenues of CBRE standalone or the Pro Forma combined company. |
|
|
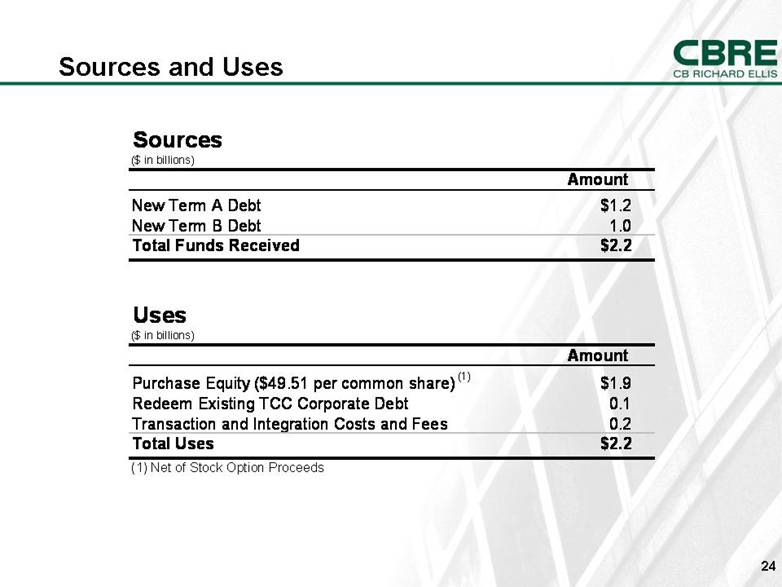
Sources and Uses Sources($ in billions)AmountNew Term A Debt$1.2New Term B Debt1.0Total Funds Received$2.2Uses($ in billions)AmountPurchase Equity ($49.51 per common share)(1)$1.9Redeem Existing TCC Corporate Debt0.1Transaction and Integration Costs and Fees0.2Total Uses$2.2(1) Net of Stock Option Proceeds |
|
|
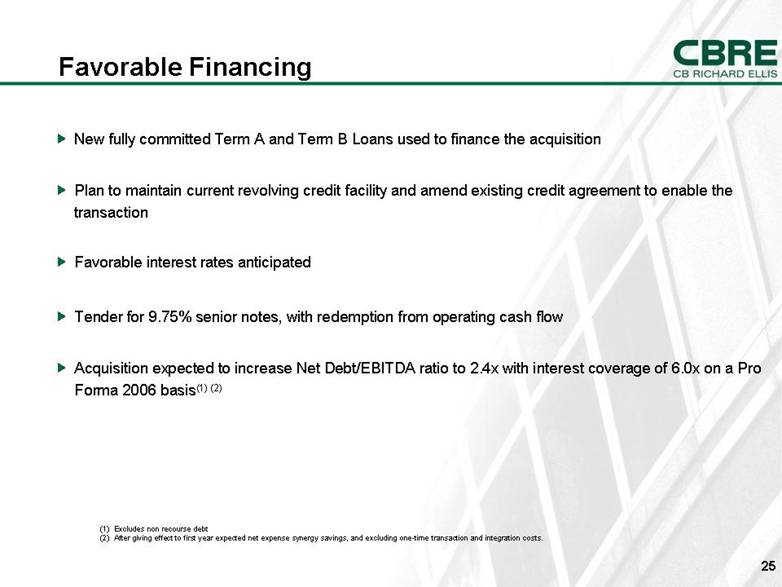
Favorable Financing New fully committed Term A and Term B Loans used to finance the acquisition Plan to maintain current revolving credit facility and amend existing credit agreement to enable the transaction Favorable interest rates anticipated Tender for 9.75% senior notes, with redemption from operating cash flow Acquisition expected to increase Net Debt/EBITDA ratio to 2.4x with interest coverage of 6.0x on a Pro Forma 2006 basis(1)(2) (1) Excludes non recourse debt (2) After giving effect to first year expected net expense synergy savings, and excluding one-time transaction and integration costs. |
|
|
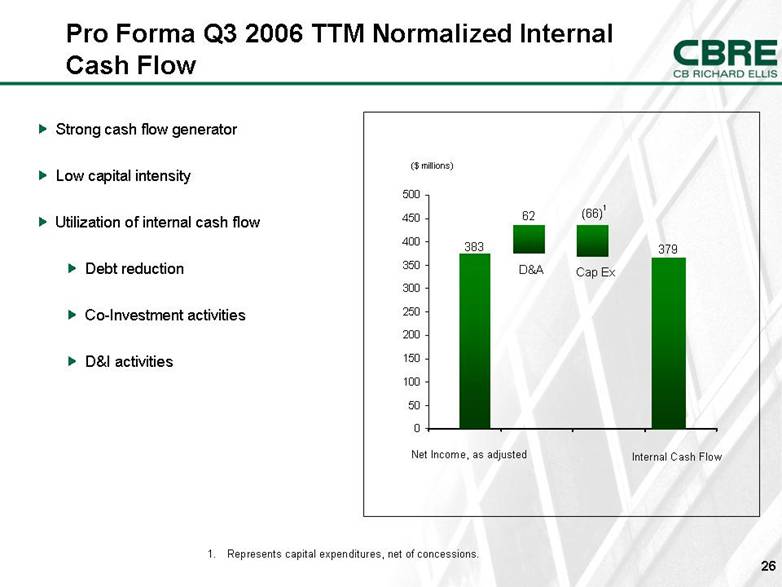
Represents capital expenditures, net of concessions. Pro Forma Q3 2006 TTM Normalized Internal Cash Flow ($ millions) 62 383 Net Income, as adjustedD&A Cap Ex (66) 379 Internal Cash Flow 1 Strong cash flow generator Low capital intensity Utilization of internal cash flow Debt reduction Co-Investment activities D&I activities 050100150200250300350400450500 |
|
|
Appendix |
|
|
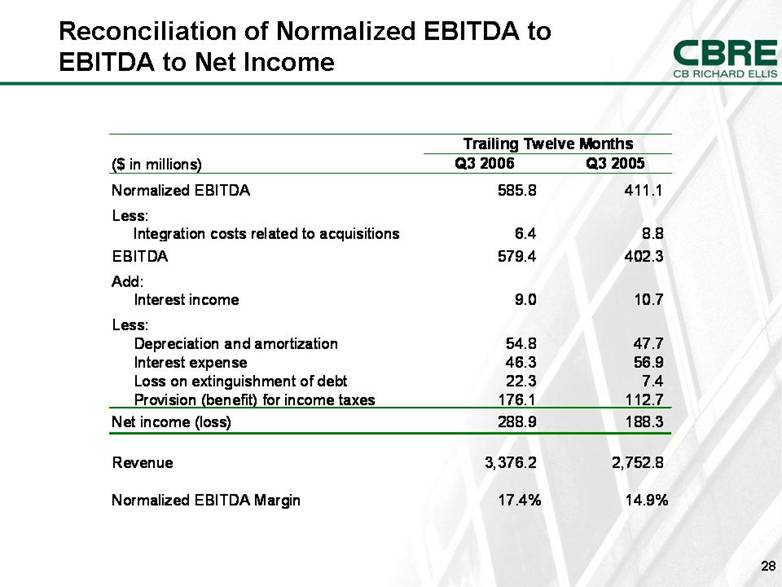
Reconciliation of Normalized EBITDA to EBITDA to Net Income ($ in millions)Q3 2006Q3 2005Normalized EBITDA585.8411.1Less:Integration costs related to acquisitions6.48.8EBITDA579.4402.3Add: Interest income9.010.7Less:Depreciation and amortization54.847.7Interest expense46.356.9Loss on extinguishment of debt22.37.4Provision (benefit) for income taxes176.1112.7Net income (loss)288.9188.3Revenue3,376.22,752.8Normalized EBITDA Margin17.4%14.9%Trailing Twelve Months |
|
|
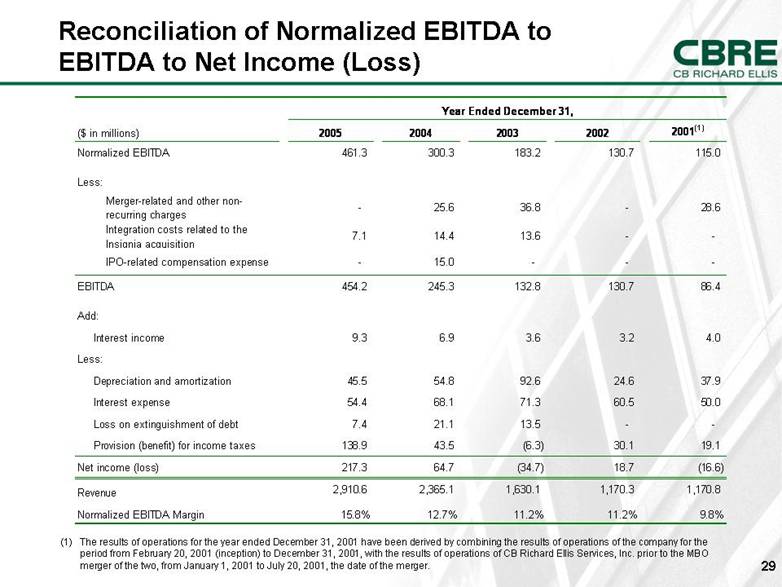
Reconciliation of Normalized EBITDA to EBITDA to Net Income (Loss) (1) The results of operations for the year ended December 31, 2001 have been derived by combining the results of operations of the company for the period from February 20, 2001 (inception) to December 31, 2001, with the results of operations of CB Richard Ellis Services, Inc. prior to the MBO merger of the two, from January 1, 2001 to July 20, 2001, the date of the merger. Year Ended December 31,($ in millions)20052004200320022001(1)Normalized EBITDA461.3300.3183.2130.7115.0Less:Merger-related and other non-recurring charges-25.636.8-28.6Integration costs related to the Insignia acquisition7.114.413.6--IPO-related compensation expense-15.0---EBITDA454.2245.3132.8130.786.4Add: Interest income9.36.93.63.24.0Less:Depreciation and amortization45.554.892.624.637.9Interest expense54.468.171.360.550.0Loss on extinguishment of debt7.421.113.5--Provision (benefit) for income taxes138.943.5(6.3)30.119.1Net income (loss)217.364.7(34.7)18.7(16.6)Revenue2,910.62,365.11,630.11,170.31,170.8Normalized EBITDA Margin15.8%12.7%11.2%11.2%9.8% |
|
|
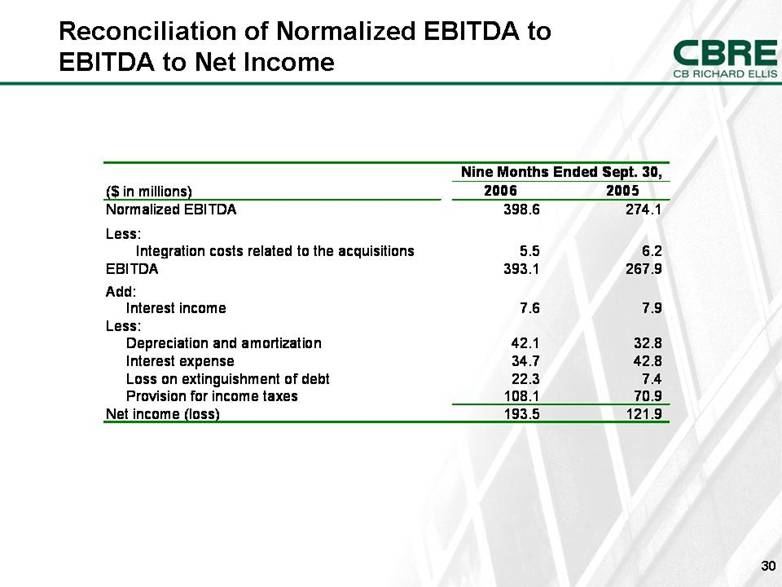
Reconciliation of Normalized EBITDA to EBITDA to Net Income ($ in millions)20062005Normalized EBITDA398.6274.1Less:Integration costs related to the acquisitions5.56.2EBITDA393.1267.9Add: Interest income7.67.9Less:Depreciation and amortization42.132.8Interest expense34.742.8Loss on extinguishment of debt22.37.4Provision for income taxes108.170.9Net income (loss)193.5121.9Nine Months Ended Sept. 30, |
|
|
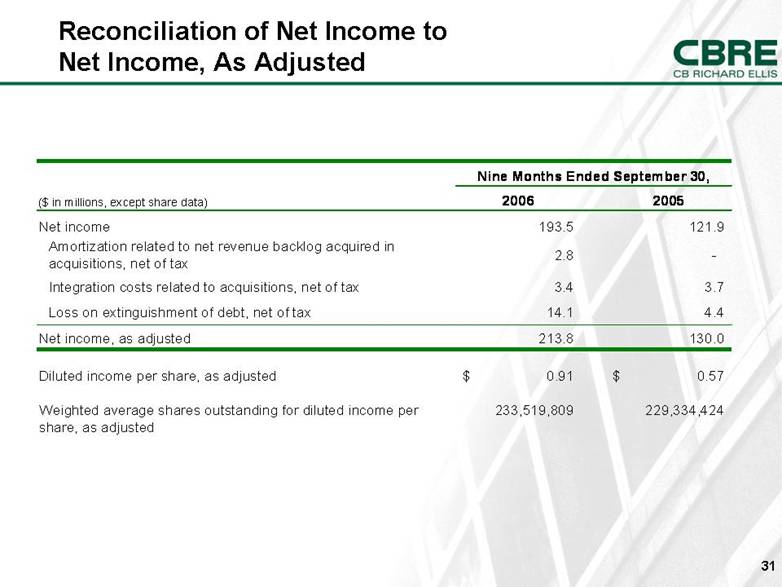
Reconciliation of Net Income to Net Income, As Adjusted Nine Months Ended September 30,($ in millions, except share data)20062005Net income 193.5121.9Amortization related to net revenue backlog acquired in acquisitions, net of tax2.8-Integration costs related to acquisitions, net of tax3.43.7Loss on extinguishment of debt, net of tax14.14.4Net income, as adjusted213.8130.0Diluted income per share, as adjusted0.91$ 0.57$ Weighted average shares outstanding for diluted income per share, as adjusted233,519,809229,334,424 |
|
|
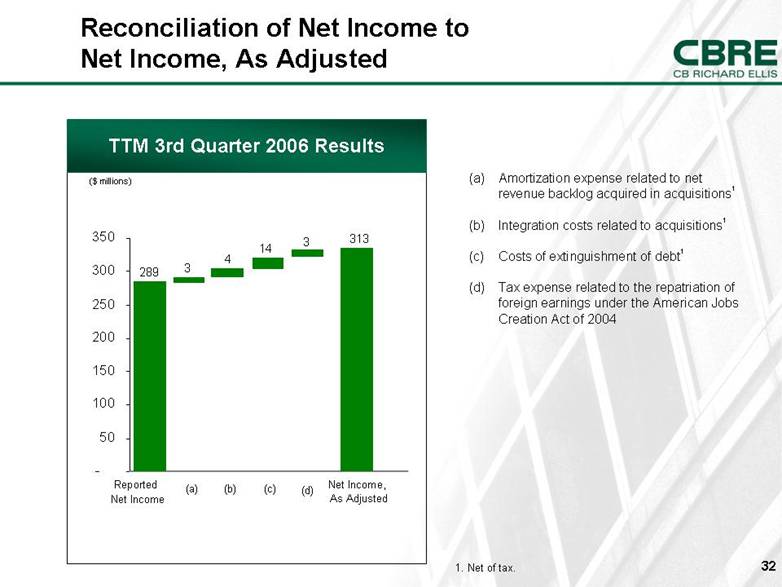
(a) Amortization expense related to net revenue backlog acquired in acquisitions1 (b) Integration costs related to acquisitions1 (c) Costs of extinguishment of debt1 (d) Tax expense related to the repatriation of foreign earnings under the American Jobs Creation Act of 2004 Net Income, As Adjusted TTM 3rd Quarter 2006 Results ($ millions) 289 313 3 4 Reported Net Income (a) (b) (c) 1. Net of tax. 14 3 (d) Reconciliation of Net Income to Net Income, As Adjusted -50100150200250300350 |
|
|
|