Exhibit 99.2
|
CB Richard Ellis Group, Inc. Third Quarter 2006 Earnings Conference Call October 26, 2006 |
Exhibit 99.2
|
CB Richard Ellis Group, Inc. Third Quarter 2006 Earnings Conference Call October 26, 2006 |
|
Forward Looking Statements This presentation contains statements that are forward looking within the meaning of the Private Securities Litigation Reform Act of 1995, including statements regarding our growth momentum in 2006, future operations, the impact of acquisitions and future financial performance. These statements should be considered as estimates only and actual results may ultimately differ from these estimates. Except to the extent required by applicable securities laws, we undertake no obligation to update or publicly revise any of the forward-looking statements that you may hear today. Please refer to our current annual report on Form 10-K (in particular, Risk Factors) and our current quarterly report on Form 10-Q, which are filed with the SEC and available at the SEC’s website (http://www.sec.gov), for a full discussion of the risks and other factors that may impact any estimates that you may hear today. We may make certain statements during the course of this presentation which include references to “non-GAAP financial measures,” as defined by SEC regulations. As required by these regulations, we have provided reconciliations of these measures to what we believe are the most directly comparable GAAP measures, which are attached hereto within the appendix. |
|
Conference Call Participants Brett White, President & Chief Executive Officer Kenneth J. Kay, Sr. Executive Vice President & Chief Financial Officer Christopher Ludeman, President, U.S. Brokerage Shelley Young, Director, Investor Relations |
|
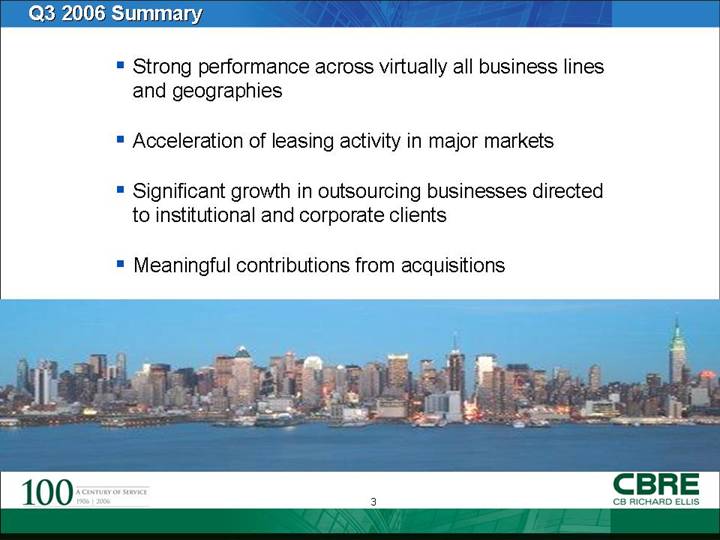
Strong performance across virtually all business lines and geographies Acceleration of leasing activity in major markets Significant growth in outsourcing businesses directed to institutional and corporate clients Meaningful contributions from acquisitions Q3 2006 Summary |
|
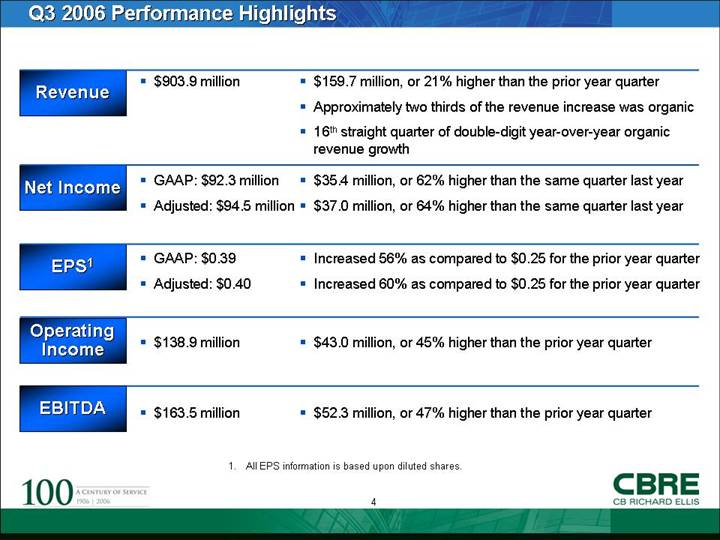
Q3 2006 Performance Highlights Revenue $903.9 million $159.7 million, or 21% higher than the prior year quarter Approximately two thirds of the revenue increase was organic 16th straight quarter of double-digit year-over-year organic revenue growth $35.4 million, or 62% higher than the same quarter last year $37.0 million, or 64% higher than the same quarter last year GAAP: $92.3 million Adjusted: $94.5 million Increased 56% as compared to $0.25 for the prior year quarter Increased 60% as compared to $0.25 for the prior year quarter GAAP: $0.39 Adjusted: $0.40 $138.9 million $43.0 million, or 45% higher than the prior year quarter $52.3 million, or 47% higher than the prior year quarter $163.5 million Net Income EPS1 Operating Income EBITDA 1. All EPS information is based upon diluted shares. |
|
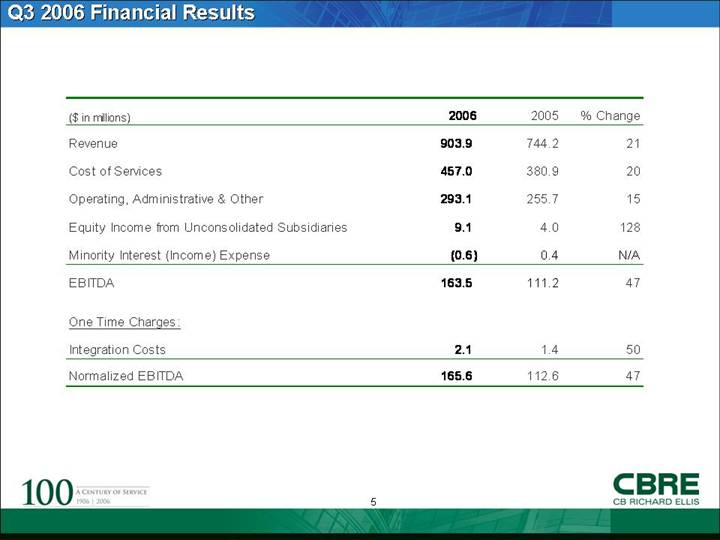
Q3 2006 Financial Results ($ in millions) 2006 2005 % Change Revenue 903.9 744.2 21 Cost of Services 457.0 380.9 20 Operating, Administrative & Other 293.1 255.7 15 Equity Income from Unconsolidated Subsidiaries 9.1 4.0 128 Minority Interest (Income) Expense (0.6) 0.4 N/A EBITDA 163.5 111.2 47 One Time Charges: Integration Costs 2.1 1.4 50 Normalized EBITDA 165.6 112.6 47 |
|
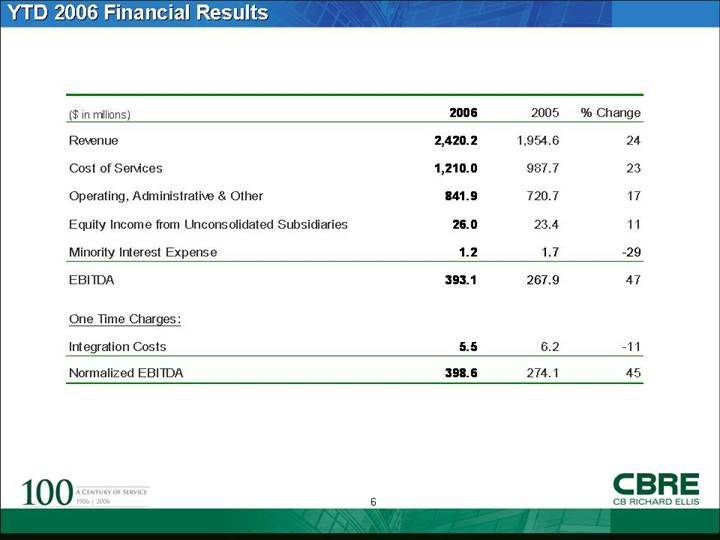
YTD 2006 Financial Results ($ in millions) 2006 2005 % Change Revenue 2,420.2 1,954.6 24 Cost of Services 1,210.0 987.7 23 Operating, Administrative & Other 841.9 720.7 17 Equity Income from Unconsolidated Subsidiaries 26.0 23.4 11 Minority Interest Expense 1.2 1.7 -29 EBITDA 393.1 267.9 47 One Time Charges: Integration Costs 5.5 6.2 -11 Normalized EBITDA 398.6 274.1 45 |
|
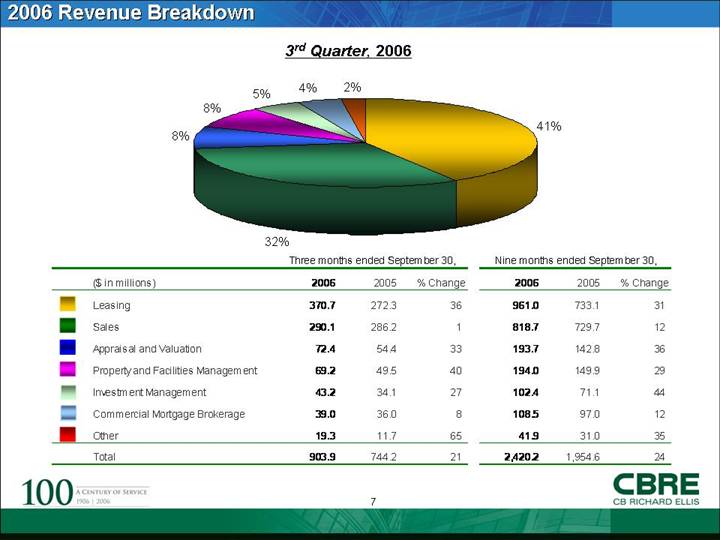
2006 Revenue Breakdown 3rd Quarter, 2006 ($ in millions) 2006 2005 % Change 2006 2005 % Change Leasing 370.7 272.3 36 961.0 733.1 31 Sales 290.1 286.2 1 818.7 729.7 12 Appraisal and Valuation 72.4 54.4 33 193.7 142.8 36 Property and Facilities Management 69.2 49.5 40 194.0 149.9 29 Investment Management 43.2 34.1 27 102.4 71.1 44 Commercial Mortgage Brokerage 39.0 36.0 8 108.5 97.0 12 Other 19.3 11.7 65 41.9 31.0 35 Total 903.9 744.2 21 2,420.2 1,954.6 24 Three months ended September 30, Nine months ended September 30, 41% 32% 8% 8% 5% 4% 2% |
|
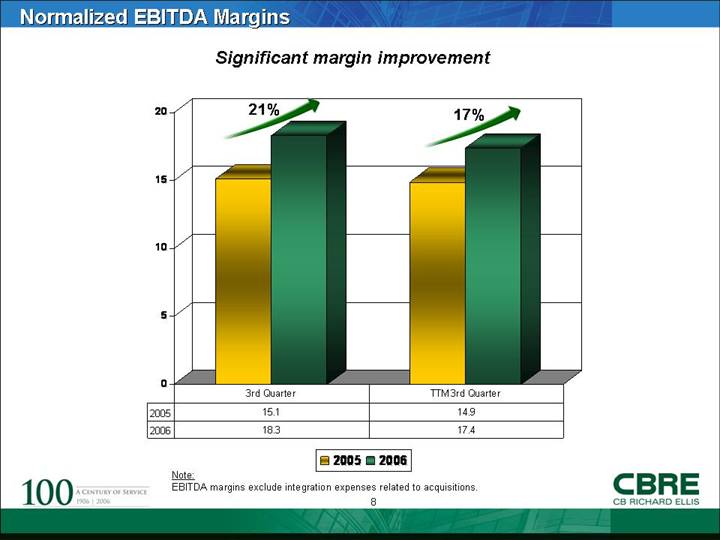
Normalized EBITDA Margins Significant margin improvement Note: EBITDA margins exclude integration expenses related to acquisitions. 21% 17% 0 5 10 15 20 2005 2006 2005 15.1 14.9 2006 18.3 17.4 3rd Quarter TTM 3rd Quarter |
|
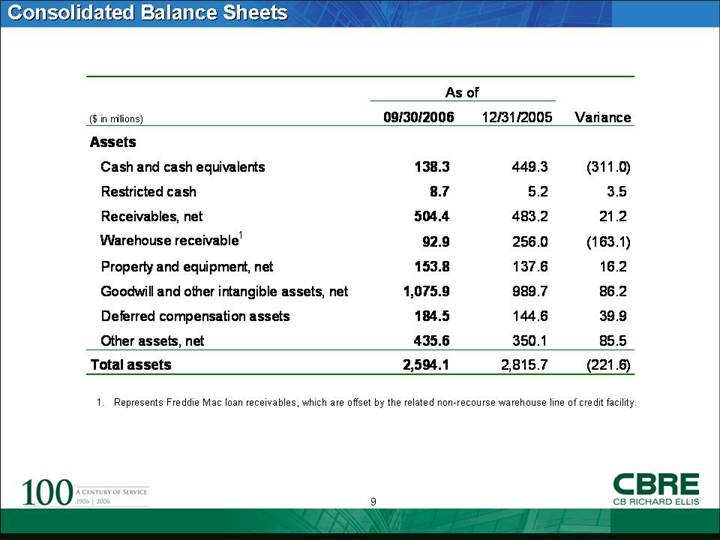
Consolidated Balance Sheets 1. Represents Freddie Mac loan receivables, which are offset by the related non-recourse warehouse line of credit facility. ($ in millions) 09/30/2006 12/31/2005 Variance Assets Cash and cash equivalents 138.3 449.3 (311.0) Restricted cash 8.7 5.2 3.5 Receivables, net 504.4 483.2 21.2 Warehouse receivable 1 92.9 256.0 (163.1) Property and equipment, net 153.8 137.6 16.2 Goodwill and other intangible assets, net 1,075.9 989.7 86.2 Deferred compensation assets 184.5 144.6 39.9 Other assets, net 435.6 350.1 85.5 Total assets 2,594.1 2,815.7 (221.6) As of |
|
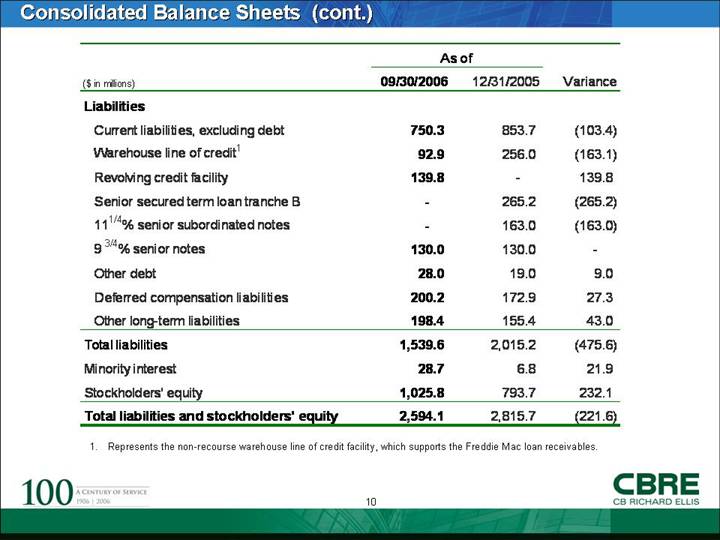
Consolidated Balance Sheets (cont.) Represents the non-recourse warehouse line of credit facility, which supports the Freddie Mac loan receivables. ($ in millions) 09/30/2006 12/31/2005 Variance Liabilities Current liabilities, excluding debt 750.3 853.7 (103.4) Warehouse line of credit 1 92.9 256.0 (163.1) Revolving credit facility 139.8 - 139.8 Senior secured term loan tranche B - 265.2 (265.2) 11 1/4 % senior subordinated notes - 163.0 (163.0) 9 3/4 % senior notes 130.0 130.0 - Other debt 28.0 19.0 9.0 Deferred compensation liabilities 200.2 172.9 27.3 Other long-term liabilities 198.4 155.4 43.0 Total liabilities 1,539.6 2,015.2 (475.6) Minority interest 28.7 6.8 21.9 Stockholders' equity 1,025.8 793.7 232.1 Total liabilities and stockholders' equity 2,594.1 2,815.7 (221.6) As of |
|
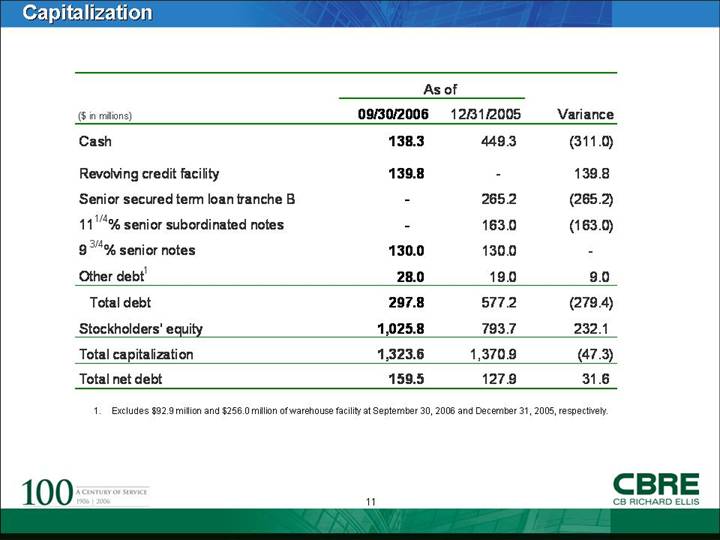
Capitalization Excludes $92.9 million and $256.0 million of warehouse facility at September 30, 2006 and December 31, 2005, respectively. ($ in millions) 09/30/2006 12/31/2005 Variance Cash 138.3 449.3 (311.0) Revolving credit facility 139.8 - 139.8 Senior secured term loan tranche B - 265.2 (265.2) 11 1/4 % senior subordinated notes - 163.0 (163.0) 9 3/4 % senior notes 130.0 130.0 - Other debt 1 28.0 19.0 9.0 Total debt 297.8 577.2 (279.4) Stockholders' equity 1,025.8 793.7 232.1 Total capitalization 1,323.6 1,370.9 (47.3) Total net debt 159.5 127.9 31.6 As of |
|
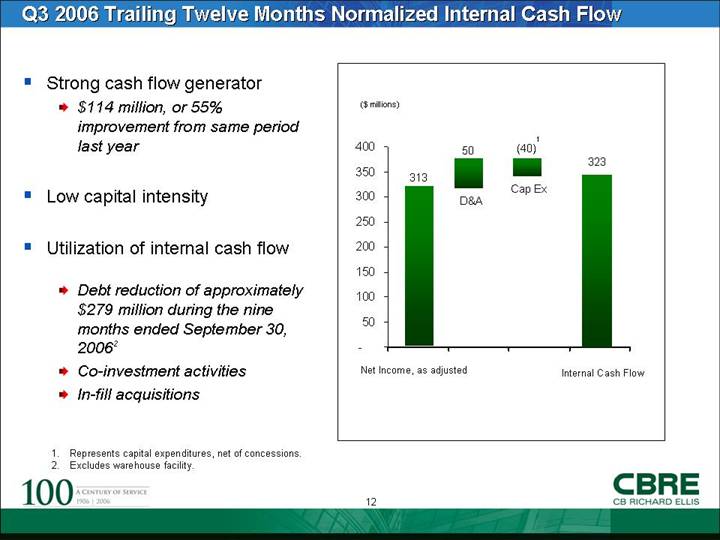
Strong cash flow generator $114 million, or 55% improvement from same period last year Low capital intensity Utilization of internal cash flow Debt reduction of approximately $279 million during the nine months ended September 30, 20062 Co-investment activities In-fill acquisitions Q3 2006 Trailing Twelve Months Normalized Internal Cash Flow ($ millions) 50 313 Net Income, as adjusted D&A Cap Ex (40) 323 Represents capital expenditures, net of concessions. Excludes warehouse facility. Internal Cash Flow 1 - 50 100 150 200 250 300 350 400 |
|
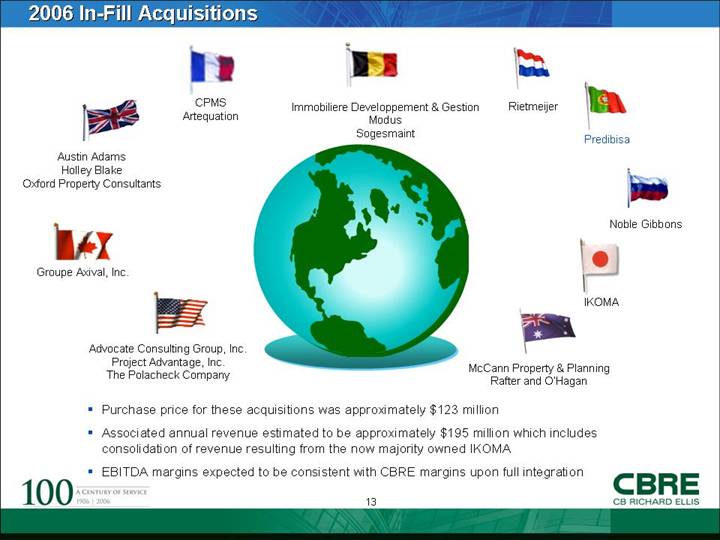
2006 In-Fill Acquisitions Austin Adams Holley Blake Oxford Property Consultants Groupe Axival, Inc. CPMS Artequation McCann Property & Planning Rafter and O’Hagan Advocate Consulting Group, Inc. Project Advantage, Inc. The Polacheck Company Rietmeijer Immobiliere Developpement & Gestion Modus Sogesmaint Noble Gibbons IKOMA Purchase price for these acquisitions was approximately $123 million Associated annual revenue estimated to be approximately $195 million which includes consolidation of revenue resulting from the now majority owned IKOMA EBITDA margins expected to be consistent with CBRE margins upon full integration Predibisa |
|
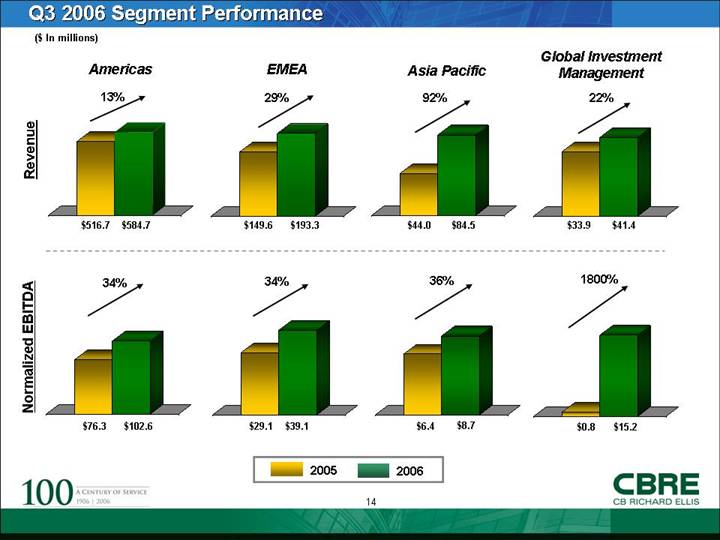
Q3 2006 Segment Performance $584.7 ($ In millions) Revenue Normalized EBITDA Americas EMEA Asia Pacific Global Investment Management $516.7 $193.3 $149.6 $84.5 $44.0 $41.4 $33.9 $102.6 $76.3 $39.1 $29.1 $8.7 $6.4 $15.2 $0.8 13% 29% 92% 22% 34% 34% 1800% 2006 2005 36% |
|
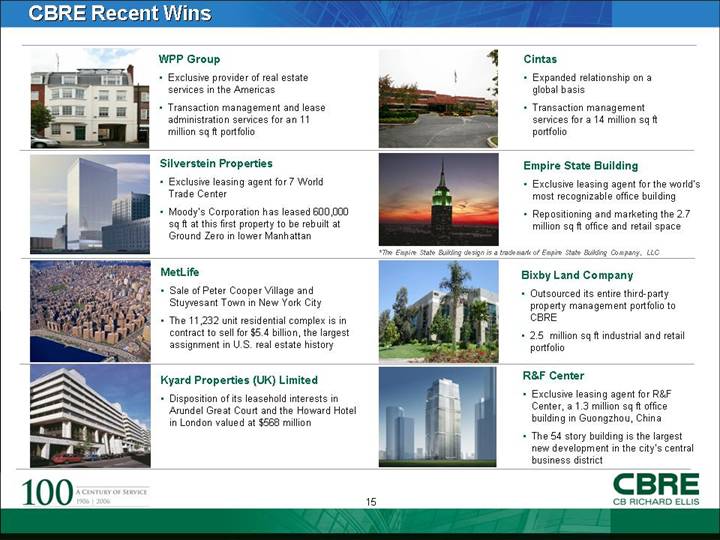
CBRE Recent Wins WPP Group Exclusive provider of real estate services in the Americas Transaction management and lease administration services for an 11 million sq ft portfolio Cintas Expanded relationship on a global basis Transaction management services for a 14 million sq ft portfolio Silverstein Properties Exclusive leasing agent for 7 World Trade Center Moody’s Corporation has leased 600,000 sq ft at this first property to be rebuilt at Ground Zero in lower Manhattan Empire State Building Exclusive leasing agent for the world’s most recognizable office building Repositioning and marketing the 2.7 million sq ft office and retail space R&F Center Exclusive leasing agent for R&F Center, a 1.3 million sq ft office building in Guongzhou, China The 54 story building is the largest new development in the city’s central business district MetLife Sale of Peter Cooper Village and Stuyvesant Town in New York City The 11,232 unit residential complex is in contract to sell for $5.4 billion, the largest assignment in U.S. real estate history Kyard Properties (UK) Limited Disposition of its leasehold interests in Arundel Great Court and the Howard Hotel in London valued at $568 million *The Empire State Building design is a trademark of Empire State Building Company, LLC Bixby Land Company Outsourced its entire third-party property management portfolio to CBRE 2.5 million sq ft industrial and retail portfolio |
|
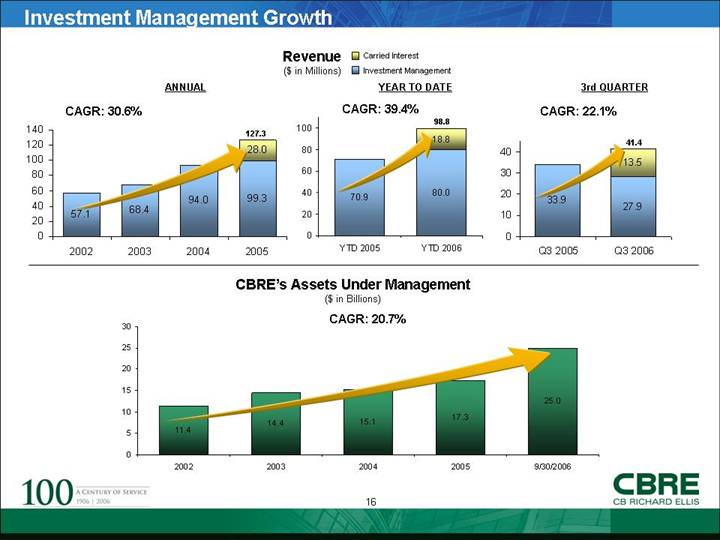
Investment Management Growth Revenue ($ in Millions) CAGR: 30.6% CAGR: 22.1% CAGR: 39.4% ANNUAL YEAR TO DATE 3rd QUARTER 127.3 98.8 Carried Interest Investment Management CAGR: 20.7% CBRE’s Assets Under Management ($ in Billions) 41.4 57.1 68.4 94.0 99.3 28.0 0 20 40 60 80 100 120 140 2002 2003 2004 2005 70.9 80.0 18.8 0 20 40 60 80 100 YTD 2005 YTD 2006 11.4 14.4 15.1 17.3 25.0 0 5 10 15 20 25 30 2002 2003 2004 2005 9/30/2006 13.5 33.9 27.9 0 10 20 30 40 Q3 2005 Q3 2006 |
|
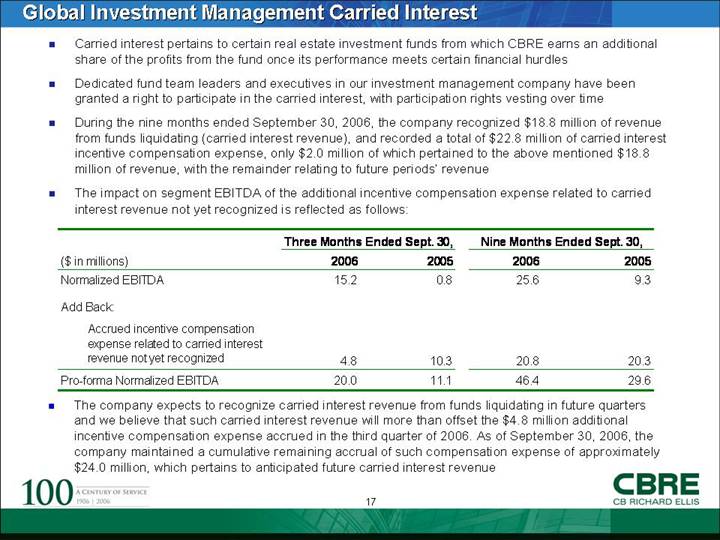
Global Investment Management Carried Interest Carried interest pertains to certain real estate investment funds from which CBRE earns an additional share of the profits from the fund once its performance meets certain financial hurdles Dedicated fund team leaders and executives in our investment management company have been granted a right to participate in the carried interest, with participation rights vesting over time During the nine months ended September 30, 2006, the company recognized $18.8 million of revenue from funds liquidating (carried interest revenue), and recorded a total of $22.8 million of carried interest incentive compensation expense, only $2.0 million of which pertained to the above mentioned $18.8 million of revenue, with the remainder relating to future periods’ revenue The impact on segment EBITDA of the additional incentive compensation expense related to carried interest revenue not yet recognized is reflected as follows: The company expects to recognize carried interest revenue from funds liquidating in future quarters and we believe that such carried interest revenue will more than offset the $4.8 million additional incentive compensation expense accrued in the third quarter of 2006. As of September 30, 2006, the company maintained a cumulative remaining accrual of such compensation expense of approximately $24.0 million, which pertains to anticipated future carried interest revenue Three Months Ended Sept. 30, Nine Months Ended Sept. 30, ($ in millions) 2006 2005 2006 2005 Normalized EBITDA 15.2 0.8 25.6 9.3 Add Back: Accrued incentive compensation expense related to carried interest revenue not yet recognized 4.8 10.3 20.8 20.3 Pro-forma Normalized EBITDA 20.0 11.1 46.4 29.6 |
|
Updated 2006 Full Year Guidance Excluding one-time items, the Company expects full year diluted earnings per share growth of approximately 45% as compared to 2005 performance |
|
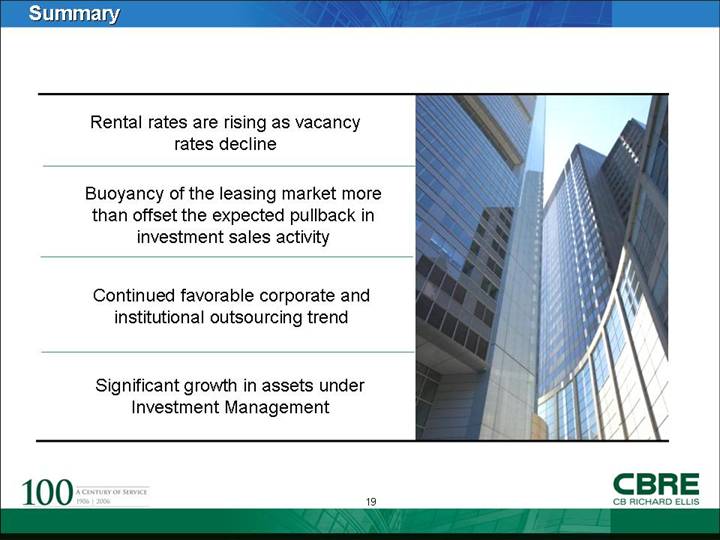
Summary Rental rates are rising as vacancy rates decline Buoyancy of the leasing market more than offset the expected pullback in investment sales activity Significant growth in assets under Investment Management Continued favorable corporate and institutional outsourcing trend |
|
Appendix |
|
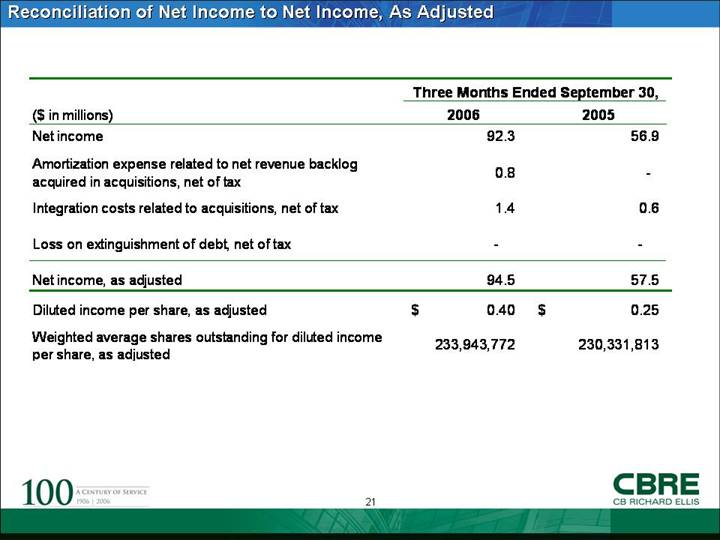
Reconciliation of Net Income to Net Income, As Adjusted ($ in millions) 2006 2005 Net income 92.3 56.9 Amortization expense related to net revenue backlog acquired in acquisitions, net of tax 0.8 - Integration costs related to acquisitions, net of tax 1.4 0.6 Loss on extinguishment of debt, net of tax - - Net income, as adjusted 94.5 57.5 Diluted income per share, as adjusted 0.40 $ 0.25 $ Weighted average shares outstanding for diluted income per share, as adjusted 233,943,772 230,331,813 Three Months Ended September 30, |
|
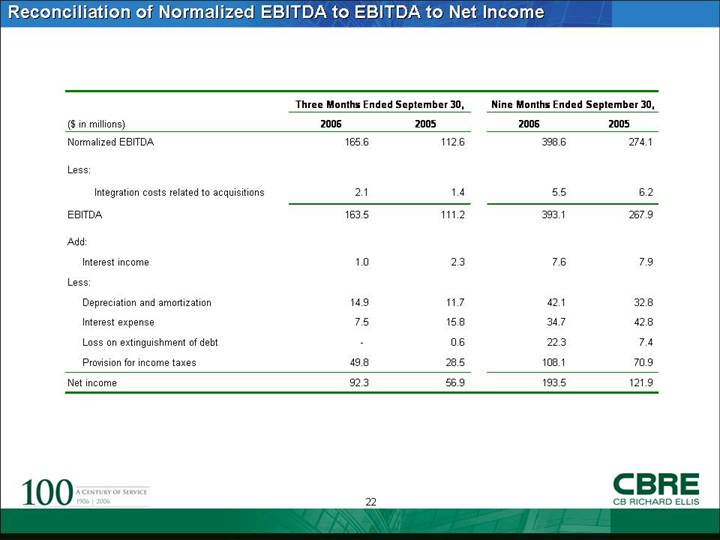
Reconciliation of Normalized EBITDA to EBITDA to Net Income Nine Months Ended September 30, ($ in millions) 2006 2005 2006 2005 Normalized EBITDA 165.6 112.6 398.6 274.1 Less: Integration costs related to acquisitions 2.1 1.4 5.5 6.2 EBITDA 163.5 111.2 393.1 267.9 Add: Interest income 1.0 2.3 7.6 7.9 Less: Depreciation and amortization 14.9 11.7 42.1 32.8 Interest expense 7.5 15.8 34.7 42.8 Loss on extinguishment of debt - 0.6 22.3 7.4 Provision for income taxes 49.8 28.5 108.1 70.9 Net income 92.3 56.9 193.5 121.9 Three Months Ended September 30, |
|
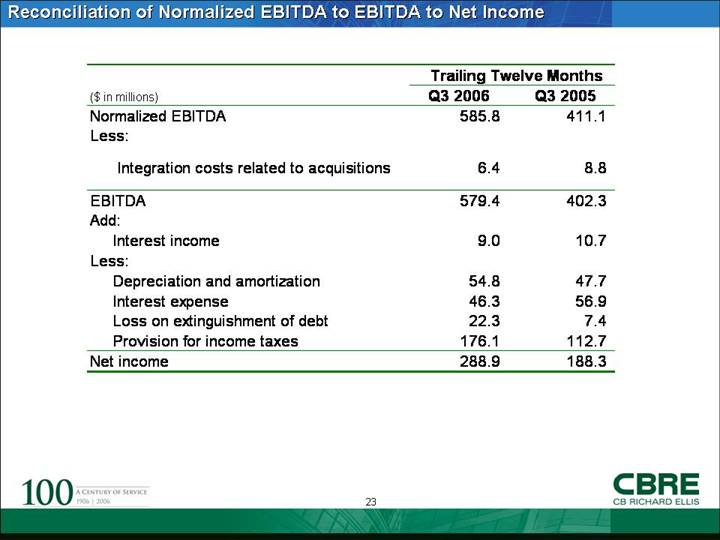
Reconciliation of Normalized EBITDA to EBITDA to Net Income Trailing Twelve Months ($ in millions) Q3 2006 Q3 2005 Normalized EBITDA 585.8 411.1 Less: Integration costs related to acquisitions 6.4 8.8 EBITDA 579.4 402.3 Add: Interest income 9.0 10.7 Less: Depreciation and amortization 54.8 47.7 Interest expense 46.3 56.9 Loss on extinguishment of debt 22.3 7.4 Provision for income taxes 176.1 112.7 Net income 288.9 188.3 |
|
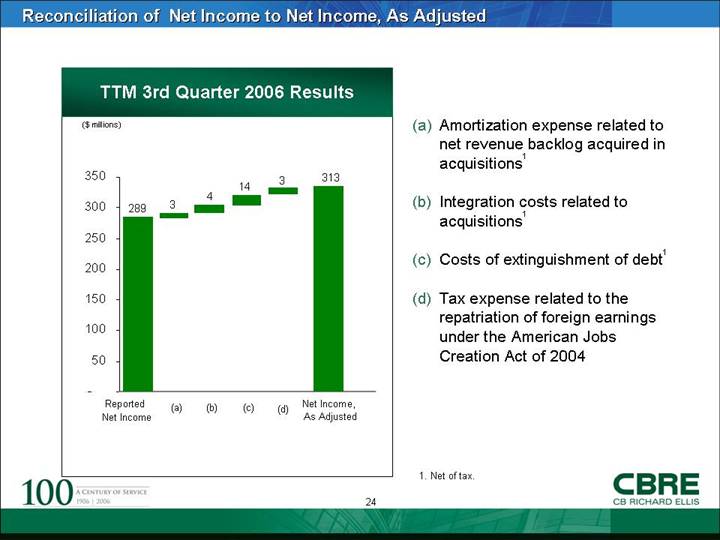
Amortization expense related to net revenue backlog acquired in acquisitions1 Integration costs related to acquisitions1 Costs of extinguishment of debt1 Tax expense related to the repatriation of foreign earnings under the American Jobs Creation Act of 2004 Reconciliation of Net Income to Net Income, As Adjusted Net Income, As Adjusted TTM 3rd Quarter 2006 Results ($ millions) 289 313 3 4 Reported Net Income (a) (b) (c) 1. Net of tax. 14 3 (d) - 50 100 150 200 250 300 350 (a) (b) (c) (d) |
|
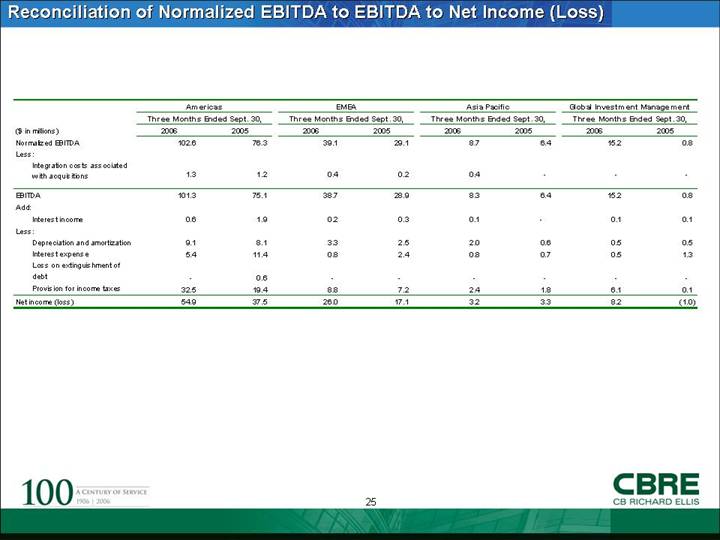
Reconciliation of Normalized EBITDA to EBITDA to Net Income (Loss) Americas EMEA Asia Pacific Global Investment Management Three Months Ended Sept. 30, Three Months Ended Sept. 30, Three Months Ended Sept. 30, Three Months Ended Sept. 30, ($ in millions) 2006 2005 2006 2005 2006 2005 2006 2005 Normalized EBITDA 102.6 76.3 39.1 29.1 8.7 6.4 15.2 0.8 Less: Integration costs associated with acquisitions 1.3 1.2 0.4 0.2 0.4 - - - EBITDA 101.3 75.1 38.7 28.9 8.3 6.4 15.2 0.8 Add: Interest income 0.6 1.9 0.2 0.3 0.1 - 0.1 0.1 Less: Depreciation and amortization 9.1 8.1 3.3 2.5 2.0 0.6 0.5 0.5 Interest expense 5.4 11.4 0.8 2.4 0.8 0.7 0.5 1.3 Loss on extinguishment of debt - 0.6 - - - - - - Provision for income taxes 32.5 19.4 8.8 7.2 2.4 1.8 6.1 0.1 Net income (loss) 54.9 37.5 26.0 17.1 3.2 3.3 8.2 (1.0) |
|
[LOGO] |