Exhibit 99.1

|
Investor Presentation August 2006 |
Exhibit 99.1
|
Investor Presentation August 2006 |
|
Forward Looking Statements This presentation contains statements that are forward looking within the meaning of the Private Securities Litigation Reform Act of 1995, including statements regarding our growth momentum in 2006, future operations and future financial performance. These statements should be considered as estimates only and actual results may ultimately differ from these estimates. Except to the extent required by applicable securities laws, we undertake no obligation to update or publicly revise any of the forward-looking statements that you may hear today. Please refer to our current annual report on Form 10-K (in particular, “Risk Factors”) and our current quarterly report on Form 10-Q which are filed with the SEC and available at the SEC’s website (http://www.sec.gov), for a full discussion of the risks and other factors that may impact any estimates that you may hear today. We may make certain statements during the course of this presentation which include references to “non-GAAP financial measures”, as defined by SEC regulations. As required by these regulations, we have provided reconciliations of these measures to what we believe are the most directly comparable GAAP measures, which are attached hereto within the appendix. |

|
Company Overview |
|
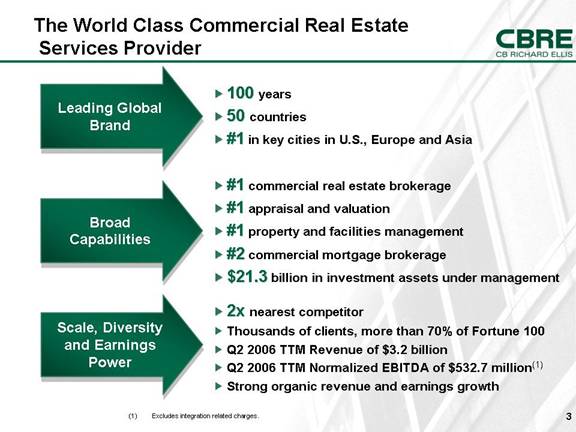
2x nearest competitor Thousands of clients, more than 70% of Fortune 100 Q2 2006 TTM Revenue of $3.2 billion Q2 2006 TTM Normalized EBITDA of $532.7 million(1) Strong organic revenue and earnings growth #1 commercial real estate brokerage #1 appraisal and valuation #1 property and facilities management #2 commercial mortgage brokerage $21.3 billion in investment assets under management Leading Global Brand Broad Capabilities Scale, Diversity and Earnings Power 100 years 50 countries #1 in key cities in U.S., Europe and Asia (1) Excludes integration related charges. The World Class Commercial Real Estate Services Provider |
|
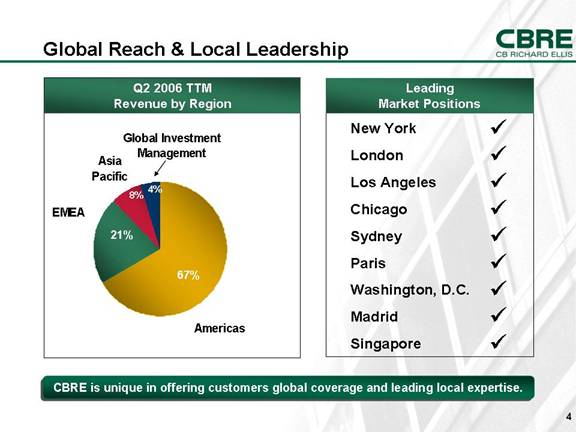
8% 4% Global Reach & Local Leadership CBRE is unique in offering customers global coverage and leading local expertise. Leading Market Positions ü ü ü ü ü ü ü ü ü Q2 2006 TTM Revenue by Region New York London Los Angeles Chicago Sydney Paris Washington, D.C. Madrid Singapore |
|
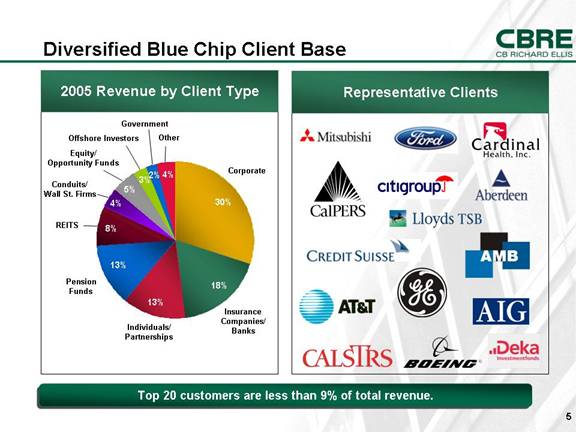
Diversified Blue Chip Client Base Individuals/ Partnerships Top 20 customers are less than 9% of total revenue. 2005 Revenue by Client Type Representative Clients Corporate REITS Insurance Companies/ Banks Pension Funds Government Other Conduits/ Wall St. Firms Equity/ Opportunity Funds Offshore Investors 4% 2% 3% 13% 8% 4% 5% 30% 18% 13% |
|
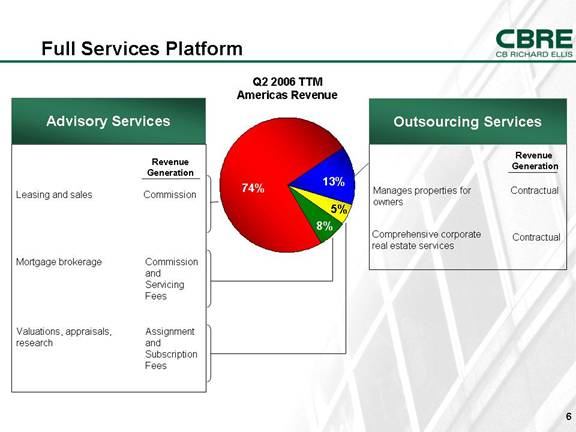
Full Services Platform Advisory Services Leasing and sales Commission Revenue Generation Mortgage brokerage Commission and Servicing Fees Valuations, appraisals, research Assignment and Subscription Fees Q2 2006 TTM Americas Revenue Outsourcing Services Manages properties for owners Contractual Revenue Generation Comprehensive corporate real estate services Contractual 74% 8% 5% 13% |
|
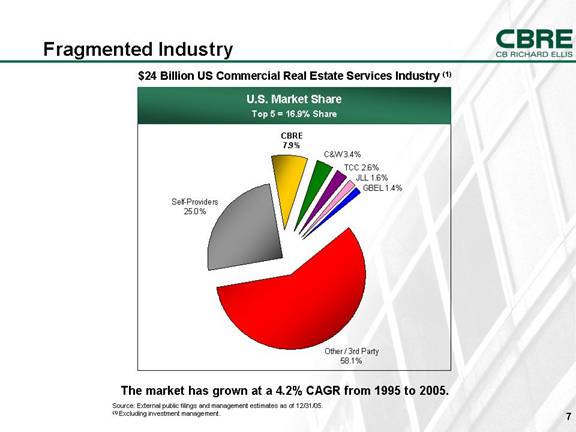
$24 Billion US Commercial Real Estate Services Industry (1) U.S. Market Share Top 5 = 16.9% Share Fragmented Industry Source: External public filings and management estimates as of 12/31/05. (1) Excluding investment management. The market has grown at a 4.2% CAGR from 1995 to 2005. |
|
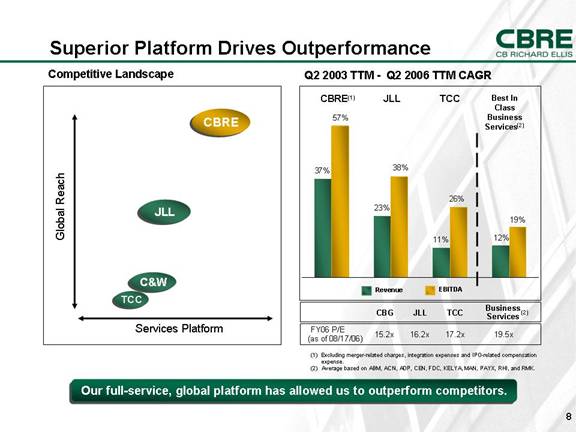
Superior Platform Drives Outperformance Our full-service, global platform has allowed us to outperform competitors. Competitive Landscape Services Platform CBRE JLL C&W TCC Global Reach Q2 2003 TTM - Q2 2006 TTM CAGR (1) Excluding merger-related charges, integration expenses and IPO-related compensation expense. (2) Average based on ABM, ACN, ADP, CEN, FDC, KELYA, MAN, PAYX, RHI, and RMK. TCC JLL CBRE(1) Revenue EBITDA Best In Class Business Services(2) CBG JLL TCC Business Services (2) FY06 P/E (as of 08/17/06) 15.2x 16.2x 17.2x 19.5x 37% 23% 11% 12% 57% 19% 26% 38% |

|
Industry / Company Trends |
|
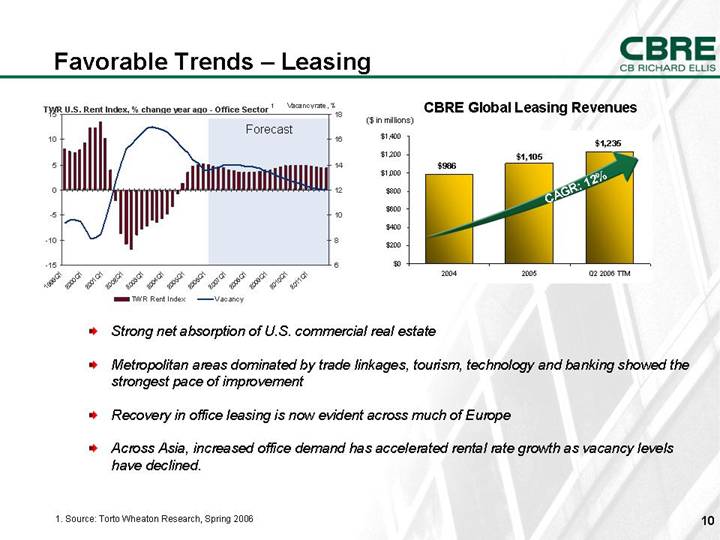
Strong net absorption of U.S. commercial real estate Metropolitan areas dominated by trade linkages, tourism, technology and banking showed the strongest pace of improvement Recovery in office leasing is now evident across much of Europe Across Asia, increased office demand has accelerated rental rate growth as vacancy levels have declined. 1. Source: Torto Wheaton Research, Spring 2006 Favorable Trends – Leasing Forecast CAGR: 12% CBRE Global Leasing Revenues ($ in millions) $1,105 $1,235 $986 $0 $200 $400 $600 $800 $1,000 $1,200 $1,400 2004 2005 Q2 2006 TTM -15 -10 -5 0 5 10 15 1999Q1 2000Q1 2001Q1 2002Q1 2003Q1 2004Q1 2005Q1 2006Q1 2007Q1 2008Q1 2009Q1 2010Q1 2011Q1 6 8 10 12 14 16 18 TWR Rent Index Vacancy TWR U.S. Rent Index, % change year ago - Office Sector 1 Vacancy rate, % |
|
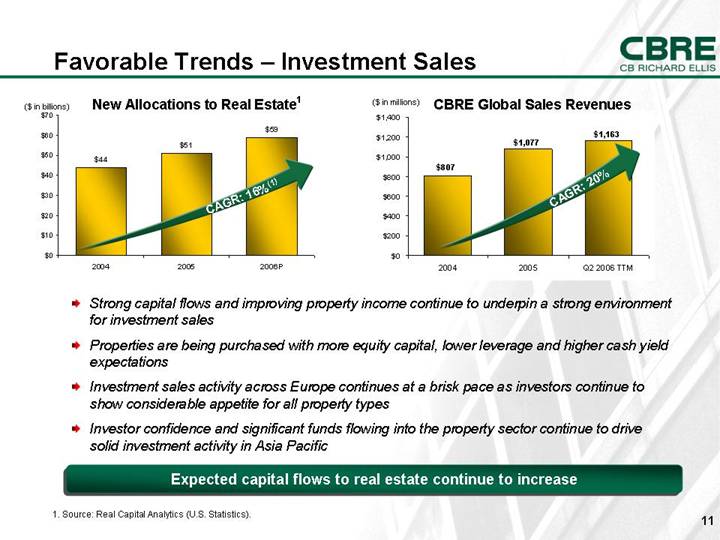
($ in billions) Favorable Trends – Investment Sales Strong capital flows and improving property income continue to underpin a strong environment for investment sales Properties are being purchased with more equity capital, lower leverage and higher cash yield expectations Investment sales activity across Europe continues at a brisk pace as investors continue to show considerable appetite for all property types Investor confidence and significant funds flowing into the property sector continue to drive solid investment activity in Asia Pacific 1. Source: Real Capital Analytics (U.S. Statistics). CAGR: 16%(1) Expected capital flows to real estate continue to increase CAGR: 20% ($ in millions) CBRE Global Sales Revenues New Allocations to Real Estate1 $44 $51 $59 $0 $10 $20 $30 $40 $50 $60 $70 2004 2005 2006P $1,077 $1,163 $807 $0 $200 $400 $600 $800 $1,000 $1,200 $1,400 2004 2005 Q2 2006 TTM |
|
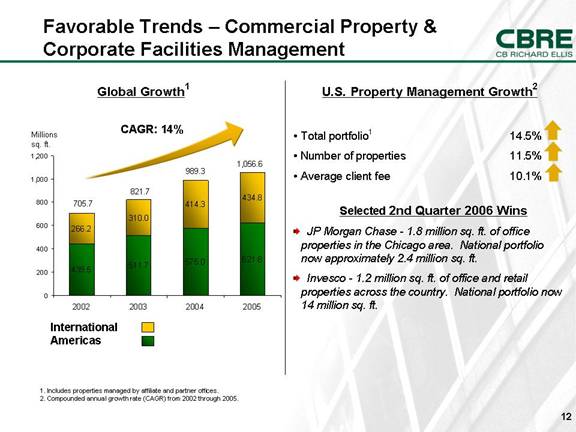
Favorable Trends – Commercial Property & Corporate Facilities Management U.S. Property Management Growth2 Total portfolio1 14.5% Number of properties 11.5% Average client fee 10.1% Selected 2nd Quarter 2006 Wins JP Morgan Chase - 1.8 million sq. ft. of office properties in the Chicago area. National portfolio now approximately 2.4 million sq. ft. Invesco - 1.2 million sq. ft. of office and retail properties across the country. National portfolio now 14 million sq. ft. Global Growth1 CAGR: 14% 1. Includes properties managed by affiliate and partner offices. 2. Compounded annual growth rate (CAGR) from 2002 through 2005. International Americas 705.7 821.7 989.3 1,056.6 Millions sq. ft. 439.5 575.0 310.0 414.3 434.8 511.7 621.8 266.2 0 200 400 600 800 1,000 1,200 2002 2003 2004 2005 |
|
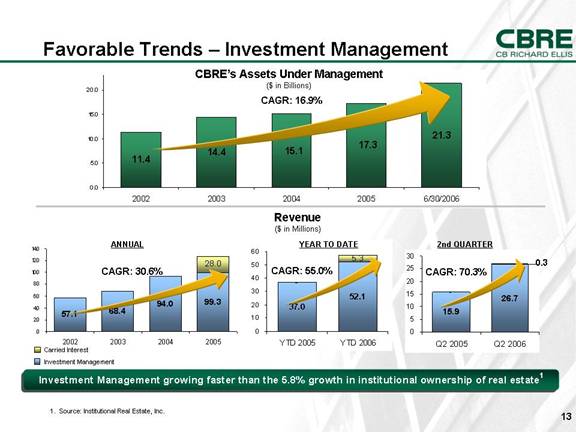
CAGR: 16.9% Favorable Trends – Investment Management Investment Management growing faster than the 5.8% growth in institutional ownership of real estate1 CBRE’s Assets Under Management ($ in Billions) Revenue ($ in Millions) CAGR: 30.6% CAGR: 70.3% CAGR: 55.0% ANNUAL YEAR TO DATE 2nd QUARTER Carried Interest Investment Management 1. Source: Institutional Real Estate, Inc. 0.3 - 52.1 37.0 5.3 0 10 20 30 40 50 60 YTD 2005 YTD 2006 - - - 57.1 68.4 94.0 99.3 28.0 0 20 40 60 80 100 120 140 2002 2003 2004 2005 - 15.9 26.7 0 5 10 15 20 25 30 Q2 2005 Q2 2006 17.3 15.1 11.4 14.4 21.3 0.0 5.0 10.0 15.0 20.0 2002 2003 2004 2005 6/30/2006 |

|
Key Growth Strategies |
|
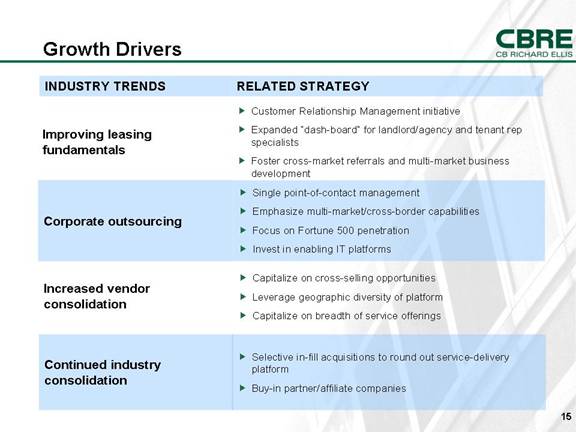
INDUSTRY TRENDS RELATED STRATEGY Customer Relationship Management initiative Expanded “dash-board” for landlord/agency and tenant rep specialists Foster cross-market referrals and multi-market business development Improving leasing fundamentals Growth Drivers Corporate outsourcing Capitalize on cross-selling opportunities Leverage geographic diversity of platform Capitalize on breadth of service offerings Increased vendor consolidation Single point-of-contact management Emphasize multi-market/cross-border capabilities Focus on Fortune 500 penetration Invest in enabling IT platforms Continued industry consolidation Selective in-fill acquisitions to round out service-delivery platform Buy-in partner/affiliate companies |
|
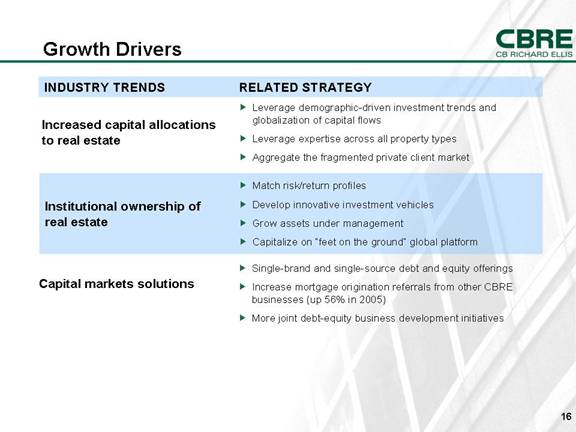
INDUSTRY TRENDS RELATED STRATEGY Match risk/return profiles Develop innovative investment vehicles Grow assets under management Capitalize on “feet on the ground” global platform Institutional ownership of real estate Growth Drivers Increased capital allocations to real estate Leverage demographic-driven investment trends and globalization of capital flows Leverage expertise across all property types Aggregate the fragmented private client market Capital markets solutions Single-brand and single-source debt and equity offerings Increase mortgage origination referrals from other CBRE businesses (up 56% in 2005) More joint debt-equity business development initiatives |
|
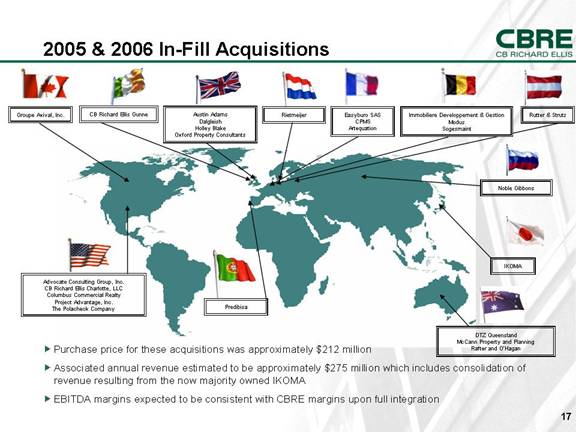
2005 & 2006 In-Fill Acquisitions Easyburo SAS CPMS Artequation DTZ Queensland McCann Property and Planning Rafter and O’Hagan Advocate Consulting Group, Inc. CB Richard Ellis Charlotte, LLC Columbus Commercial Realty Project Advantage, Inc. The Polacheck Company Rutter & Strutz Groupe Axival, Inc. Noble Gibbons IKOMA Purchase price for these acquisitions was approximately $212 million Associated annual revenue estimated to be approximately $275 million which includes consolidation of revenue resulting from the now majority owned IKOMA EBITDA margins expected to be consistent with CBRE margins upon full integration CB Richard Ellis Gunne Immobiliere Developpement & Gestion Modus Sogesmaint Rietmeijer Austin Adams Dalgleish Holley Blake Oxford Property Consultants Predibisa |
|
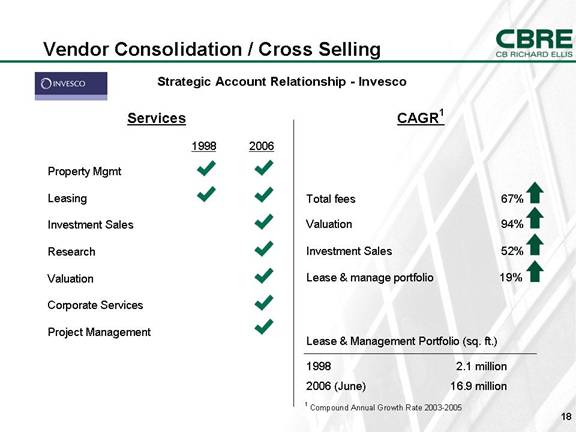
Vendor Consolidation / Cross Selling Services CAGR1 1998 2006 Property Mgmt Leasing Investment Sales Research Valuation Corporate Services Project Management Total fees 67% Valuation 94% Investment Sales 52% Lease & manage portfolio 19% 1 Compound Annual Growth Rate 2003-2005 Lease & Management Portfolio (sq. ft.) 1998 2.1 million 2006 (June) 16.9 million Strategic Account Relationship - Invesco |
|
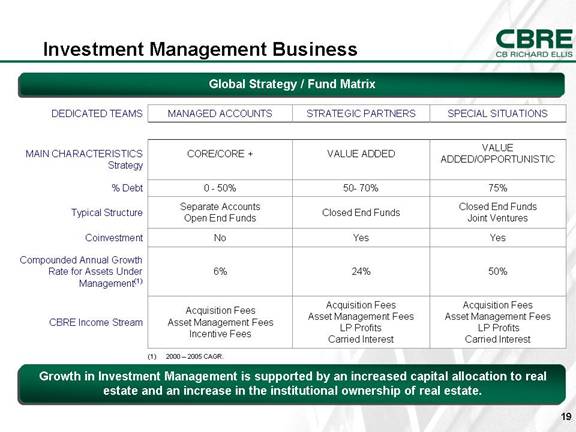
Investment Management Business Global Strategy / Fund Matrix 50% 24% 6% Compounded Annual Growth Rate for Assets Under Management(1) Yes Yes No Coinvestment Acquisition Fees Asset Management Fees LP Profits Carried Interest Acquisition Fees Asset Management Fees LP Profits Carried Interest Acquisition Fees Asset Management Fees Incentive Fees CBRE Income Stream Closed End Funds Joint Ventures Closed End Funds Separate Accounts Open End Funds Typical Structure 75% 50- 70% 0 - 50% % Debt VALUE ADDED/OPPORTUNISTIC VALUE ADDED CORE/CORE + MAIN CHARACTERISTICS Strategy SPECIAL SITUATIONS STRATEGIC PARTNERS MANAGED ACCOUNTS DEDICATED TEAMS (1) 2000 – 2005 CAGR. Growth in Investment Management is supported by an increased capital allocation to real estate and an increase in the institutional ownership of real estate. |

|
Financial Overview |
|
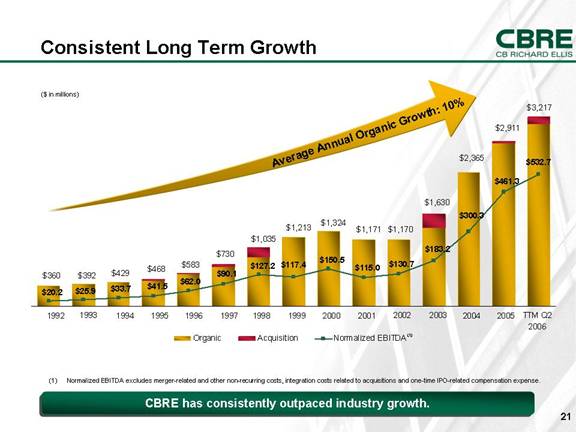
Consistent Long Term Growth CBRE has consistently outpaced industry growth. (1) Normalized EBITDA excludes merger-related and other non-recurring costs, integration costs related to acquisitions and one-time IPO-related compensation expense. ($ in millions) Average Annual Organic Growth: 10% (1) $117.4 $532.7 $183.2 $62.0 $41.5 $33.7 $25.9 $20.2 $127.2 $150.5 $115.0 $130.7 $300.3 $461.3 $90.1 Organic Acquisition Normalized EBITDA 1992 1993 1994 1995 1996 1997 1998 1999 2000 2001 2002 2003 TTM Q2 2006 $360 $429 $468 $583 $730 $1,035 $1,213 $1,324 $1,171 $1,170 $1,630 $2,365 $392 2004 $2,911 $3,217 2005 |
|
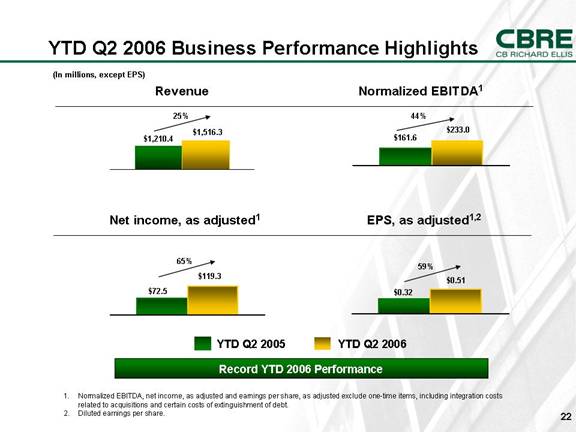
YTD Q2 2006 Business Performance Highlights YTD Q2 2005 Record YTD 2006 Performance YTD Q2 2006 $1,516.3 $1,210.4 25% (In millions, except EPS) $161.6 $233.0 44% Revenue Normalized EBITDA1 $72.5 $119.3 65% $0.32 $0.51 59% Net income, as adjusted1 EPS, as adjusted1,2 1. Normalized EBITDA, net income, as adjusted and earnings per share, as adjusted exclude one-time items, including integration costs related to acquisitions and certain costs of extinguishment of debt. 2. Diluted earnings per share. |
|
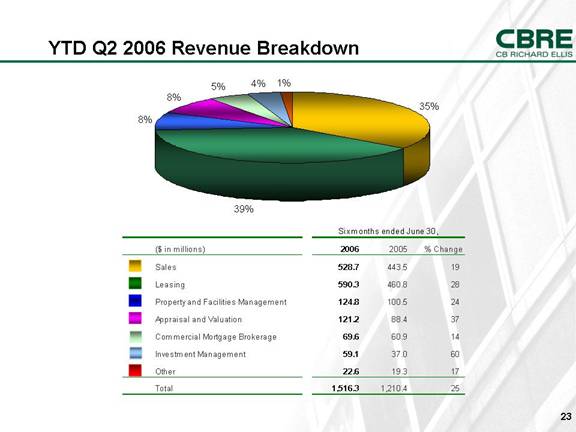
YTD Q2 2006 Revenue Breakdown 35% 39% 8% 8% 5% 4% 1% ($ in millions) 2006 2005 % Change Sales 528.7 443.5 19 Leasing 590.3 460.8 28 Property and Facilities Management 124.8 100.5 24 Appraisal and Valuation 121.2 88.4 37 Commercial Mortgage Brokerage 69.6 60.9 14 Investment Management 59.1 37.0 60 Other 22.6 19.3 17 Total 1,516.3 1,210.4 25 Six months ended June 30, |
|
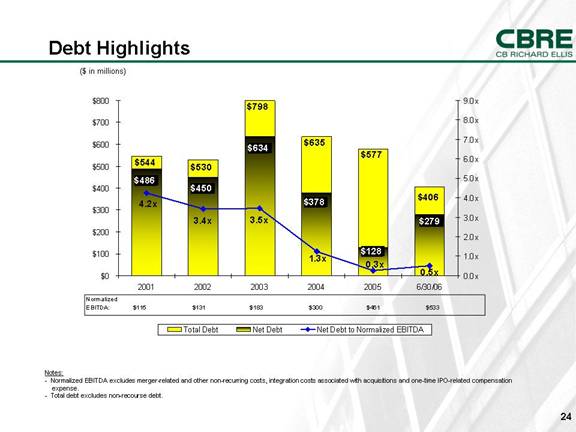
($ in millions) Debt Highlights Notes: - Normalized EBITDA excludes merger-related and other non-recurring costs, integration costs associated with acquisitions and one-time IPO-related compensation expense. - Total debt excludes non-recourse debt. $544 $530 $798 $635 $577 $406 $486 $450 $634 $378 $128 $279 3.4x 3.5x 0.3x 4.2x 1.3x 0.5x $0 $100 $200 $300 $400 $500 $600 $700 $800 2001 2002 2003 2004 2005 6/30/06 0.0x 1.0x 2.0x 3.0x 4.0x 5.0x 6.0x 7.0x 8.0x 9.0x Total Debt Net Debt Net Debt to Normalized EBITDA Normalized EBITDA: $115 $131 $183 $300 $461 $533 |
|
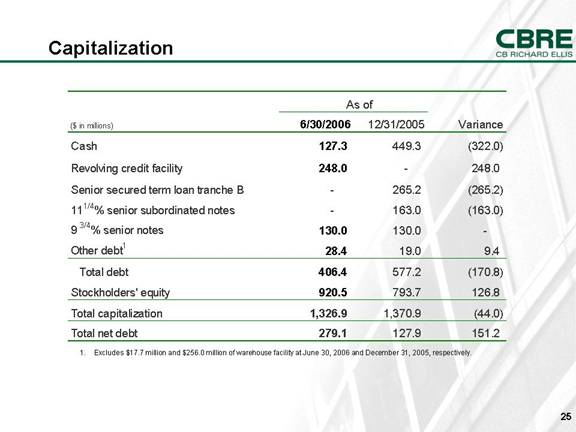
Excludes $17.7 million and $256.0 million of warehouse facility at June 30, 2006 and December 31, 2005, respectively. Capitalization ($ in millions) 6/30/2006 12/31/2005 Variance Cash 127.3 449.3 (322.0) 2.0 (2.0) Revolving credit facility 248.0 - 248.0 Senior secured term loan tranche B - 265.2 (265.2) 11 1/4 % senior subordinated notes - 163.0 (163.0) 9 3/4 % senior notes 130.0 130.0 - Other debt 1 28.4 19.0 9.4 Total debt 406.4 577.2 (170.8) Stockholders' equity 920.5 793.7 126.8 Total capitalization 1,326.9 1,370.9 (44.0) Total net debt 279.1 127.9 151.2 As of |
|
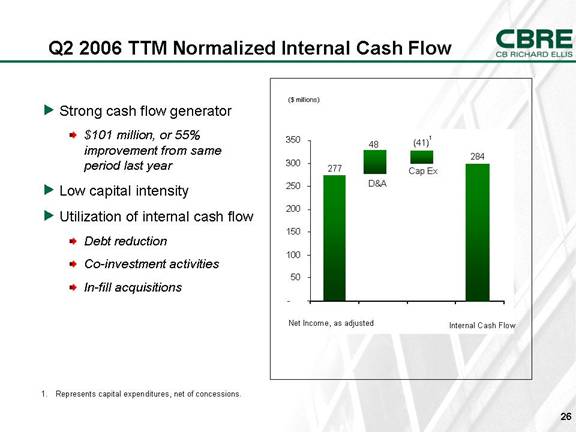
Q2 2006 TTM Normalized Internal Cash Flow ($ millions) 48 277 Net Income, as adjusted D&A Cap Ex (41) 284 Represents capital expenditures, net of concessions. Internal Cash Flow 1 Strong cash flow generator $101 million, or 55% improvement from same period last year Low capital intensity Utilization of internal cash flow Debt reduction Co-investment activities In-fill acquisitions - 50 100 150 200 250 300 350 |
|
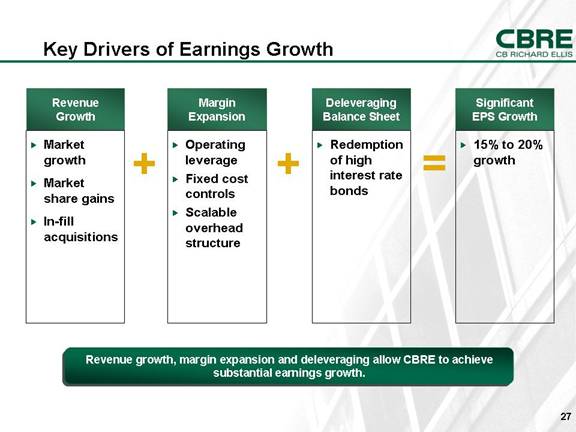
Key Drivers of Earnings Growth Revenue Growth Margin Expansion Market growth Market share gains In-fill acquisitions Operating leverage Fixed cost controls Scalable overhead structure Deleveraging Balance Sheet Redemption of high interest rate bonds Revenue growth, margin expansion and deleveraging allow CBRE to achieve substantial earnings growth. = + + Significant EPS Growth 15% to 20% growth |
|
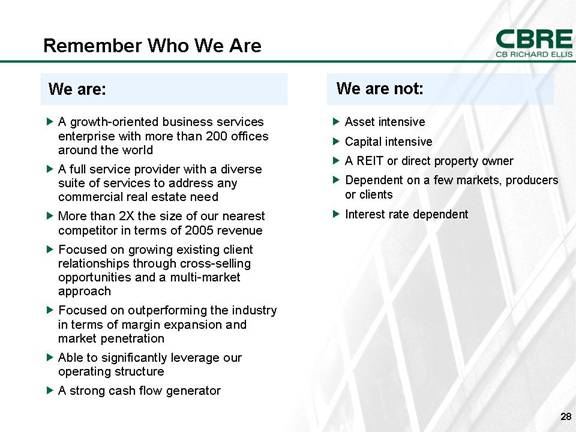
Remember Who We Are A growth-oriented business services enterprise with more than 200 offices around the world A full service provider with a diverse suite of services to address any commercial real estate need More than 2X the size of our nearest competitor in terms of 2005 revenue Focused on growing existing client relationships through cross-selling opportunities and a multi-market approach Focused on outperforming the industry in terms of margin expansion and market penetration Able to significantly leverage our operating structure A strong cash flow generator Asset intensive Capital intensive A REIT or direct property owner Dependent on a few markets, producers or clients Interest rate dependent We are: We are not: |

|
Appendix |
|
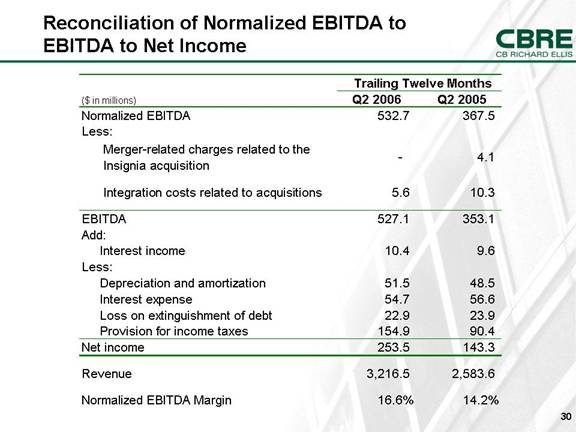
Reconciliation of Normalized EBITDA to EBITDA to Net Income Trailing Twelve Months ($ in millions) Q2 2006 Q2 2005 Normalized EBITDA 532.7 367.5 Less: Merger-related charges related to the Insignia acquisition - 4.1 Integration costs related to acquisitions 5.6 10.3 EBITDA 527.1 353.1 Add: Interest income 10.4 9.6 Less: Depreciation and amortization 51.5 48.5 Interest expense 54.7 56.6 Loss on extinguishment of debt 22.9 23.9 Provision for income taxes 154.9 90.4 Net income 253.5 143.3 Revenue 3,216.5 2,583.6 Normalized EBITDA Margin 16.6% 14.2% |
|
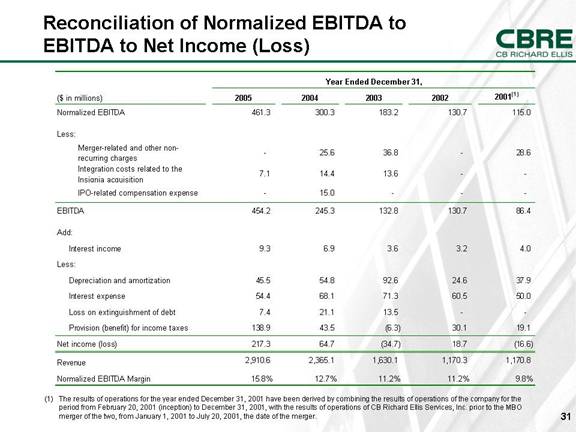
Reconciliation of Normalized EBITDA to EBITDA to Net Income (Loss) (1) The results of operations for the year ended December 31, 2001 have been derived by combining the results of operations of the company for the period from February 20, 2001 (inception) to December 31, 2001, with the results of operations of CB Richard Ellis Services, Inc. prior to the MBO merger of the two, from January 1, 2001 to July 20, 2001, the date of the merger. Year Ended December 31, ($ in millions) 2005 2004 2003 2002 2001 (1) Normalized EBITDA 461.3 300.3 183.2 130.7 115.0 Less: Merger-related and other non- recurring charges - 25.6 36.8 - 28.6 Integration costs related to the Insignia acquisition 7.1 14.4 13.6 - - IPO-related compensation expense - 15.0 - - - EBITDA 454.2 245.3 132.8 130.7 86.4 Add: Interest income 9.3 6.9 3.6 3.2 4.0 Less: Depreciation and amortization 45.5 54.8 92.6 24.6 37.9 Interest expense 54.4 68.1 71.3 60.5 50.0 Loss on extinguishment of debt 7.4 21.1 13.5 - - Provision (benefit) for income taxes 138.9 43.5 (6.3) 30.1 19.1 Net income (loss) 217.3 64.7 (34.7) 18.7 (16.6) Revenue 2,910.6 2,365.1 1,630.1 1,170.3 1,170.8 Normalized EBITDA Margin 15.8% 12.7% 11.2% 11.2% 9.8% |
|
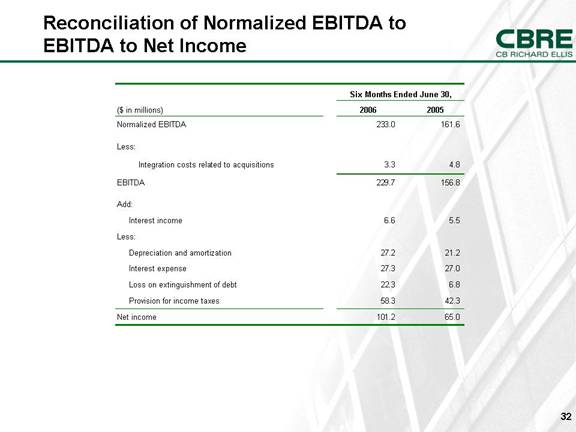
Reconciliation of Normalized EBITDA to EBITDA to Net Income Six Months Ended June 30, ($ in millions) 2006 2005 Normalized EBITDA 233.0 161.6 Less: Integration costs related to acquisitions 3.3 4.8 EBITDA 229.7 156.8 Add: Interest income 6.6 5.5 Less: Depreciation and amortization 27.2 21.2 Interest expense 27.3 27.0 Loss on extinguishment of debt 22.3 6.8 Provision for income taxes 58.3 42.3 Net income 101.2 65.0 |
|
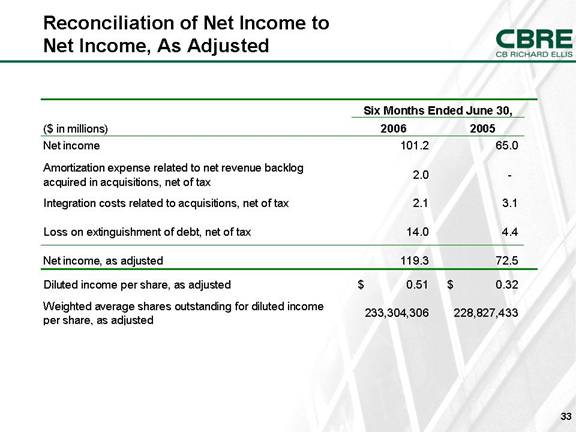
Reconciliation of Net Income to Net Income, As Adjusted ($ in millions) 2006 2005 Net income 101.2 65.0 Amortization expense related to net revenue backlog acquired in acquisitions, net of tax 2.0 - Integration costs related to acquisitions, net of tax 2.1 3.1 Loss on extinguishment of debt, net of tax 14.0 4.4 Net income, as adjusted 119.3 72.5 Diluted income per share, as adjusted 0.51 $ 0.32 $ Weighted average shares outstanding for diluted income per share, as adjusted 233,304,306 228,827,433 Six Months Ended June 30, |
|
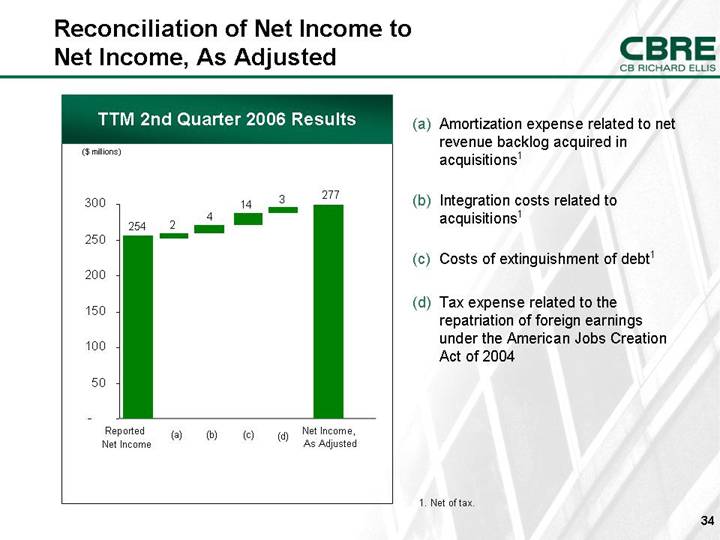
Reconciliation of Net Income to Net Income, As Adjusted Net Income, As Adjusted TTM 2nd Quarter 2006 Results ($ millions) 254 277 2 4 Reported Net Income (a) (b) (c) 1. Net of tax. 14 3 (d) (a) Amortization expense related to net revenue backlog acquired in acquisitions1 (b) Integration costs related to acquisitions1 (c) Costs of extinguishment of debt1 (d) Tax expense related to the repatriation of foreign earnings under the American Jobs Creation Act of 2004 - 50 100 150 200 250 300 |

|
[LOGO] |