Exhibit 99.2
Link to searchable text of slide shown above
Searchable text section of graphics shown above
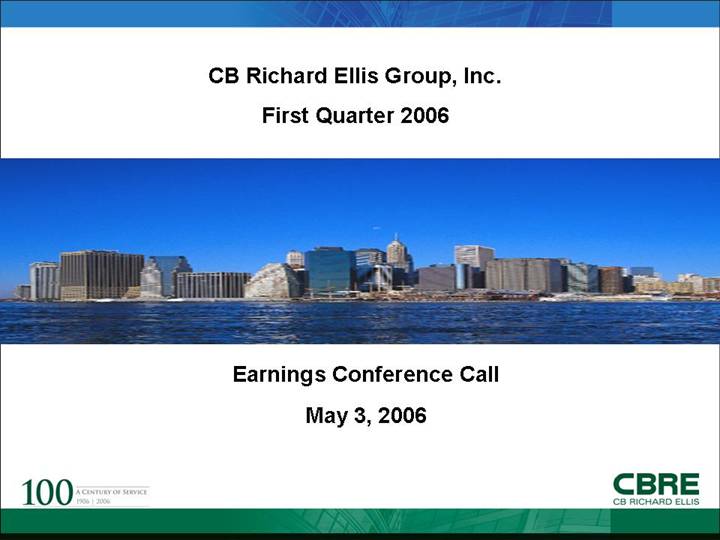
CB Richard Ellis Group, Inc.
First Quarter 2006
[GRAPHIC]
Earnings Conference Call
May 3, 2006
|
[LOGO] |
|
[LOGO] |
Forward Looking Statements
This presentation contains statements that are forward looking within the meaning of the Private Securities Litigation Reform Act of 1995, including statements regarding our growth momentum in 2006, future operations and future financial performance. These statements should be considered as estimates only and actual results may ultimately differ from these estimates. Except to the extent required by applicable securities laws, we undertake no obligation to update or publicly revise any of the forward-looking statements that you may hear today. Please refer to our current annual report on Form 10-K (in particular, “Item 1-A, Risk Factors”) which is filed with the SEC and available at the SEC’s website (http://www.sec.gov), for a full discussion of the risks and other factors, that may impact any estimates that you may hear today. We may make certain statements during the course of this presentation which include references to “non-GAAP financial measures,” as defined by SEC regulations. As required by these regulations, we have provided reconciliations of these measures to what we believe are the most directly comparable GAAP measures, which are attached hereto within the appendix.
1
Conference Call Participants
• Brett White
• President & Chief Executive Officer
• Ken Kay
• Senior Executive Vice President & Chief Financial Officer
• Brian Stoffers
• President, Capital Markets
• Shelley Young
• Director, Investor Relations
2
Q1 2006 Summary
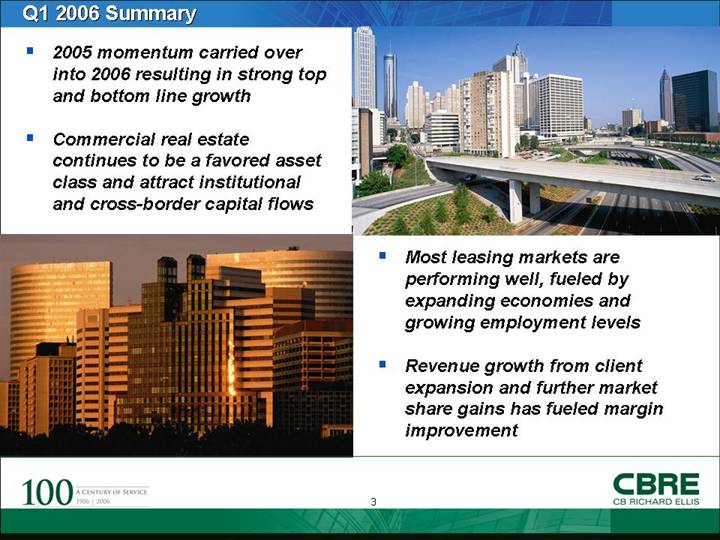
• 2005 momentum carried over into 2006 resulting in strong top and bottom line growth
• Commercial real estate continues to be a favored asset class and attract institutional and cross-border capital flows
[GRAPHIC]
[GRAPHIC]
• Most leasing markets are performing well, fueled by expanding economies and growing employment levels
• Revenue growth from client expansion and further market share gains has fueled margin improvement
3
Q1 2006 Performance Highlights
|
Revenue |
|
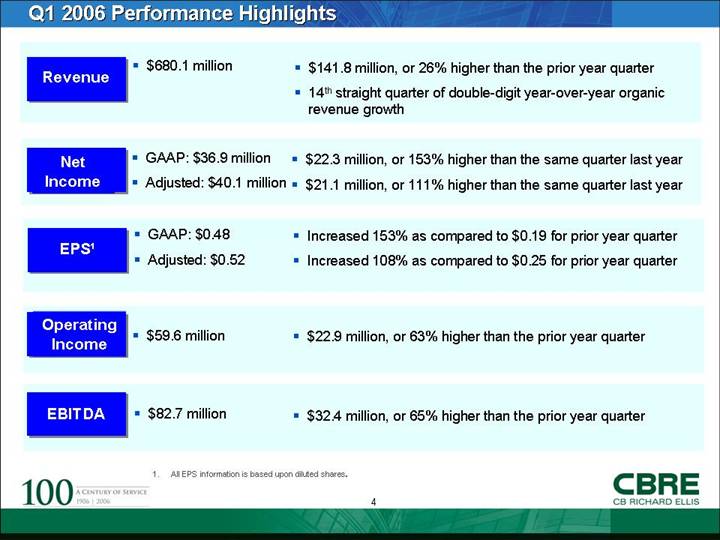
• $680.1 million |
|
• $141.8 million, or 26% higher than the prior year quarter |
|
|
|
|
|
• 14th straight quarter of double-digit year-over-year organic revenue growth |
|
|
|
|
|
|
|
Net Income |
|
• GAAP: $36.9 million |
|
• $22.3 million, or 153% higher than the same quarter last year |
|
|
|
• Adjusted: $40.1 million |
|
• $21.1 million, or 111% higher than the same quarter last year |
|
|
|
|
|
|
|
EPS(1) |
|
• GAAP: $0.48 |
|
• Increased 153% as compared to $0.19 for prior year quarter |
|
|
|
• Adjusted: $0.52 |
|
• Increased 108% as compared to $0.25 for prior year quarter |
|
|
|
|
|
|
|
Operating Income |
|
• $59.6 million |
|
• $22.9 million, or 63% higher than the prior year quarter |
|
|
|
|
|
|
|
EBITDA |
|
• $82.7 million |
|
• $32.4 million, or 65% higher than the prior year quarter |
(1). All EPS information is based upon diluted shares.
4
Q1 2006 Financial Results
|
($ in millions) |
|
2006 |
|
2005 |
|
% Change |
|
|
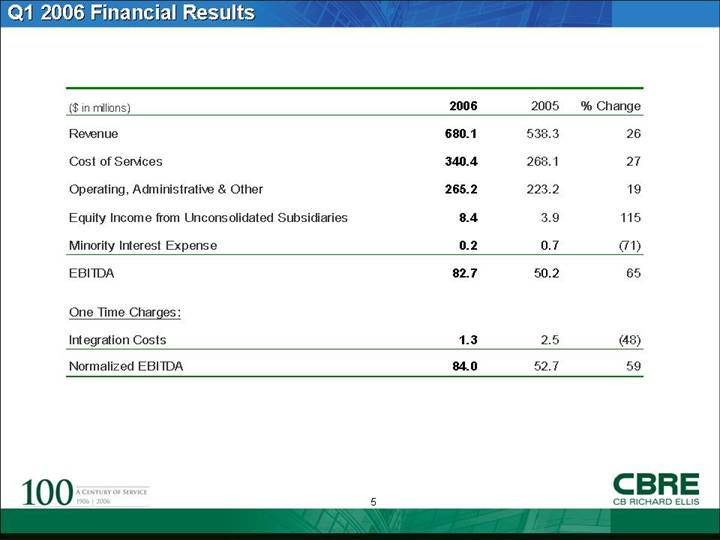
Revenue |
|
680.1 |
|
538.3 |
|
26 |
|
|
Cost of Services |
|
340.4 |
|
268.1 |
|
27 |
|
|
Operating, Administrative & Other |
|
265.2 |
|
223.2 |
|
19 |
|
|
Equity Income from Unconsolidated Subsidiaries |
|
8.4 |
|
3.9 |
|
115 |
|
|
Minority Interest Expense |
|
0.2 |
|
0.7 |
|
(71 |
) |
|
EBITDA |
|
82.7 |
|
50.2 |
|
65 |
|
|
|
|
|
|
|
|
|
|
|
One Time Charges: |
|
|
|
|
|
|
|
|
Integration Costs |
|
1.3 |
|
2.5 |
|
(48 |
) |
|
Normalized EBITDA |
|
84.0 |
|
52.7 |
|
59 |
|
5
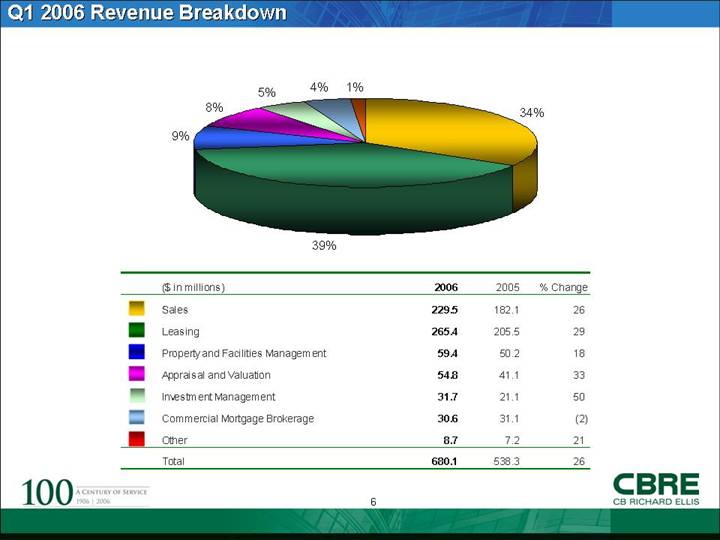
Q1 2006 Revenue Breakdown
[CHART]
|
($ in millions) |
|
2006 |
|
2005 |
|
% Change |
|
|
Sales |
|
229.5 |
|
182.1 |
|
26 |
|
|
Leasing |
|
265.4 |
|
205.5 |
|
29 |
|
|
Property and Facilities Management |
|
59.4 |
|
50.2 |
|
18 |
|
|
Appraisal and Valuation |
|
54.8 |
|
41.1 |
|
33 |
|
|
Investment Management |
|
31.7 |
|
21.1 |
|
50 |
|
|
Commercial Mortgage Brokerage |
|
30.6 |
|
31.1 |
|
(2 |
) |
|
Other |
|
8.7 |
|
7.2 |
|
21 |
|
|
Total |
|
680.1 |
|
538.3 |
|
26 |
|
6
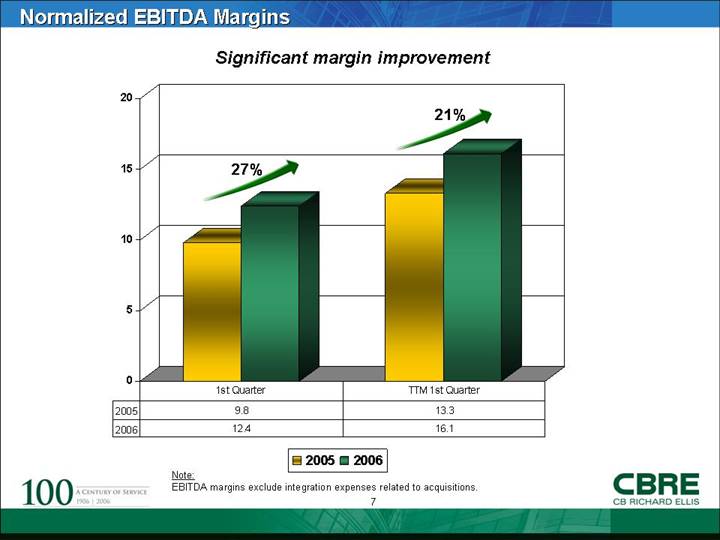
Normalized EBITDA Margins
Significant margin improvement
[CHART]
Note:
EBITDA margins exclude integration expenses related to acquisitions.
7
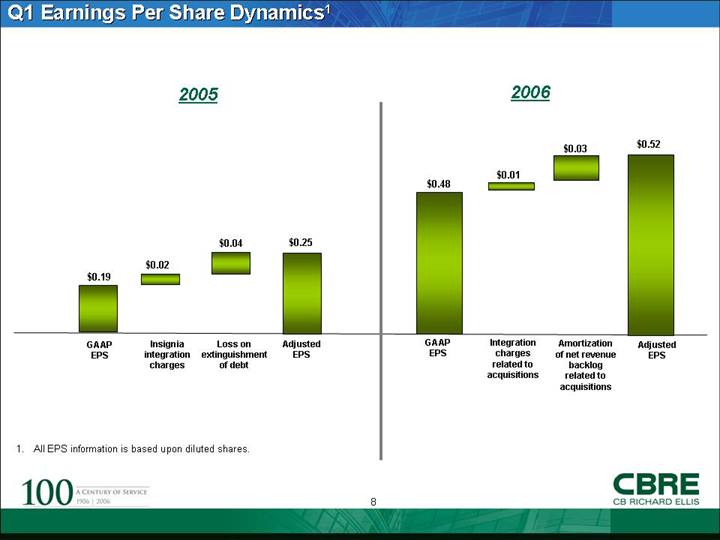
Q1 Earnings Per Share Dynamics(1)
|
2005 |
|
2006 |
|
|
|
|
|
[CHART] |
|
[CHART] |
(1). All EPS information is based upon diluted shares.
8
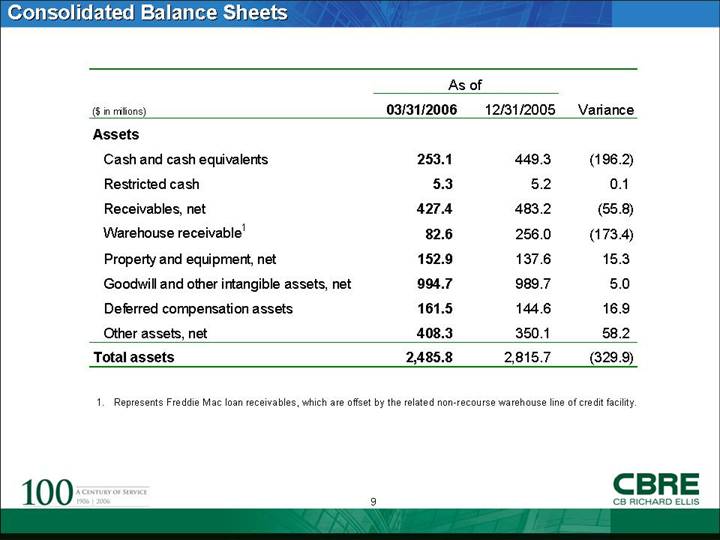
Consolidated Balance Sheets
|
|
|
As of |
|
|
|
||
|
($ in millions) |
|
03/31/2006 |
|
12/31/2005 |
|
Variance |
|
|
Assets |
|
|
|
|
|
|
|
|
Cash and cash equivalents |
|
253.1 |
|
449.3 |
|
(196.2 |
) |
|
Restricted cash |
|
5.3 |
|
5.2 |
|
0.1 |
|
|
Receivables, net |
|
427.4 |
|
483.2 |
|
(55.8 |
) |
|
Warehouse receivable(1) |
|
82.6 |
|
256.0 |
|
(173.4 |
) |
|
Property and equipment, net |
|
152.9 |
|
137.6 |
|
15.3 |
|
|
Goodwill and other intangible assets, net |
|
994.7 |
|
989.7 |
|
5.0 |
|
|
Deferred compensation assets |
|
161.5 |
|
144.6 |
|
16.9 |
|
|
Other assets, net |
|
408.3 |
|
350.1 |
|
58.2 |
|
|
Total assets |
|
2,485.8 |
|
2,815.7 |
|
(329.9 |
) |
(1). Represents Freddie Mac loan receivables, which are offset by the related non-recourse warehouse line of credit facility.
9
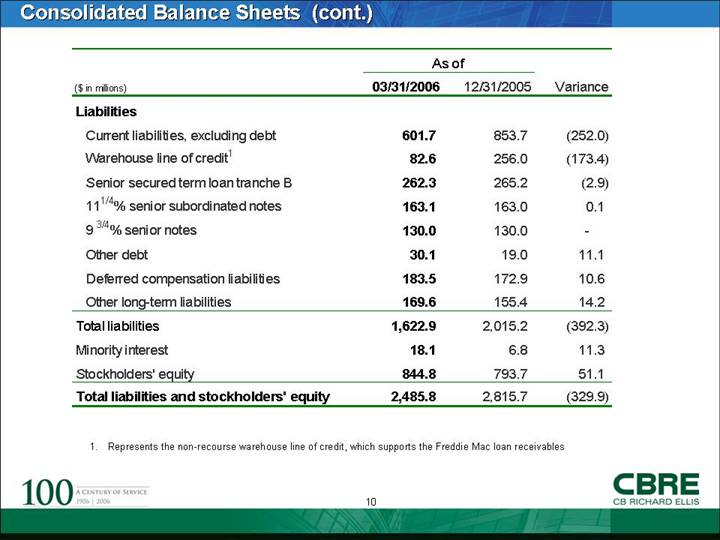
Consolidated Balance Sheets (cont.)
|
|
|
As of |
|
|
|
||
|
($ in millions) |
|
03/31/2006 |
|
12/31/2005 |
|
Variance |
|
|
Liabilities |
|
|
|
|
|
|
|
|
Current liabilities, excluding debt |
|
601.7 |
|
853.7 |
|
(252.0 |
) |
|
Warehouse line of credit(1) |
|
82.6 |
|
256.0 |
|
(173.4 |
) |
|
Senior secured term loan tranche B |
|
262.3 |
|
265.2 |
|
(2.9 |
) |
|
111/4% senior subordinated notes |
|
163.1 |
|
163.0 |
|
0.1 |
|
|
9 3/4% senior notes |
|
130.0 |
|
130.0 |
|
— |
|
|
Other debt |
|
30.1 |
|
19.0 |
|
11.1 |
|
|
Deferred compensation liabilities |
|
183.5 |
|
172.9 |
|
10.6 |
|
|
Other long-term liabilities |
|
169.6 |
|
155.4 |
|
14.2 |
|
|
Total liabilities |
|
1,622.9 |
|
2,015.2 |
|
(392.3 |
) |
|
Minority interest |
|
18.1 |
|
6.8 |
|
11.3 |
|
|
Stockholders’ equity |
|
844.8 |
|
793.7 |
|
51.1 |
|
|
Total liabilities and stockholders’ equity |
|
2,485.8 |
|
2,815.7 |
|
(329.9 |
) |
(1). Represents the non-recourse warehouse line of credit, which supports the Freddie Mac loan receivables
10
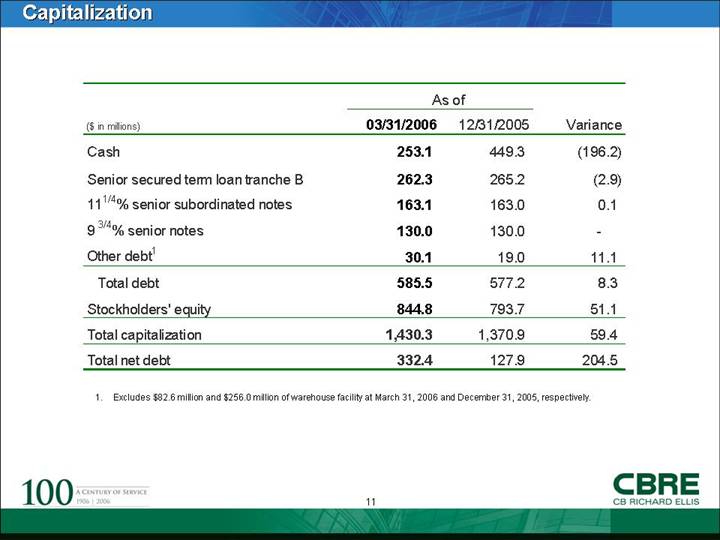
Capitalization
|
|
|
As of |
|
|
|
||
|
($ in millions) |
|
03/31/2006 |
|
12/31/2005 |
|
Variance |
|
|
Cash |
|
253.1 |
|
449.3 |
|
(196.2 |
) |
|
Senior secured term loan tranche B |
|
262.3 |
|
265.2 |
|
(2.9 |
) |
|
111/4% senior subordinated notes |
|
163.1 |
|
163.0 |
|
0.1 |
|
|
9 3/4% senior notes |
|
130.0 |
|
130.0 |
|
— |
|
|
Other debt(1) |
|
30.1 |
|
19.0 |
|
11.1 |
|
|
Total debt |
|
585.5 |
|
577.2 |
|
8.3 |
|
|
Stockholders’ equity |
|
844.8 |
|
793.7 |
|
51.1 |
|
|
Total capitalization |
|
1,430.3 |
|
1,370.9 |
|
59.4 |
|
|
Total net debt |
|
332.4 |
|
127.9 |
|
204.5 |
|
(1). Excludes $82.6 million and $256.0 million of warehouse facility at March 31, 2006 and December 31, 2005, respectively.
11
Q1 2006 Trailing Twelve Months Normalized Internal Cash Flow
• Strong cash flow generator
• $99 million, or 63% improvement from same period last year
• Low capital intensity
• Utilization of internal cash flow
• Debt reduction – full redemption of the 11¼% senior subordinated notes of $163 million scheduled for June 15, 2006
• Co-investment activities
• In-fill acquisitions
[CHART]
(1). Represents capital expenditures, net of concessions.
12
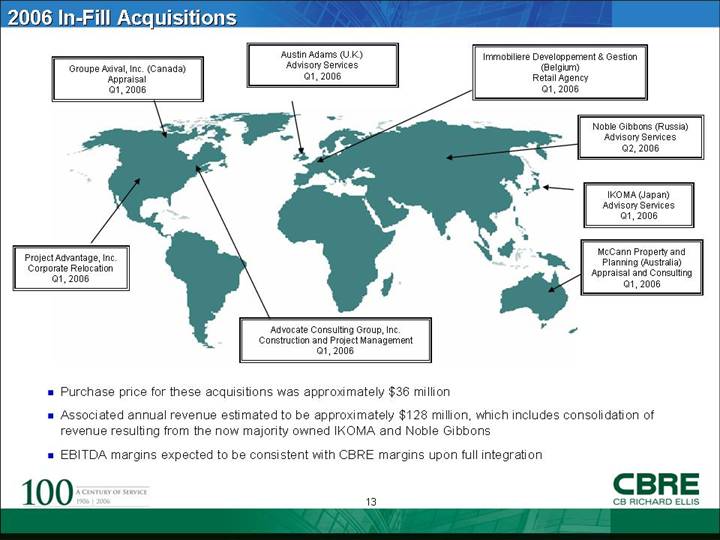
2006 In-Fill Acquisitions
[GRAPHIC]
• Purchase price for these acquisitions was approximately $36 million
• Associated annual revenue estimated to be approximately $128 million, which includes consolidation of revenue resulting from the now majority owned IKOMA and Noble Gibbons
• EBITDA margins expected to be consistent with CBRE margins upon full integration
13
Stock Split
• The Board of Directors approved a three-for-one split of the Company’s common stock
• The split will be effective on or about June 1, 2006
14
[GRAPHIC]
• Merck – Represented Merck in selling three manufacturing facilities in the U.S. and U.K. totaling over 1.75 million sq. ft.
• Ikon Office Solutions – Provide Transaction Management services for Ikon’s 1.5 million sq. ft. portfolio in the U.S., bringing our total portfolio for Ikon to 4 million sq. ft.
• Mark Winkler Company – Represented the Mark Winkler Company for the sale of 12 apartment communities, totaling more than 5,000 units for $900 million
• TIAA – Awarded the management of 1.8 million sq. ft. of industrial properties in the Washington DC area, bringing our total portfolio for TIAA to approximately 20 million sq. ft.
• State Street Corporation – Represented State Street Corporation in the acquisition of its new 365,000 sq. ft. European headquarters at Canary Wharf, U.K.
• Rotch and London – Represented Rotch and London & Regional Properties in the sale of a portfolio of 180 Shell gas stations across the U.K. at a value of $810 million
• DB Real Estate – Represented DB Real Estate in one of the largest investment sales in Paris, a 581,270 sq. ft. office building for $680 million
• Deutsche Bank – Advised Deutsche Bank in the lease of 280,000 sq. ft. of office space, the largest lease for office space ever consummated in Singapore
• Veloqx Marronnier Dori – Appointed the exclusive leasing agent for the latest showcase retail property in Tokyo’s Ginza district
16
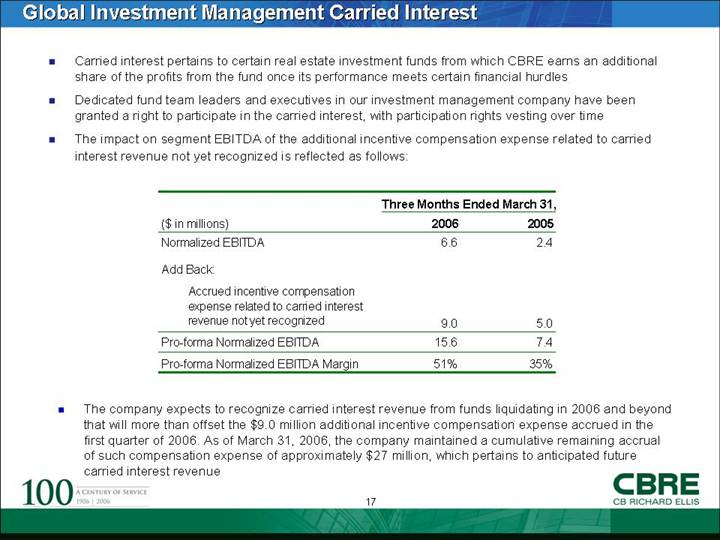
Global Investment Management Carried Interest
• Carried interest pertains to certain real estate investment funds from which CBRE earns an additional share of the profits from the fund once its performance meets certain financial hurdles
• Dedicated fund team leaders and executives in our investment management company have been granted a right to participate in the carried interest, with participation rights vesting over time
• The impact on segment EBITDA of the additional incentive compensation expense related to carried interest revenue not yet recognized is reflected as follows:
|
|
|
Three Months Ended March 31, |
|
||
|
($ in millions) |
|
2006 |
|
2005 |
|
|
Normalized EBITDA |
|
6.6 |
|
2.4 |
|
|
Add Back: |
|
|
|
|
|
|
Accrued incentive compensation |
|
9.0 |
|
5.0 |
|
|
Pro-forma Normalized EBITDA |
|
15.6 |
|
7.4 |
|
|
Pro-forma Normalized EBITDA Margin |
|
51 |
% |
35 |
% |
• The company expects to recognize carried interest revenue from funds liquidating in 2006 and beyond that will more than offset the $9.0 million additional incentive compensation expense accrued in the first quarter of 2006. As of March 31, 2006, the company maintained a cumulative remaining accrual of such compensation expense of approximately $27 million, which pertains to anticipated future carried interest revenue
17
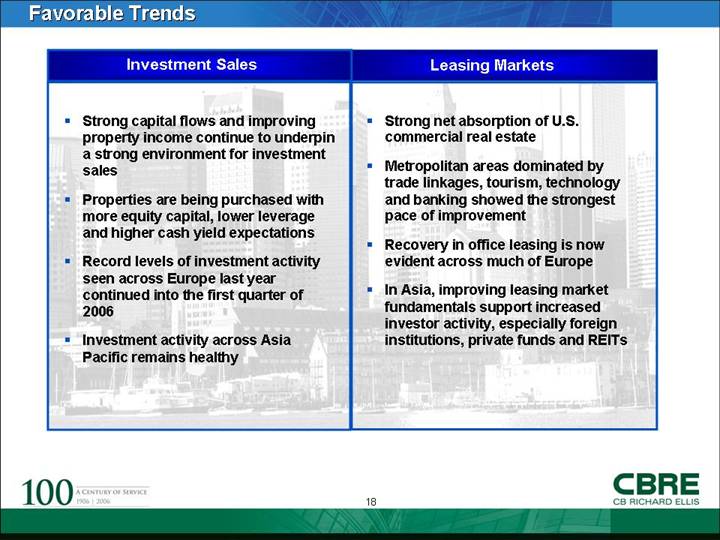
Investment Sales
• Strong capital flows and improving property income continue to underpin a strong environment for investment sales
• Properties are being purchased with more equity capital, lower leverage and higher cash yield expectations
• Record levels of investment activity seen across Europe last year continued into the first quarter of 2006
• Investment activity across Asia Pacific remains healthy
Leasing Markets
• Strong net absorption of U.S. commercial real estate
• Metropolitan areas dominated by trade linkages, tourism, technology and banking showed the strongest pace of improvement
• Recovery in office leasing is now evident across much of Europe
• In Asia, improving leasing market fundamentals support increased investor activity, especially foreign institutions, private funds and REITs
18
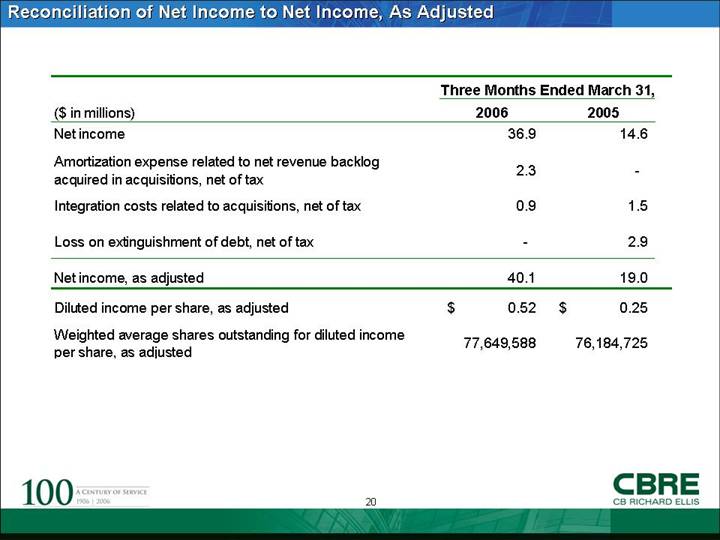
Reconciliation of Net Income to Net Income, As Adjusted
|
|
|
Three Months Ended March 31, |
|
||||
|
($ in millions) |
|
2006 |
|
2005 |
|
||
|
Net income |
|
36.9 |
|
14.6 |
|
||
|
Amortization expense related to net revenue backlog acquired in acquisitions, net of tax |
|
2.3 |
|
— |
|
||
|
Integration costs related to acquisitions, net of tax |
|
0.9 |
|
1.5 |
|
||
|
Loss on extinguishment of debt, net of tax |
|
— |
|
2.9 |
|
||
|
Net income, as adjusted |
|
40.1 |
|
19.0 |
|
||
|
Diluted income per share, as adjusted |
|
$ |
0.52 |
|
$ |
0.25 |
|
|
Weighted average shares outstanding for diluted income per share, as adjusted |
|
77,649,588 |
|
76,184,725 |
|
||
20
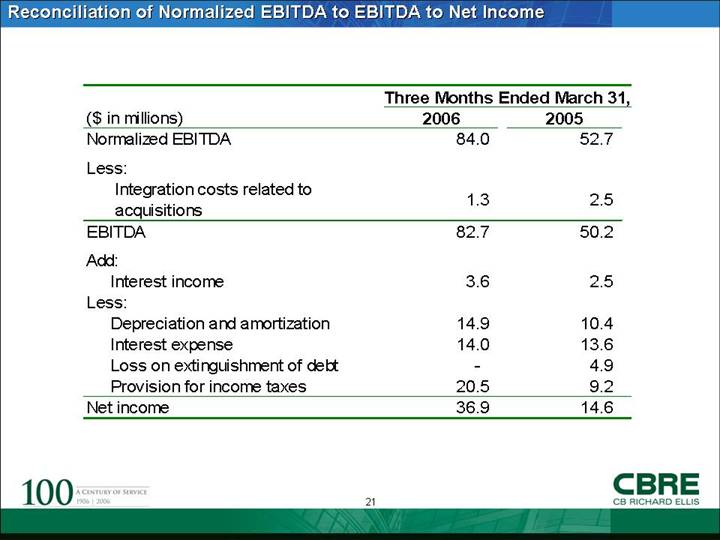
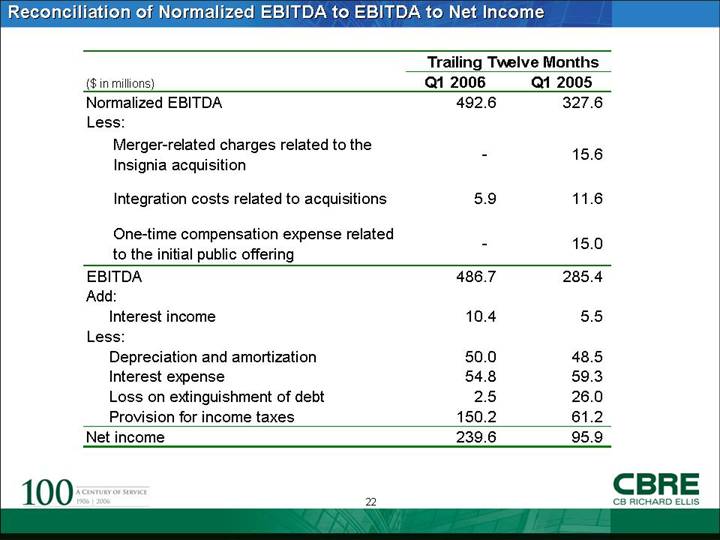
Reconciliation of Normalized EBITDA to EBITDA to Net Income
|
|
|
Three Months Ended March 31, |
|
||
|
($ in millions) |
|
2006 |
|
2005 |
|
|
Normalized EBITDA |
|
84.0 |
|
52.7 |
|
|
|
|
|
|
|
|
|
Less: |
|
|
|
|
|
|
Integration costs related to acquisitions |
|
1.3 |
|
2.5 |
|
|
EBITDA |
|
82.7 |
|
50.2 |
|
|
|
|
|
|
|
|
|
Add: |
|
|
|
|
|
|
Interest income |
|
3.6 |
|
2.5 |
|
|
Less: |
|
14.9 |
|
10.4 |
|
|
Depreciation and amortization |
|
|
|
|
|
|
Interest expense |
|
14.0 |
|
13.6 |
|
|
Loss on extinguishment of debt |
|
— |
|
4.9 |
|
|
Provision for income taxes |
|
20.5 |
|
9.2 |
|
|
Net income |
|
36.9 |
|
14.6 |
|
21
|
|
|
|
|||
|
($ in millions) |
|
Q1 2006 |
|
Q1 2005 |
|
|
Normalized EBITDA |
|
492.6 |
|
327.6 |
|
|
Less: |
|
|
|
|
|
|
Merger-related charges related to the Insignia acquisition |
|
— |
|
15.6 |
|
|
|
|
|
|
|
|
|
Integration costs related to acquisitions |
|
5.9 |
|
11.6 |
|
|
|
|
|
|
|
|
|
One-time compensation expense related to the initial public offering |
|
— |
|
15.0 |
|
|
EBITDA |
|
486.7 |
|
285.4 |
|
|
Add: |
|
|
|
|
|
|
Interest income |
|
10.4 |
|
5.5 |
|
|
Less: |
|
|
|
|
|
|
Depreciation and amortization |
|
50.0 |
|
48.5 |
|
|
Interest expense |
|
54.8 |
|
59.3 |
|
|
Loss on extinguishment of debt |
|
2.5 |
|
26.0 |
|
|
Provision for income taxes |
|
150.2 |
|
61.2 |
|
|
Net income |
|
239.6 |
|
95.9 |
|
22
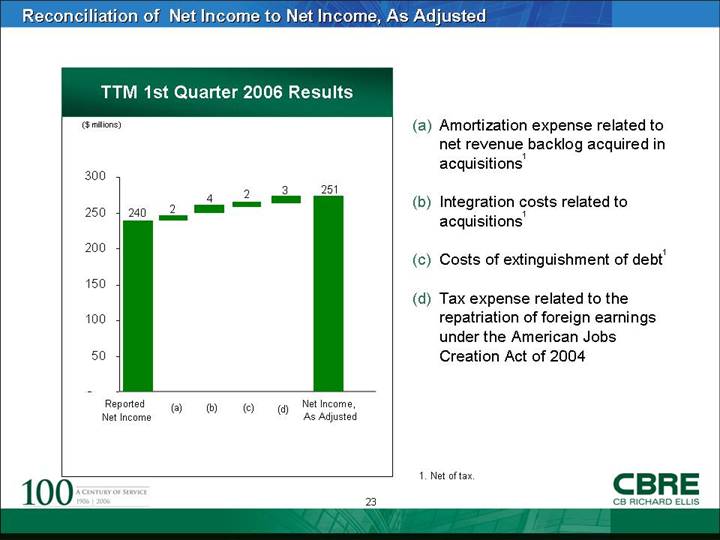
Reconciliation of Net Income to Net Income, As Adjusted
[CHART]
(a) Amortization expense related to net revenue backlog acquired in acquisitions(1)
(b) Integration costs related to acquisitions(1)
(c) Costs of extinguishment of debt(1)
(d) Tax expense related to the repatriation of foreign earnings under the American Jobs Creation Act of 2004
(1). Net of tax.
23
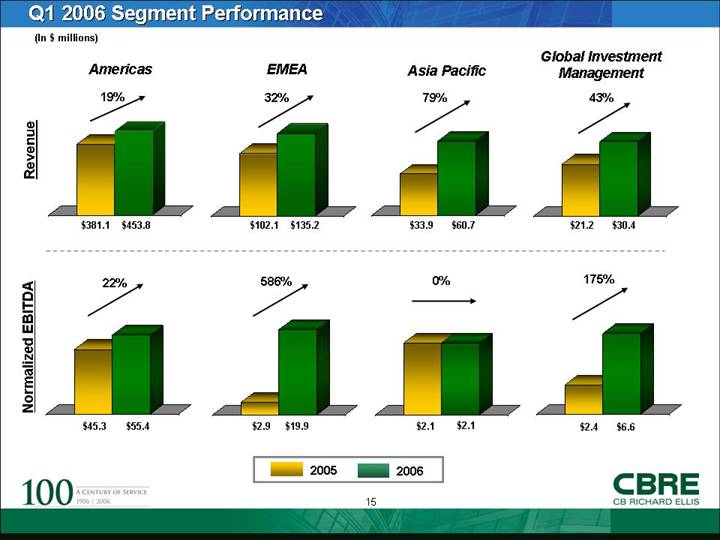
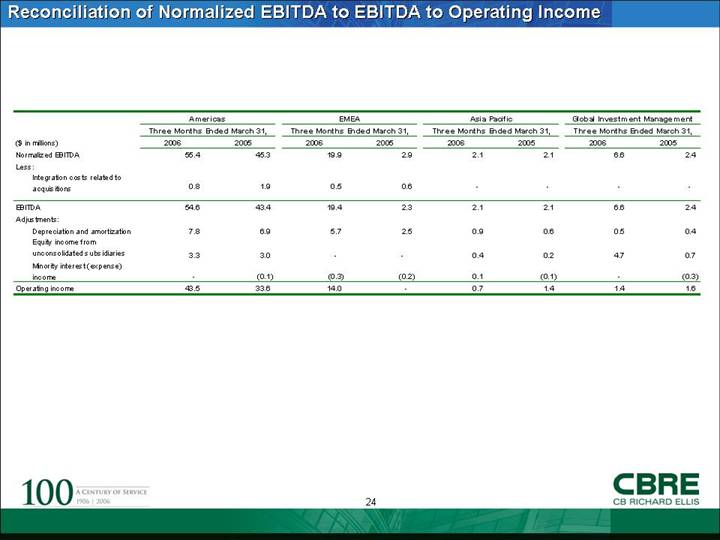
Reconciliation of Normalized EBITDA to EBITDA to Operating Income
|
|
|
Americas |
|
EMEA |
|
Asia Pacific |
|
Global Investment Management |
|
||||||||
|
|
|
Three Months Ended March 31, |
|
Three Months Ended March 31, |
|
Three Months Ended March 31, |
|
Three Months Ended March 31, |
|
||||||||
|
($ in millions) |
|
2006 |
|
2005 |
|
2006 |
|
2005 |
|
2006 |
|
2005 |
|
2006 |
|
2005 |
|
|
Normalized EBITDA |
|
55.4 |
|
45.3 |
|
19.9 |
|
2.9 |
|
2.1 |
|
2.1 |
|
6.6 |
|
2.4 |
|
|
Less: |
|
|
|
|
|
|
|
|
|
|
|
|
|
|
|
|
|
|
Integration costs related to acquisitions |
|
0.8 |
|
1.9 |
|
0.5 |
|
0.6 |
|
— |
|
— |
|
— |
|
— |
|
|
EITDA |
|
54.6 |
|
43.4 |
|
19.4 |
|
2.3 |
|
2.1 |
|
2.1 |
|
6.6 |
|
2.4 |
|
|
Adjustments: |
|
|
|
|
|
|
|
|
|
|
|
|
|
|
|
|
|
|
Depreciation and amortization |
|
7.8 |
|
6.9 |
|
5.7 |
|
2.5 |
|
0.9 |
|
0.6 |
|
0.5 |
|
0.4 |
|
|
Equity income f rom |
|
|
|
|
|
|
|
|
|
|
|
|
|
|
|
|
|
|
unconsolidated subsidiaries |
|
3.3 |
|
3.0 |
|
— |
|
— |
|
0.4 |
|
0.2 |
|
4.7 |
|
0.7 |
|
|
Minority interest (expense) |
|
|
|
|
|
|
|
|
|
|
|
|
|
|
|
|
|
|
income |
|
— |
|
(0.1 |
) |
(0.3 |
) |
(0.2 |
) |
0.1 |
|
(0.1 |
) |
— |
|
(0.3 |
) |
|
Operating income |
|
43.5 |
|
33.6 |
|
14.0 |
|
— |
|
0.7 |
|
1.4 |
|
1.4 |
|
1.6 |
|
24