Favorable Trends – Investment Sales
[CHART]
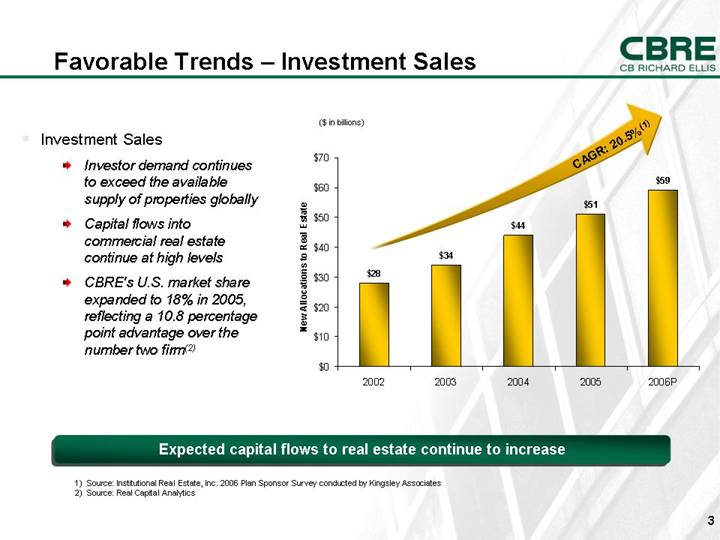
• Investment Sales
• Investor demand continues
to exceed the available supply of properties globally
• Capital flows into
commercial real estate continue at high levels
• CBRE’s U.S. market share
expanded to 18% in 2005, reflecting a 10.8 percentage point advantage over
the number two firm(2)
Expected capital flows to real estate continue to
increase
(1) Source: Institutional Real Estate, Inc. 2006
Plan Sponsor Survey conducted by Kingsley Associates
(2) Source: Real Capital Analytics
3
Favorable Trends – Leasing
[CHART]
[CHART]
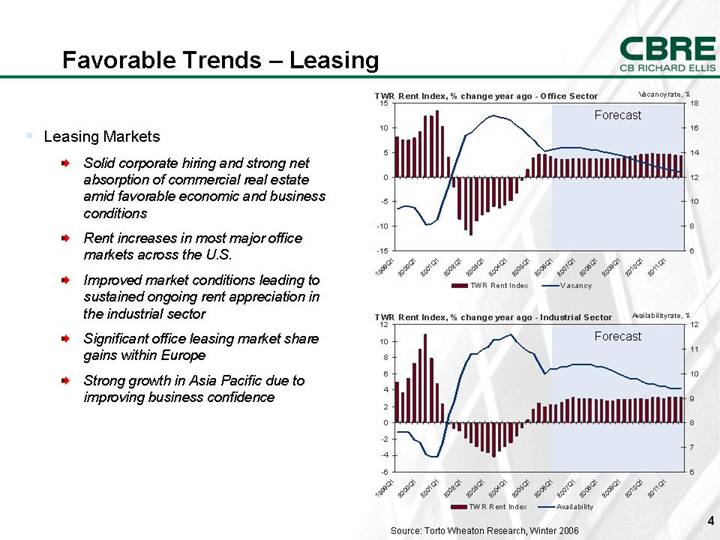
• Leasing Markets
• Solid corporate hiring and
strong net absorption of commercial real estate amid favorable economic and
business conditions
• Rent increases in most
major office markets across the U.S.
• Improved market conditions
leading to sustained ongoing rent appreciation in the industrial sector
• Significant office leasing
market share gains within Europe
• Strong growth in Asia
Pacific due to improving business confidence
Source: Torto Wheaton Research,
Winter 2006
4
The World Class Commercial Real Estate Services Provider
|
Leading Global
Brand
|
•
|
100 years
|
|
•
|
50 countries
|
|
•
|
#1 in key cities in U.S., Europe and Asia
|
|
|
|
|
|
Broad
Capabilities
|
•
|
#1 commercial real estate brokerage
|
|
•
|
#1 appraisal and valuation
|
|
•
|
#1 property and facilities management
|
|
•
|
#2 commercial mortgage brokerage
|
|
•
|
$17.3 billion in investment assets under management
|
|
|
|
|
|
Scale, Diversity
and Earnings
Power
|
•
|
2x nearest competitor
|
|
•
|
Thousands of clients, more than 70% of Fortune 100
|
|
•
|
2005 Revenue of $2.9 billion
|
|
•
|
2005 Normalized EBITDA of $461.3 million(1)
|
|
•
|
Strong organic revenue and earnings growth
|
(1) Excludes integration related charges.
6
Global Reach & Local Leadership
|
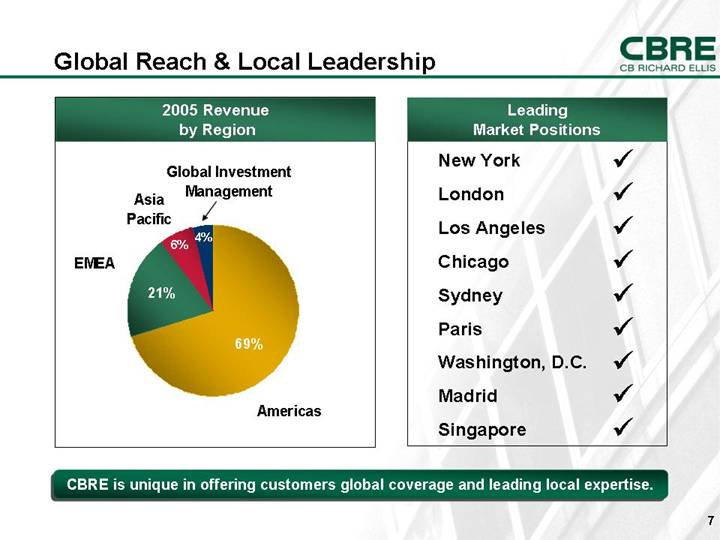
2005 Revenue
|
|
by Region
|
|
|
|
[CHART]
|
|
New York
|
ý
|
|
|
|
|
London
|
ý
|
|
|
|
|
Los
Angeles
|
ý
|
|
|
|
|
Chicago
|
ý
|
|
|
|
|
Sydney
|
ý
|
|
|
|
|
Paris
|
ý
|
|
|
|
|
Washington,
D.C.
|
ý
|
|
|
|
|
Madrid
|
ý
|
|
|
|
|
Singapore
|
ý
|
CBRE is unique in offering customers global coverage
and leading local expertise.
7
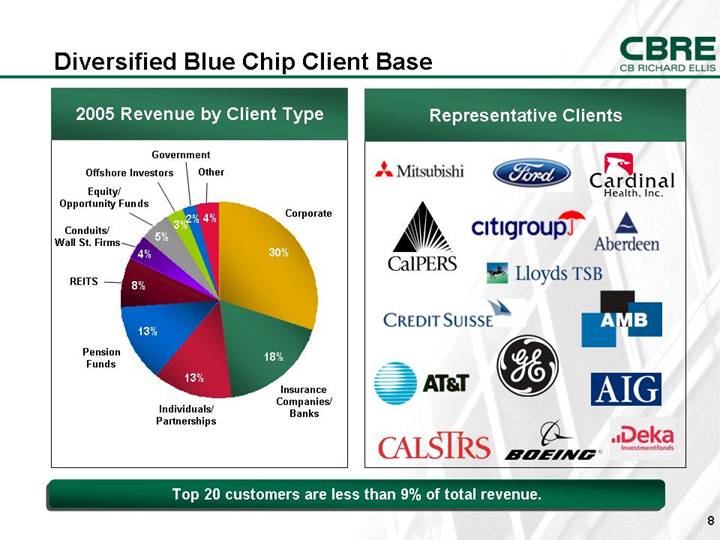
Diversified Blue Chip Client Base
2005 Revenue by Client Type
[CHART]
Representative Clients
[LOGO]
Top 20 customers are less than 9% of total revenue.
8
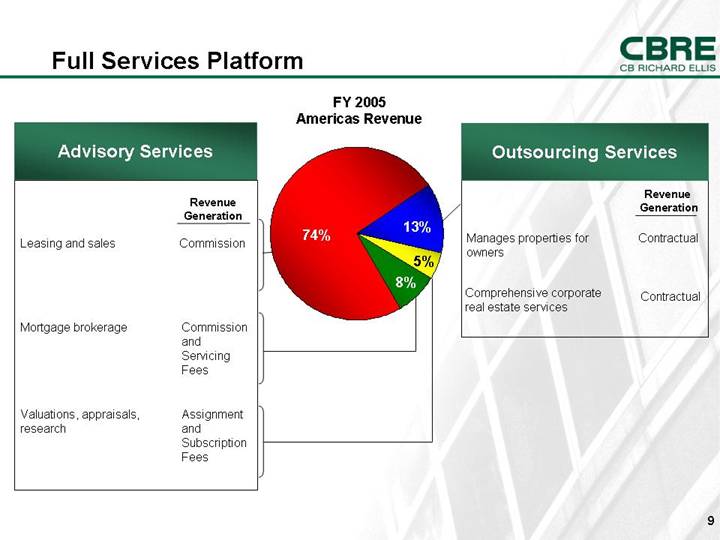
Full Services Platform
|
Advisory Services
|
FY 2005
Americas Revenue
|
Outsourcing Services
|
|
|
|
|
|
|
|
|
|
|
|
Revenue
Generation
|
|
|
|
Revenue
Generation
|
|
|
|
|
|
|
|
|
|
Leasing and sales
|
|
Commission
|
[CHART]
|
Manages properties for owners
|
|
Contractual
|
|
|
|
|
|
|
|
|
|
Mortgage brokerage
|
|
Commission and Servicing Fees
|
|
Comprehensive corporate real estate
services
|
|
Contractual
|
|
|
|
|
|
|
|
|
|
Valuations, appraisals, research
|
|
Assignment and Subscription Fees
|
|
|
|
|
9
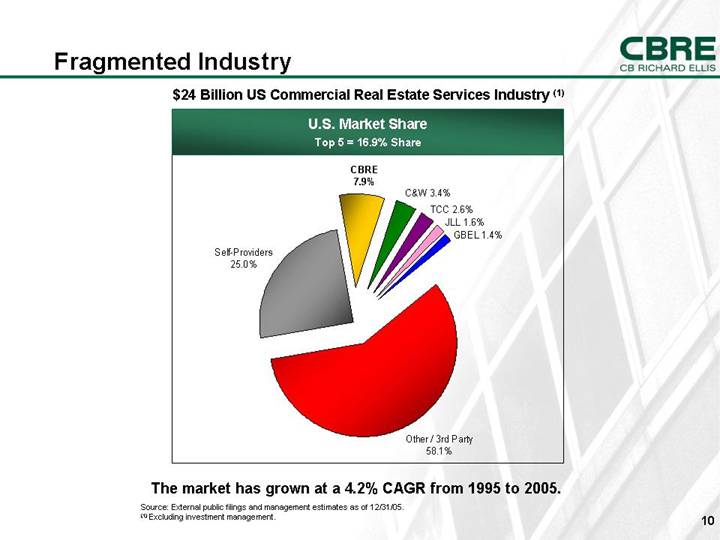
Fragmented Industry
$24 Billion US Commercial Real Estate Services
Industry (1)
U.S. Market Share
Top
5 = 16.9% Share
[CHART]
The market has grown at a 4.2% CAGR from 1995 to 2005.
Source:
External public filings and management estimates as of 12/31/05.
(1) Excluding investment management.
10
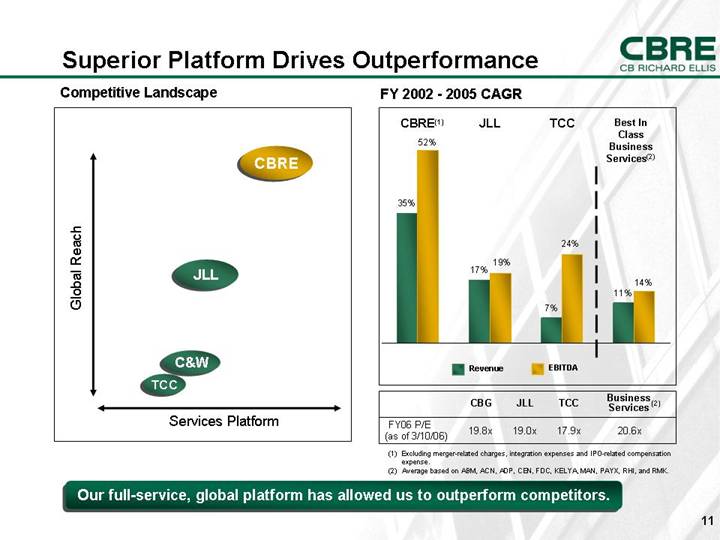
Superior Platform Drives Outperformance
Competitive
Landscape
[CHART]
FY 2002 - 2005 CAGR
[CHART]
|
|
|
CBG
|
|
JLL
|
|
TCC
|
|
Business
Services(2)
|
|
|
|
|
|
|
|
|
|
|
|
|
|
FY06 P/E
(as of 3/10/06)
|
|
19.8
|
x
|
19.0
|
x
|
17.9
|
x
|
20.6
|
x
|
(1) Excluding merger-related charges, integration
expenses and IPO-related compensation expense.
(2) Average based on ABM, ACN, ADP, CEN, FDC,
KELYA, MAN, PAYX, RHI, and RMK.
Our full-service, global platform has allowed us to
outperform competitors.
11
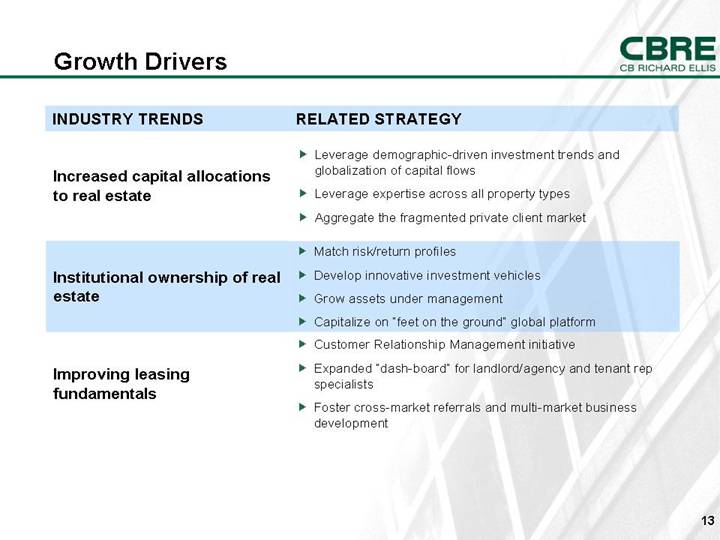
Growth Drivers
|
INDUSTRY
TRENDS
|
|
RELATED
STRATEGY
|
|
|
|
|
|
|
Increased capital allocations to real estate
|
|
•
|
Leverage
demographic-driven investment trends and globalization of capital flows
|
|
|
•
|
Leverage
expertise across all property types
|
|
|
•
|
Aggregate
the fragmented private client market
|
|
|
|
|
|
|
Institutional ownership of real estate
|
|
•
|
Match
risk/return profiles
|
|
|
•
|
Develop
innovative investment vehicles
|
|
|
•
|
Grow
assets under management
|
|
|
•
|
Capitalize
on “feet on the ground” global platform
|
|
|
|
|
|
|
Improving leasing fundamentals
|
|
•
|
Customer
Relationship Management initiative
|
|
|
•
|
Expanded
“dash-board” for landlord/agency and tenant rep specialists
|
|
|
•
|
Foster
cross-market referrals and multi-market business development
|
13
|
INDUSTRY TRENDS
|
|
RELATED
STRATEGY
|
|
|
|
|
|
|
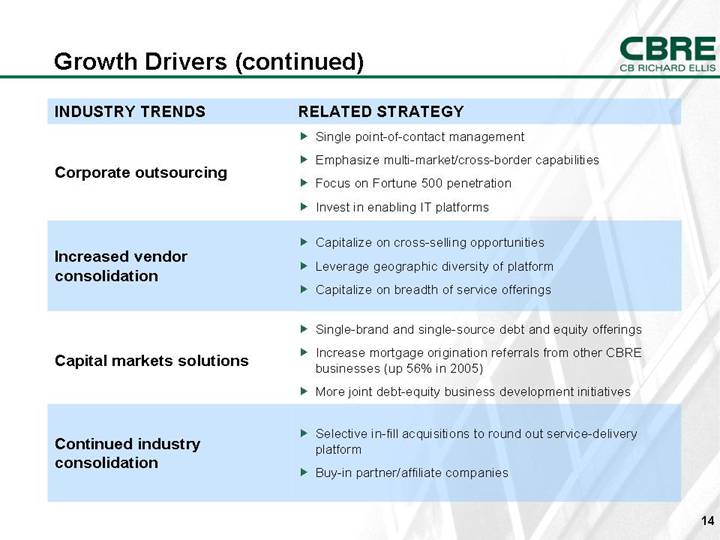
Corporate outsourcing
|
|
•
|
Single
point-of-contact management
|
|
|
•
|
Emphasize
multi-market/cross-border capabilities
|
|
|
•
|
Focus
on Fortune 500 penetration
|
|
|
•
|
Invest
in enabling IT platforms
|
|
|
|
|
|
|
Increased vendor consolidation
|
|
•
|
Capitalize
on cross-selling opportunities
|
|
|
•
|
Leverage
geographic diversity of platform
|
|
|
•
|
Capitalize
on breadth of service offerings
|
|
|
|
|
|
|
Capital markets solutions
|
|
•
|
Single-brand
and single-source debt and equity offerings
|
|
|
•
|
Increase
mortgage origination referrals from other CBRE businesses (up 56% in 2005)
|
|
|
•
|
More
joint debt-equity business development initiatives
|
|
|
|
|
|
|
Continued industry consolidation
|
|
•
|
Selective
in-fill acquisitions to round out service-delivery platform
|
|
|
•
|
Buy-in
partner/affiliate companies
|
14
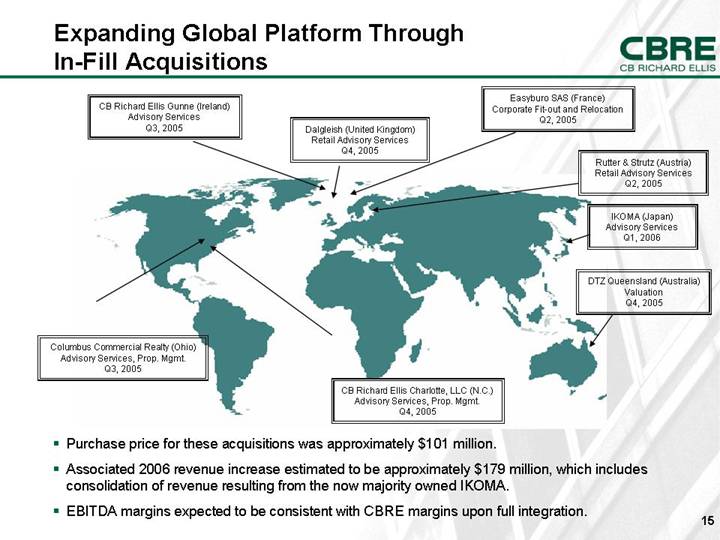
Expanding Global Platform Through In-Fill Acquisitions
[GRAPHIC]
• Purchase price for these acquisitions was
approximately $101 million.
• Associated 2006 revenue increase estimated to
be approximately $179 million, which includes consolidation of revenue
resulting from the now majority owned IKOMA.
• EBITDA margins expected to be consistent with
CBRE margins upon full integration.
15
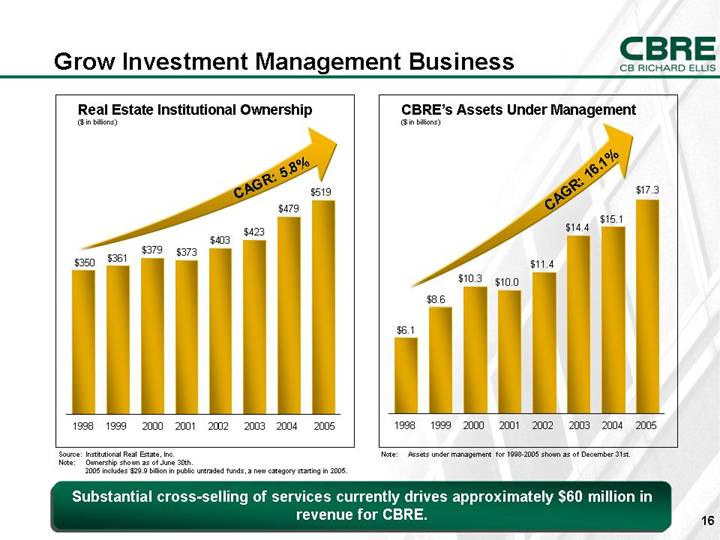
Grow Investment Management Business
Source: Institutional Real Estate, Inc.
Note: Ownership shown as of June 30th.
2005
includes $29.9 billion in public untraded funds, a new category starting in
2005.
|
CBRE’s Assets Under Management
|
|
($ in billions)
|
|
|
|
[CHART]
|
Note: Assets under management for 1998-2005 shown as of December 31st.
Substantial cross-selling of services currently drives
approximately $60 million in revenue for CBRE.
16
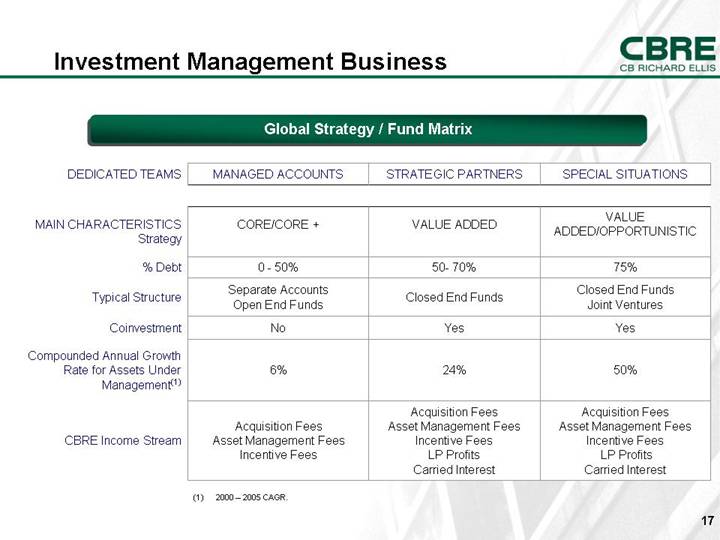
Investment Management Business
Global
Strategy / Fund Matrix
|
DEDICATED TEAMS
|
|
MANAGED ACCOUNTS
|
|
STRATEGIC PARTNERS
|
|
SPECIAL SITUATIONS
|
|
|
|
|
|
|
|
|
|
|
|
MAIN CHARACTERISTICS Strategy
|
|
CORE/CORE +
|
|
VALUE ADDED
|
|
VALUE
ADDED/OPPORTUNISTIC
|
|
|
|
|
|
|
|
|
|
|
|
% Debt
|
|
0 - 50%
|
|
50- 70%
|
|
75%
|
|
|
|
|
|
|
|
|
|
|
|
Typical Structure
|
|
Separate
Accounts
Open End Funds
|
|
Closed End
Funds
|
|
Closed End
Funds
Joint Ventures
|
|
|
|
|
|
|
|
|
|
|
|
Coinvestment
|
|
No
|
|
Yes
|
|
Yes
|
|
|
|
|
|
|
|
|
|
|
|
Compounded Annual Growth Rate for Assets
Under Management(1)
|
|
6%
|
|
24%
|
|
50%
|
|
|
|
|
|
|
|
|
|
|
|
CBRE Income Stream
|
|
Acquisition
Fees
Asset Management Fees
Incentive Fees
|
|
Acquisition
Fees
Asset Management Fees
Incentive Fees
LP Profits
Carried Interest
|
|
Acquisition
Fees
Asset Management Fees
Incentive Fees
LP Profits
Carried Interest
|
|
(1) 2000
– 2005 CAGR.
17
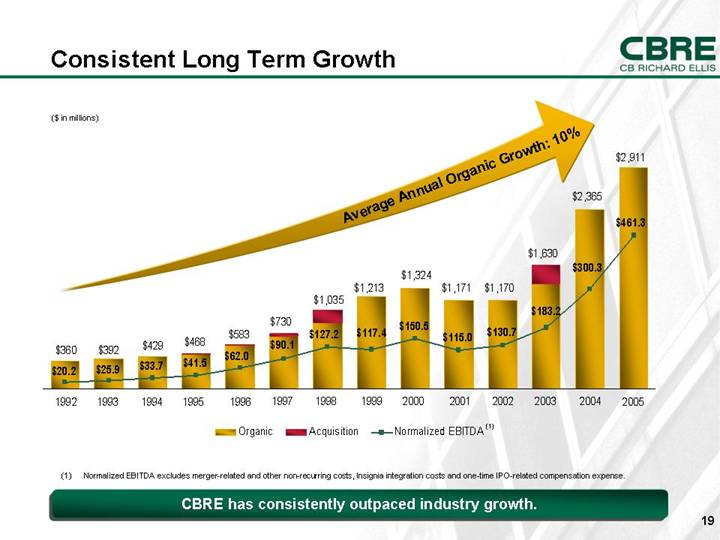
Consistent Long Term Growth
[CHART]
(1) Normalized EBITDA excludes merger-related and
other non-recurring costs, Insignia integration costs and one-time IPO-related
compensation expense.
CBRE has
consistently outpaced industry growth.
19
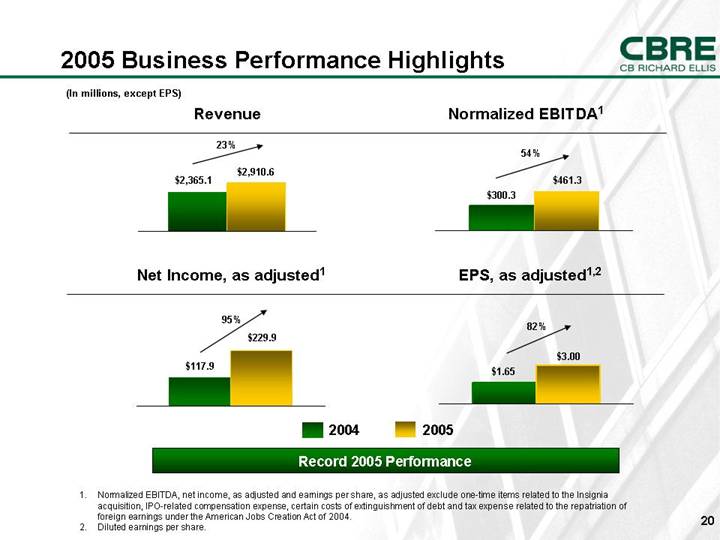
2005 Business Performance
Highlights
(In millions, except EPS)
|
Revenue
|
|
Normalized
EBITDA(1)
|
|
[CHART]
|
|
[CHART]
|
|
|
|
|
|
Net
Income, as adjusted(1)
|
|
EPS, as
adjusted(1),(2)
|
|
[CHART]
|
|
[CHART]
|
|
|
|
|
|
Record
2005 Performance
|
(1) Normalized EBITDA, net income, as adjusted and earnings per share, as
adjusted exclude one-time items related to the Insignia acquisition,
IPO-related compensation expense, certain costs of extinguishment of debt and
tax expense related to the repatriation of foreign earnings under the American
Jobs Creation Act of 2004.
(2) Diluted earnings per share.
20
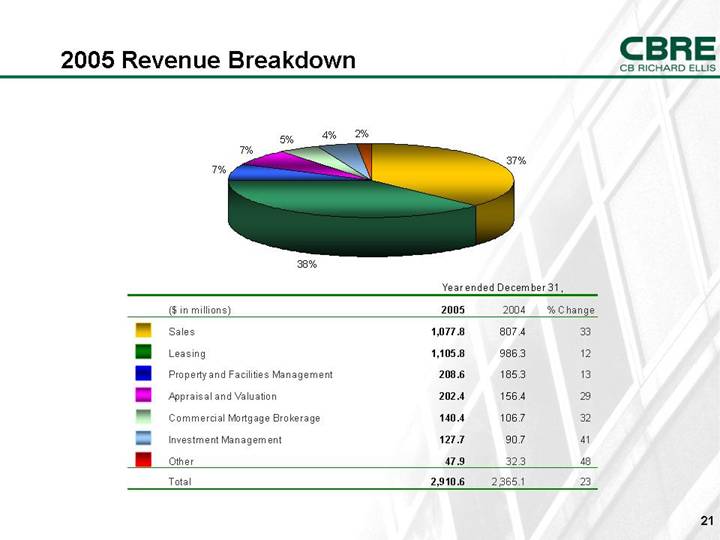
2005 Revenue Breakdown
[CHART]
|
|
|
Year ended December 31,
|
|
|
($ in millions)
|
|
2005
|
|
2004
|
|
% Change
|
|
|
|
|
|
|
|
|
|
|
|
Sales
|
|
1,077.8
|
|
807.4
|
|
33
|
|
|
|
|
|
|
|
|
|
|
|
Leasing
|
|
1,105.8
|
|
986.3
|
|
12
|
|
|
|
|
|
|
|
|
|
|
|
Property and Facilities Management
|
|
208.6
|
|
185.3
|
|
13
|
|
|
|
|
|
|
|
|
|
|
|
Appraisal and Valuation
|
|
202.4
|
|
156.4
|
|
29
|
|
|
|
|
|
|
|
|
|
|
|
Commercial Mortgage Brokerage
|
|
140.4
|
|
106.7
|
|
32
|
|
|
|
|
|
|
|
|
|
|
|
Investment Management
|
|
127.7
|
|
90.7
|
|
41
|
|
|
|
|
|
|
|
|
|
|
|
Other
|
|
47.9
|
|
32.3
|
|
48
|
|
|
|
|
|
|
|
|
|
|
|
Total
|
|
2,910.6
|
|
2,365.1
|
|
23
|
|
21
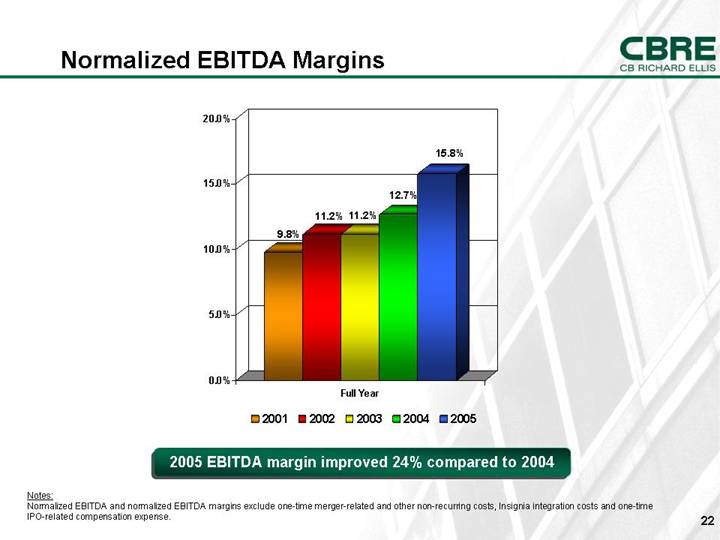
Normalized EBITDA Margins
[CHART]
2005 EBITDA
margin improved 24% compared to 2004
Notes:
Normalized
EBITDA and normalized EBITDA margins exclude one-time merger-related and other
non-recurring costs, Insignia
integration costs and one-time IPO-related compensation expense.
22
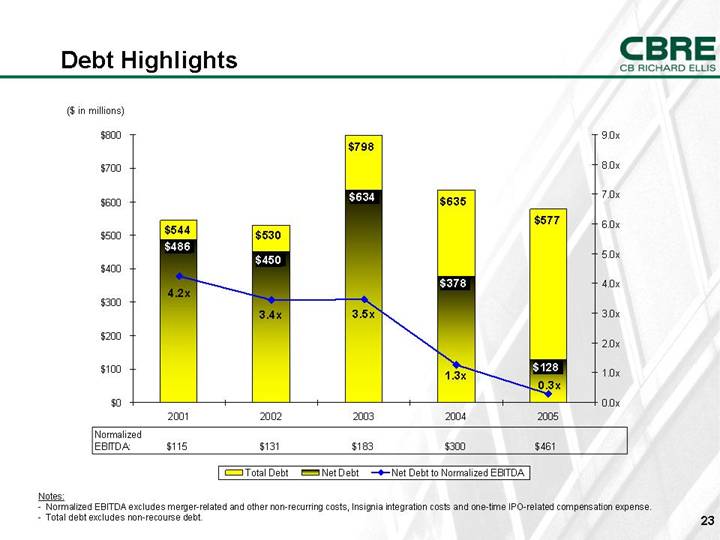
Debt Highlights
[CHART]
Notes:
• Normalized
EBITDA excludes merger-related and other non-recurring costs, Insignia
integration costs and one-time IPO-related compensation expense.
• Total
debt excludes non-recourse debt.
23
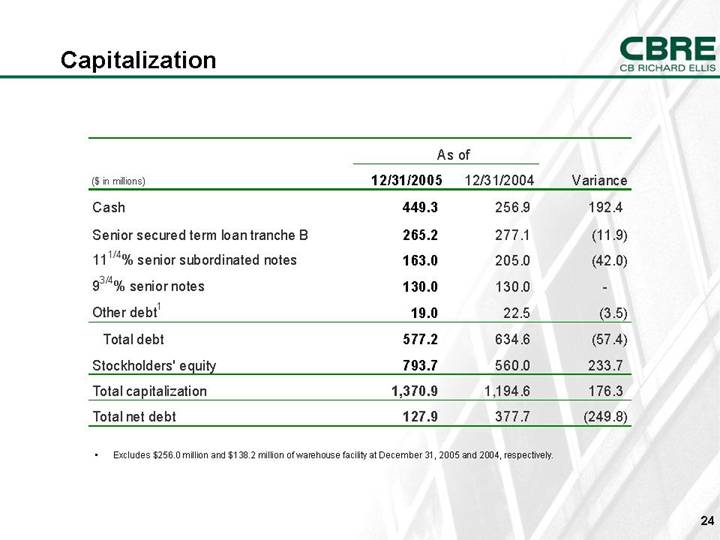
Capitalization
|
|
|
As of
|
|
|
|
|
($ in millions)
|
|
12/31/2005
|
|
12/31/2004
|
|
Variance
|
|
|
Cash
|
|
449.3
|
|
256.9
|
|
192.4
|
|
|
|
|
|
|
|
|
|
|
|
Senior secured term loan tranche B
|
|
265.2
|
|
277.1
|
|
(11.9
|
)
|
|
11 1/4% senior
subordinated notes
|
|
163.0
|
|
205.0
|
|
(42.0
|
)
|
|
9 3/4% senior
notes
|
|
130.0
|
|
130.0
|
|
—
|
|
|
Other debt(1)
|
|
19.0
|
|
22.5
|
|
(3.5
|
)
|
|
Total debt
|
|
577.2
|
|
634.6
|
|
(57.4
|
)
|
|
Stockholders’ equity
|
|
793.7
|
|
560.0
|
|
233.7
|
|
|
Total capitalization
|
|
1,370.9
|
|
1,194.6
|
|
176.3
|
|
|
Total net debt
|
|
127.9
|
|
377.7
|
|
(249.8
|
)
|
• Excludes
$256.0 million and $138.2 million of warehouse facility at December 31,
2005 and 2004, respectively.
24
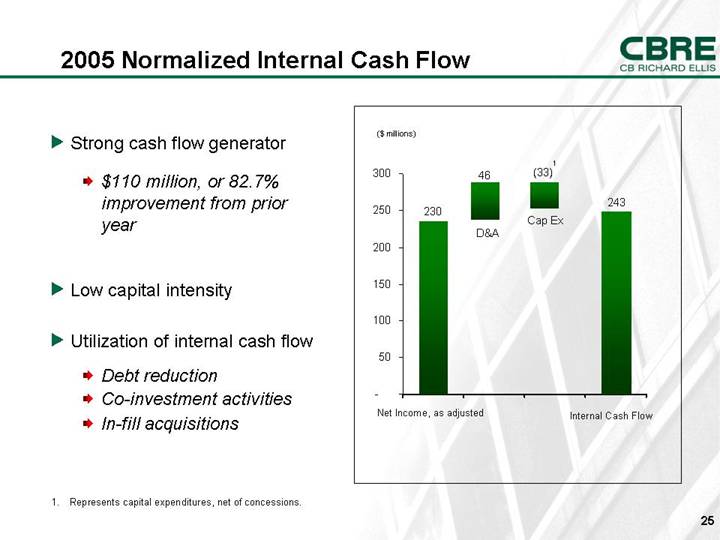
2005 Normalized Internal Cash
Flow
[CHART]
• Strong
cash flow generator
• $110 million, or 82.7%
improvement from prior year
• Low capital
intensity
• Utilization
of internal cash flow
• Debt reduction
• Co-investment activities
• In-fill acquisitions
(1) Represents capital
expenditures, net of concessions.
25
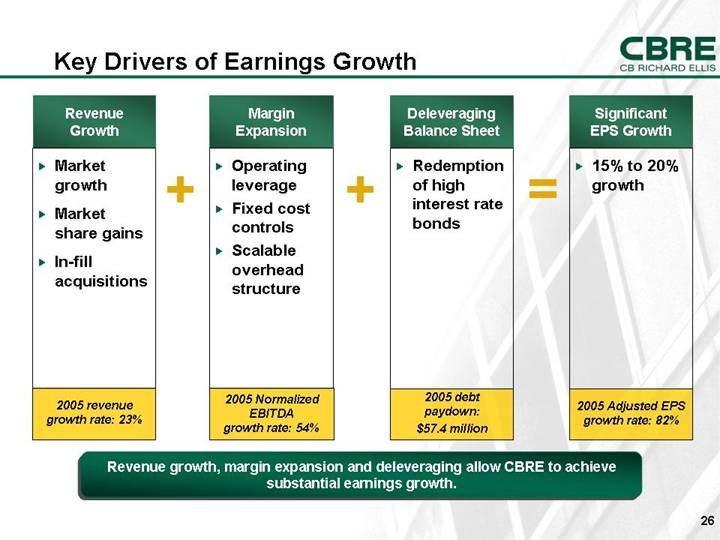
Key Drivers of Earnings Growth
|
Revenue
Growth
|
|
Margin
Expansion
|
|
Deleveraging
Balance Sheet
|
|
Significant
EPS Growth
|
|
|
|
|
|
|
|
|
|
|
|
• Market
growth
|
+
|
• Operating
leverage
|
+
|
• Redemption of high
interest rate bonds
|
=
|
• 15% to 20%
growth
|
|
|
|
|
|
|
|
|
|
|
|
• Market share gains
|
|
• Fixed cost controls
|
|
|
|
|
|
|
|
|
|
|
|
|
|
|
|
• In-fill acquisitions
|
|
• Scalable overhead
structure
|
|
|
|
|
|
|
|
|
|
|
|
|
|
|
|
2005 revenue
growth rate: 23%
|
|
2005 Normalized
EBITDA
growth rate: 54%
|
|
2005 debt
paydown:
$57.4 million
|
|
2005 Adjusted EPS
growth rate: 82%
|
|
Revenue
growth, margin expansion and deleveraging allow CBRE to achieve substantial
earnings growth.
26
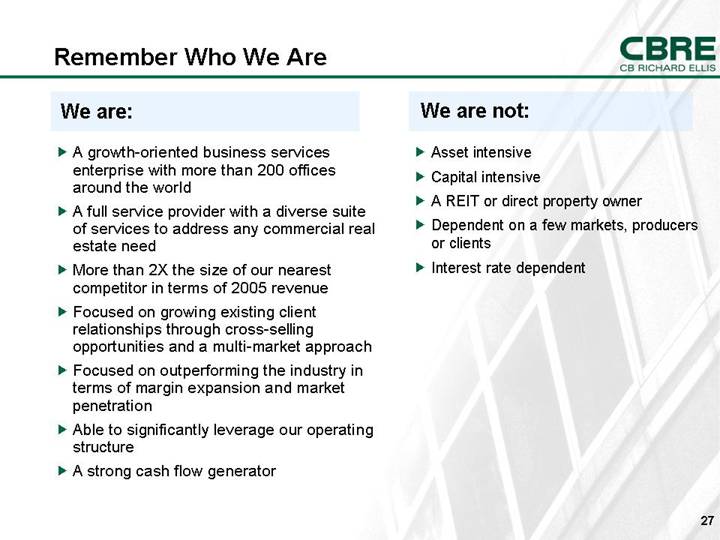
Remember Who We Are
We are:
• A
growth-oriented business services enterprise with more than 200 offices around
the world
• A
full service provider with a diverse suite of services to address any
commercial real estate need
• More
than 2X the size of our nearest competitor in terms of 2005 revenue
• Focused
on growing existing client relationships through cross-selling opportunities
and a multi-market approach
• Focused
on outperforming the industry in terms of margin expansion and market
penetration
• Able
to significantly leverage our operating structure
• A
strong cash flow generator
We are not:
• Asset
intensive
• Capital
intensive
• A
REIT or direct property owner
• Dependent
on a few markets, producers or clients
• Interest
rate dependent
27
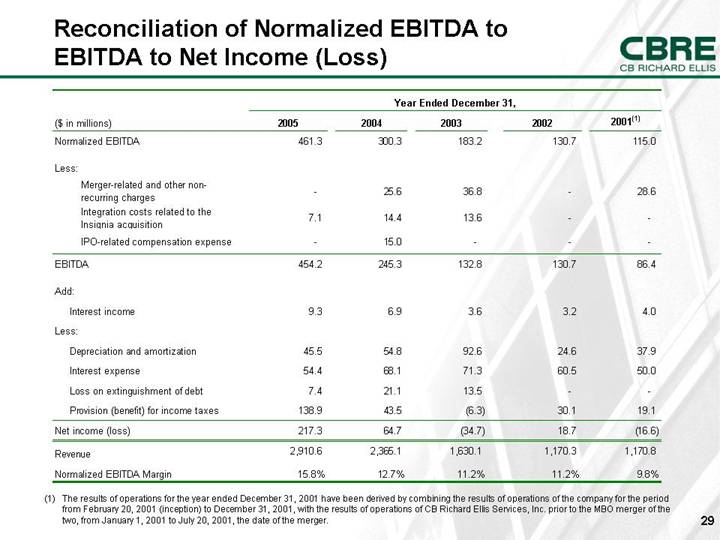
Reconciliation of Normalized EBITDA to EBITDA to Net Income (Loss)
|
|
|
Year Ended December 31,
|
|
|
($ in millions)
|
|
2005
|
|
2004
|
|
2003
|
|
2002
|
|
2001(1)
|
|
|
Normalized EBITDA
|
|
461.3
|
|
300.3
|
|
183.2
|
|
130.7
|
|
115.0
|
|
|
|
|
|
|
|
|
|
|
|
|
|
|
|
Less:
|
|
|
|
|
|
|
|
|
|
|
|
|
Merger-related
and other non-recurring charges
|
|
—
|
|
25.6
|
|
36.8
|
|
—
|
|
28.6
|
|
|
Integration
costs related to the Insignia acquisition
|
|
7.1
|
|
14.4
|
|
13.6
|
|
—
|
|
—
|
|
|
IPO-related
compensation expense
|
|
—
|
|
15.0
|
|
—
|
|
—
|
|
—
|
|
|
EBITDA
|
|
454.2
|
|
245.3
|
|
132.8
|
|
130.7
|
|
86.4
|
|
|
|
|
|
|
|
|
|
|
|
|
|
|
|
Add:
|
|
|
|
|
|
|
|
|
|
|
|
|
Interest
income
|
|
9.3
|
|
6.9
|
|
3.6
|
|
3.2
|
|
4.0
|
|
|
|
|
|
|
|
|
|
|
|
|
|
|
|
Less:
|
|
|
|
|
|
|
|
|
|
|
|
|
Depreciation
and amortization
|
|
45.5
|
|
54.8
|
|
92.6
|
|
24.6
|
|
37.9
|
|
|
Interest
expense
|
|
54.4
|
|
68.1
|
|
71.3
|
|
60.5
|
|
50.0
|
|
|
Loss on
extinguishment of debt
|
|
7.4
|
|
21.1
|
|
13.5
|
|
—
|
|
—
|
|
|
Provision
(benefit) for income taxes
|
|
138.9
|
|
43.5
|
|
(6.3
|
)
|
30.1
|
|
19.1
|
|
|
Net income
(loss)
|
|
217.3
|
|
64.7
|
|
(34.7
|
)
|
18.7
|
|
(16.6
|
)
|
|
|
|
|
|
|
|
|
|
|
|
|
|
|
Revenue
|
|
2,910.6
|
|
2,365.1
|
|
1,630.1
|
|
1,170.3
|
|
1,170.8
|
|
|
|
|
|
|
|
|
|
|
|
|
|
|
|
Normalized
EBITDA Margin
|
|
15.8
|
%
|
12.7
|
%
|
11.2
|
%
|
11.2
|
%
|
9.8
|
%
|
(1) The results of operations for the year ended December 31, 2001 have
been derived by combining the results of operations of the company for the
period from February 20, 2001 (inception) to December 31, 2001, with
the results of operations of CB Richard Ellis Services, Inc. prior to the
MBO merger of the two, from January 1, 2001 to July 20, 2001, the
date of the merger.
29
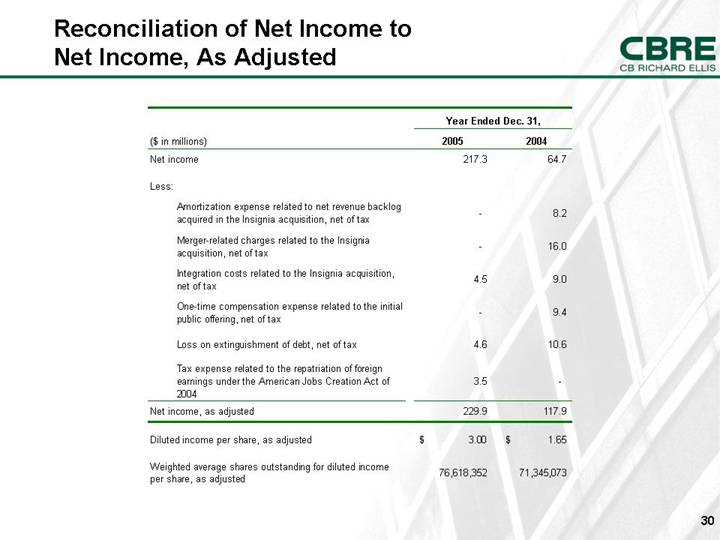
Reconciliation of Net Income to Net Income, As Adjusted
|
|
|
Year Ended Dec. 31,
|
|
|
($ in millions)
|
|
2005
|
|
2004
|
|
|
Net income
|
|
217.3
|
|
64.7
|
|
|
|
|
|
|
|
|
|
Less:
|
|
|
|
|
|
|
|
|
|
|
|
|
|
Amortization
expense related to net revenue backlog acquired in the Insignia acquisition,
net of tax
|
|
—
|
|
8.2
|
|
|
|
|
|
|
|
|
|
Merger-related
charges related to the Insignia acquisition, net of tax
|
|
—
|
|
16.0
|
|
|
|
|
|
|
|
|
|
Integration
costs related to the Insignia acquisition, net of tax
|
|
4.5
|
|
9.0
|
|
|
|
|
|
|
|
|
|
One-time compensation
expense related to the initial public offering, net of tax
|
|
—
|
|
9.4
|
|
|
|
|
|
|
|
|
|
Loss on
extinguishment of debt, net of tax
|
|
4.6
|
|
10.6
|
|
|
|
|
|
|
|
|
|
Tax expense
related to the repatriation of foreign earnings under the American Jobs
Creation Act of 2004
|
|
3.5
|
|
—
|
|
|
|
|
|
|
|
|
|
Net income, as adjusted
|
|
229.9
|
|
117.9
|
|
|
|
|
|
|
|
|
|
Diluted
income per share, as adjusted
|
|
$
|
3.00
|
|
$
|
1.65
|
|
|
|
|
|
|
|
|
|
Weighted
average shares outstanding for diluted income per share, as adjusted
|
|
76,618,352
|
|
71,345,073
|
|
|
|
|
|
|
|
|
|
30