Exhibit 99.2
Link to searchable text of slide shown above
Searchable text section of graphics shown above
[GRAPHIC]
CB Richard Ellis Group, Inc.
Fourth Quarter 2005
Earnings Conference Call
February 2, 2006
|
100 |
A CENTURY OF SERVICE |
[LOGO] |
|
1906 | 2006 |
|
Forward Looking Statements
This presentation contains statements that are forward looking within the meaning of the Private Securities Litigation Reform Act of 1995, including statements regarding our growth momentum in 2005 and 2006, future operations and future financial performance. These statements should be considered as estimates only and actual results may ultimately differ from these estimates. Except to the extent required by applicable securities laws, CB Richard Ellis Group, Inc. undertakes no obligation to update or publicly revise any of the forward-looking statements that you may hear today. Please refer to our annual report on Form 10-K and our quarterly reports on Form 10-Q, which are filed with the SEC and available at the SEC’s website (http://www.sec.gov), for a full discussion of the risks and other factors, that may impact any estimates that you may hear today. We may make certain statements during the course of this presentation which include references to “non-GAAP financial measures,” as defined by SEC regulations. As required by these regulations, we have provided reconciliations of these measures to what we believe are the most directly comparable GAAP measures, which are attached hereto within the appendix.
|
100 |
A CENTURY OF SERVICE |
[LOGO] |
|
1906 | 2006 |
|
1
Conference Call Participants
Brett White, President & Chief Executive Officer
Ken Kay, Senior Executive VP & Chief Financial Officer
Jim Reid, President, Eastern Region (U.S.)
Shelley Young, Director, Investor Relations
2
Q4 2005 Summary
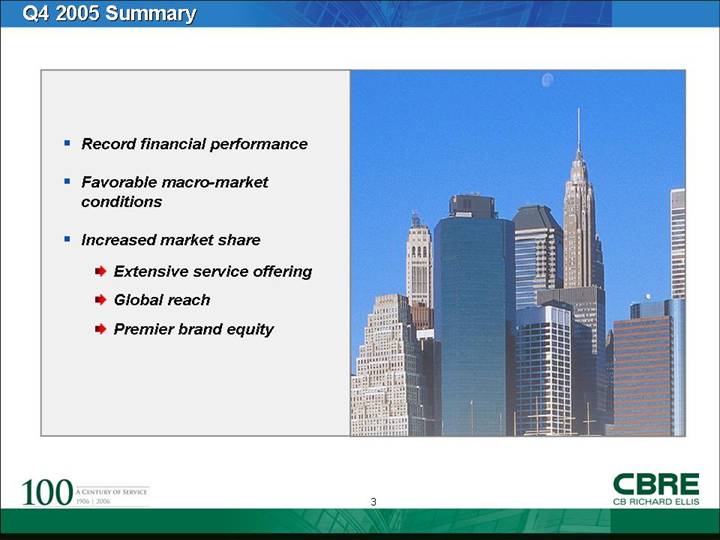
• Record financial performance
• Favorable macro-market conditions
• Increased market share
• Extensive service offering
• Global reach
• Premier brand equity
[GRAPHIC]
3
Q4 2005 Performance Highlights
|
Revenue |
|
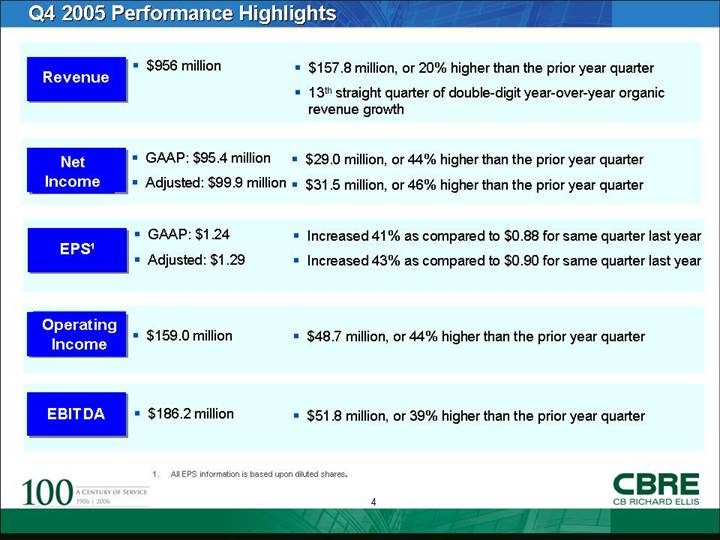
• $956 million |
|
• $157.8 million, or 20% higher than the prior year quarter • 13th straight quarter of double-digit year-over-year organic revenue growth |
|
|
|
|
|
|
|
Net |
|
• GAAP: $95.4 million
• Adjusted: $99.9 million |
|
• $29.0 million, or 44% higher than the prior year quarter • $31.5 million, or 46% higher than the prior year quarter |
|
|
|
|
|
|
|
EPS(1) |
|
• GAAP: $1.24
• Adjusted: $1.29 |
|
• Increased 41% as compared to $0.88 for same quarter last year
• Increased 43% as compared to $0.90 for same quarter last year |
|
|
|
|
|
|
|
Operating |
|
• $159.0 million |
|
• $48.7 million, or 44% higher than the prior year quarter |
|
|
|
|
|
|
|
EBITDA |
|
• $186.2 million |
|
• $51.8 million, or 39% higher than the prior year quarter |
(1) All EPS information is based upon diluted shares.
4
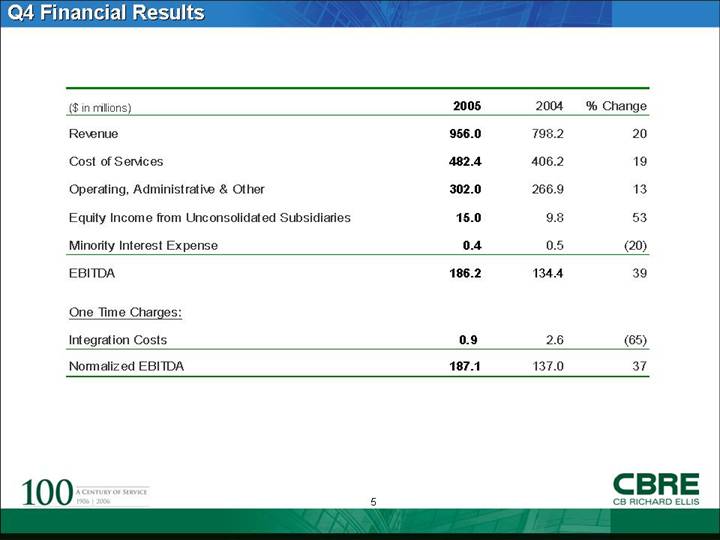
Q4 Financial Results
|
($ in millions) |
|
2005 |
|
2004 |
|
% Change |
|
|
|
|
|
|
|
|
|
|
|
Revenue |
|
956.0 |
|
798.2 |
|
20 |
|
|
|
|
|
|
|
|
|
|
|
Cost of Services |
|
482.4 |
|
406.2 |
|
19 |
|
|
|
|
|
|
|
|
|
|
|
Operating, Administrative & Other |
|
302.0 |
|
266.9 |
|
13 |
|
|
|
|
|
|
|
|
|
|
|
Equity Income from Unconsolidated Subsidiaries |
|
15.0 |
|
9.8 |
|
53 |
|
|
|
|
|
|
|
|
|
|
|
Minority Interest Expense |
|
0.4 |
|
0.5 |
|
(20 |
) |
|
|
|
|
|
|
|
|
|
|
EBITDA |
|
186.2 |
|
134.4 |
|
39 |
|
|
|
|
|
|
|
|
|
|
|
One Time Charges: |
|
|
|
|
|
|
|
|
|
|
|
|
|
|
|
|
|
Integration Costs |
|
0.9 |
|
2.6 |
|
(65 |
) |
|
|
|
|
|
|
|
|
|
|
Normalized EBITDA |
|
187.1 |
|
137.0 |
|
37 |
|
5
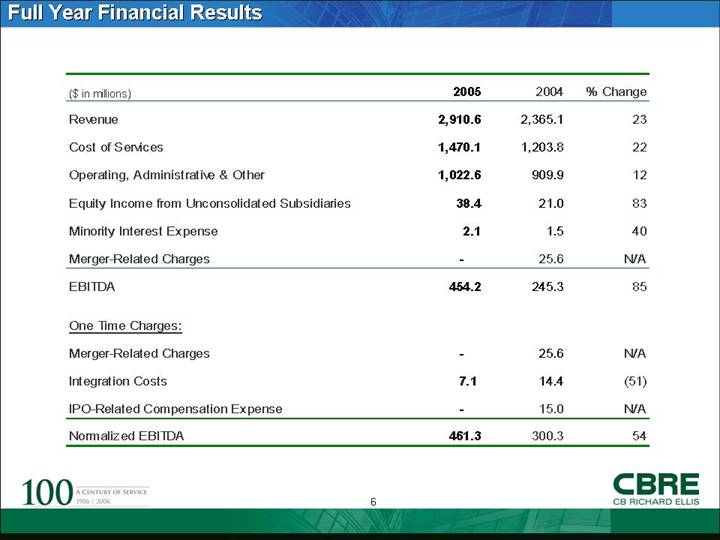
Full Year Financial Results
|
($ in millions) |
|
2005 |
|
2004 |
|
% Change |
|
|
|
|
|
|
|
|
|
|
|
Revenue |
|
2,910.6 |
|
2,365.1 |
|
23 |
|
|
|
|
|
|
|
|
|
|
|
Cost of Services |
|
1,470.1 |
|
1,203.8 |
|
22 |
|
|
|
|
|
|
|
|
|
|
|
Operating, Administrative & Other |
|
1,022.6 |
|
909.9 |
|
12 |
|
|
|
|
|
|
|
|
|
|
|
Equity Income from Unconsolidated Subsidiaries |
|
38.4 |
|
21.0 |
|
83 |
|
|
|
|
|
|
|
|
|
|
|
Minority Interest Expense |
|
2.1 |
|
1.5 |
|
40 |
|
|
|
|
|
|
|
|
|
|
|
Merger-Related Charges |
|
— |
|
25.6 |
|
N/A |
|
|
|
|
|
|
|
|
|
|
|
EBITDA |
|
454.2 |
|
245.3 |
|
85 |
|
|
|
|
|
|
|
|
|
|
|
One Time Charges: |
|
|
|
|
|
|
|
|
|
|
|
|
|
|
|
|
|
Merger-Related Charges |
|
— |
|
25.6 |
|
N/A |
|
|
|
|
|
|
|
|
|
|
|
Integration Costs |
|
7.1 |
|
14.4 |
|
(51 |
) |
|
|
|
|
|
|
|
|
|
|
IPO-Related Compensation Expense |
|
— |
|
15.0 |
|
N/A |
|
|
|
|
|
|
|
|
|
|
|
Normalized EBITDA |
|
461.3 |
|
300.3 |
|
54 |
|
6
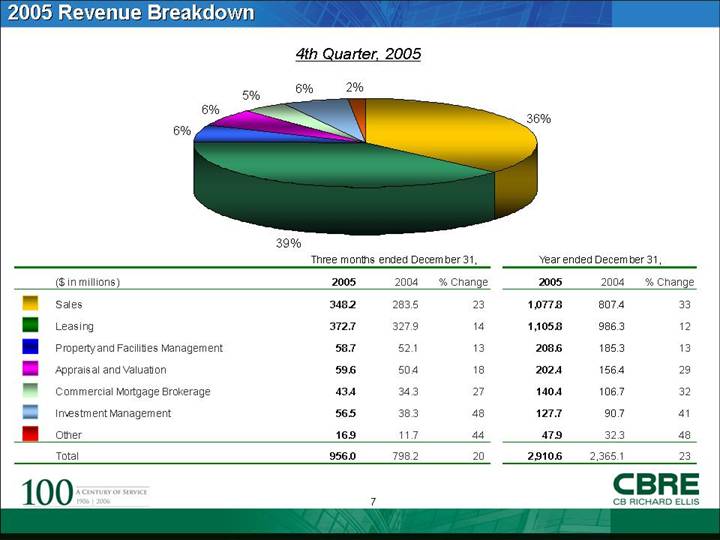
2005 Revenue Breakdown
4th Quarter, 2005
[CHART]
|
|
|
Three months ended December 31, |
|
Year ended December 31, |
|
||||||||
|
($ in millions) |
|
2005 |
|
2004 |
|
% Change |
|
2005 |
|
2004 |
|
% Change |
|
|
|
|
|
|
|
|
|
|
|
|
|
|
|
|
|
Sales |
|
348.2 |
|
283.5 |
|
23 |
|
1,077.8 |
|
807.4 |
|
33 |
|
|
|
|
|
|
|
|
|
|
|
|
|
|
|
|
|
Leasing |
|
372.7 |
|
327.9 |
|
14 |
|
1,105.8 |
|
986.3 |
|
12 |
|
|
|
|
|
|
|
|
|
|
|
|
|
|
|
|
|
Property and Facilities Management |
|
58.7 |
|
52.1 |
|
13 |
|
208.6 |
|
185.3 |
|
13 |
|
|
|
|
|
|
|
|
|
|
|
|
|
|
|
|
|
Appraisal and Valuation |
|
59.6 |
|
50.4 |
|
18 |
|
202.4 |
|
156.4 |
|
29 |
|
|
|
|
|
|
|
|
|
|
|
|
|
|
|
|
|
Commercial Mortgage Brokerage |
|
43.4 |
|
34.3 |
|
27 |
|
140.4 |
|
106.7 |
|
32 |
|
|
|
|
|
|
|
|
|
|
|
|
|
|
|
|
|
Investment Management |
|
56.5 |
|
38.3 |
|
48 |
|
127.7 |
|
90.7 |
|
41 |
|
|
|
|
|
|
|
|
|
|
|
|
|
|
|
|
|
Other |
|
16.9 |
|
11.7 |
|
44 |
|
47.9 |
|
32.3 |
|
48 |
|
|
|
|
|
|
|
|
|
|
|
|
|
|
|
|
|
Total |
|
956.0 |
|
798.2 |
|
20 |
|
2,910.6 |
|
2,365.1 |
|
23 |
|
7
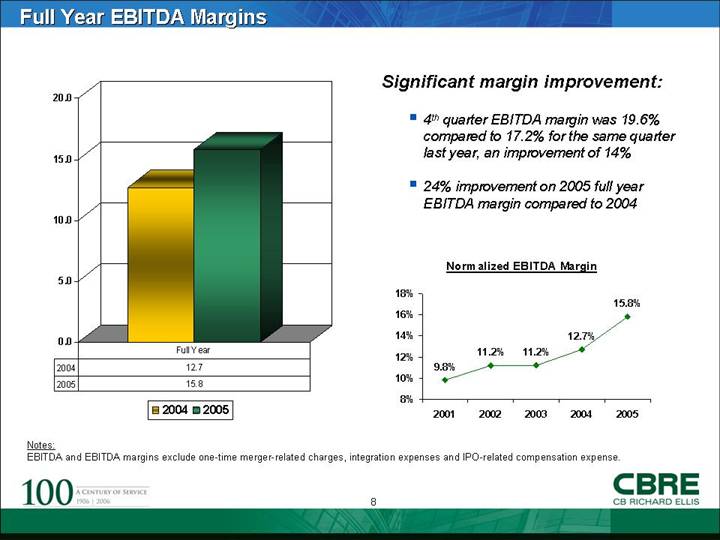
Full Year EBITDA Margins
[CHART]
Significant margin improvement:
• 4th quarter EBITDA margin was 19.6% compared to 17.2% for the same quarter last year, an improvement of 14%
• 24% improvement on 2005 full year EBITDA margin compared to 2004
Normalized EBITDA Margin
[CHART]
Notes:
EBITDA and EBITDA margins exclude one-time merger-related charges, integration expenses and IPO-related compensation expense.
8
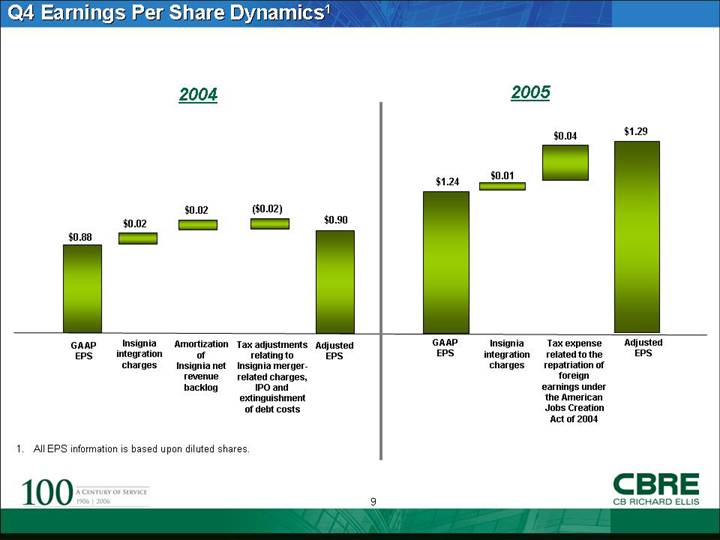
Q4 Earnings Per Share Dynamics(1)
|
2004 |
|
2005 |
|
|
|
|
|
[CHART] |
|
[CHART] |
(1) All EPS information is based upon diluted shares.
9
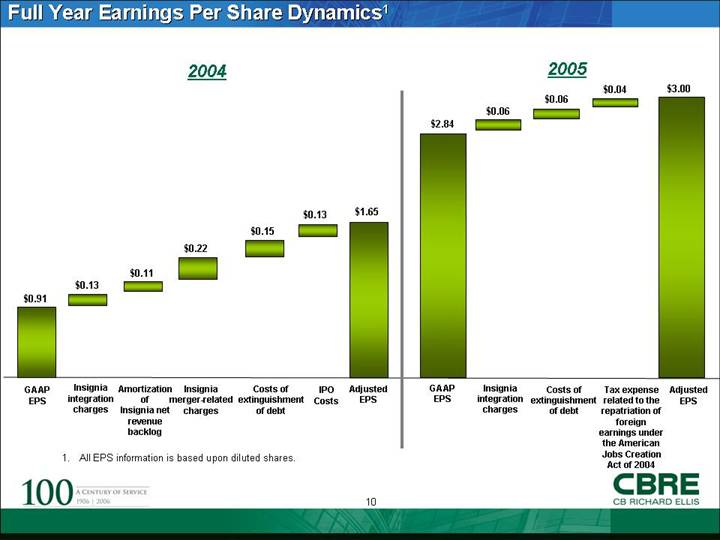
Full Year Earnings Per Share Dynamics(1)
|
2004 |
|
2005 |
|
|
|
|
|
[CHART] |
|
[CHART] |
(1) All EPS information is based upon diluted shares.
10
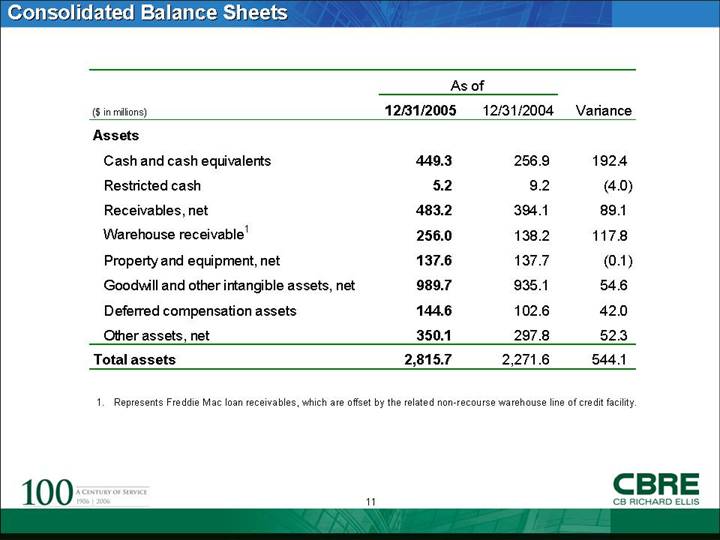
Consolidated Balance Sheets
|
|
|
As of |
|
|
|
||
|
($ in millions) |
|
12/31/2005 |
|
12/31/2004 |
|
Variance |
|
|
|
|
|
|
|
|
|
|
|
Assets |
|
|
|
|
|
|
|
|
|
|
|
|
|
|
|
|
|
Cash and cash equivalents |
|
449.3 |
|
256.9 |
|
192.4 |
|
|
|
|
|
|
|
|
|
|
|
Restricted cash |
|
5.2 |
|
9.2 |
|
(4.0 |
) |
|
|
|
|
|
|
|
|
|
|
Receivables, net |
|
483.2 |
|
394.1 |
|
89.1 |
|
|
|
|
|
|
|
|
|
|
|
Warehouse receivable(1) |
|
256.0 |
|
138.2 |
|
117.8 |
|
|
|
|
|
|
|
|
|
|
|
Property and equipment, net |
|
137.6 |
|
137.7 |
|
(0.1 |
) |
|
|
|
|
|
|
|
|
|
|
Goodwill and other intangible assets, net |
|
989.7 |
|
935.1 |
|
54.6 |
|
|
|
|
|
|
|
|
|
|
|
Deferred compensation assets |
|
144.6 |
|
102.6 |
|
42.0 |
|
|
|
|
|
|
|
|
|
|
|
Other assets, net |
|
350.1 |
|
297.8 |
|
52.3 |
|
|
|
|
|
|
|
|
|
|
|
Total assets |
|
2,815.7 |
|
2,271.6 |
|
544.1 |
|
(1) Represents Freddie Mac loan receivables, which are offset by the related non-recourse warehouse line of credit facility.
11
|
|
|
As of |
|
|
|
||
|
($ in millions) |
|
12/31/2005 |
|
12/31/2004 |
|
Variance |
|
|
|
|
|
|
|
|
|
|
|
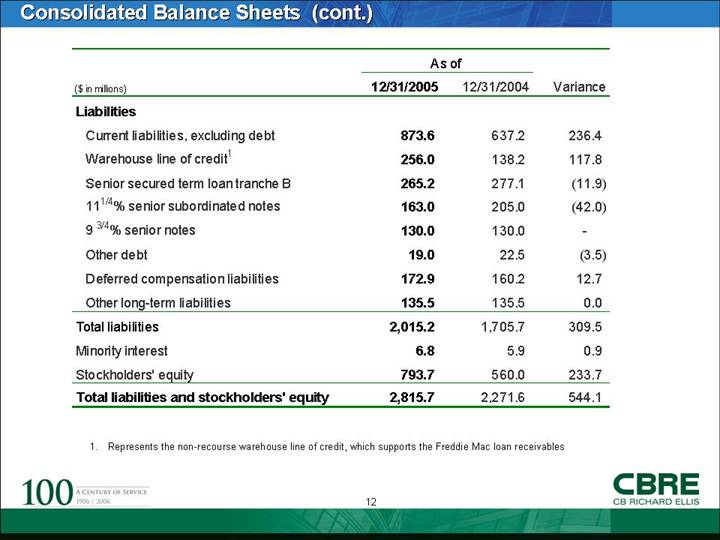
Liabilities |
|
|
|
|
|
|
|
|
|
|
|
|
|
|
|
|
|
Current liabilities, excluding debt |
|
873.6 |
|
637.2 |
|
236.4 |
|
|
|
|
|
|
|
|
|
|
|
Warehouse line of credit(1) |
|
256.0 |
|
138.2 |
|
117.8 |
|
|
|
|
|
|
|
|
|
|
|
Senior secured term loan tranche B |
|
265.2 |
|
277.1 |
|
(11.9 |
) |
|
|
|
|
|
|
|
|
|
|
111/4% senior subordinated notes |
|
163.0 |
|
205.0 |
|
(42.0 |
) |
|
|
|
|
|
|
|
|
|
|
93/4% senior notes |
|
130.0 |
|
130.0 |
|
— |
|
|
|
|
|
|
|
|
|
|
|
Other debt |
|
19.0 |
|
22.5 |
|
(3.5 |
) |
|
|
|
|
|
|
|
|
|
|
Deferred compensation liabilities |
|
172.9 |
|
160.2 |
|
12.7 |
|
|
|
|
|
|
|
|
|
|
|
Other long-term liabilities |
|
135.5 |
|
135.5 |
|
0.0 |
|
|
|
|
|
|
|
|
|
|
|
Total liabilities |
|
2,015.2 |
|
1,705.7 |
|
309.5 |
|
|
|
|
|
|
|
|
|
|
|
Minority interest |
|
6.8 |
|
5.9 |
|
0.9 |
|
|
|
|
|
|
|
|
|
|
|
Stockholders’ equity |
|
793.7 |
|
560.0 |
|
233.7 |
|
|
|
|
|
|
|
|
|
|
|
Total liabilities and stockholders’ equity |
|
2,815.7 |
|
2,271.6 |
|
544.1 |
|
(1) Represents the non-recourse warehouse line of credit, which supports the Freddie Mac loan receivables
12
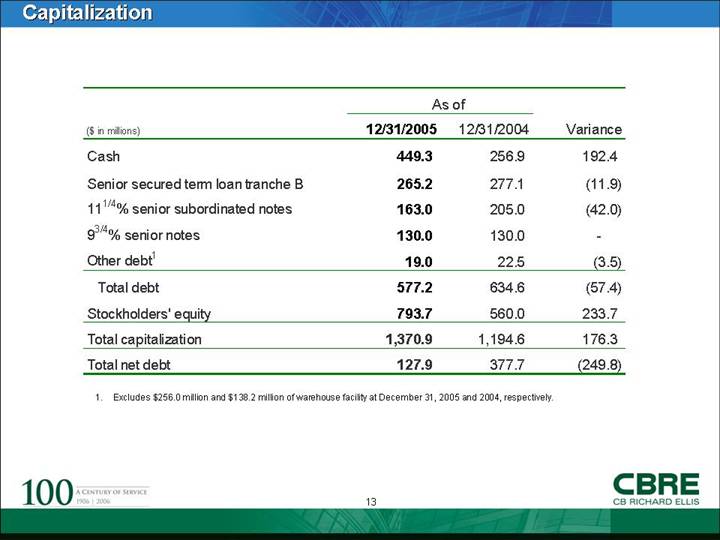
Capitalization
|
|
|
As of |
|
|
|
||
|
($ in millions) |
|
12/31/2005 |
|
12/31/2004 |
|
Variance |
|
|
|
|
|
|
|
|
|
|
|
Cash |
|
449.3 |
|
256.9 |
|
192.4 |
|
|
|
|
|
|
|
|
|
|
|
Senior secured term loan tranche B |
|
265.2 |
|
277.1 |
|
(11.9 |
) |
|
|
|
|
|
|
|
|
|
|
111/4% senior subordinated notes |
|
163.0 |
|
205.0 |
|
(42.0 |
) |
|
|
|
|
|
|
|
|
|
|
93/4% senior notes |
|
130.0 |
|
130.0 |
|
— |
|
|
|
|
|
|
|
|
|
|
|
Other debt(1) |
|
19.0 |
|
22.5 |
|
(3.5 |
) |
|
|
|
|
|
|
|
|
|
|
Total debt |
|
577.2 |
|
634.6 |
|
(57.4 |
) |
|
|
|
|
|
|
|
|
|
|
Stockholders’ equity |
|
793.7 |
|
560.0 |
|
233.7 |
|
|
|
|
|
|
|
|
|
|
|
Total capitalization |
|
1,370.9 |
|
1,194.6 |
|
176.3 |
|
|
|
|
|
|
|
|
|
|
|
Total net debt |
|
127.9 |
|
377.7 |
|
(249.8 |
) |
(1) Excludes $256.0 million and $138.2 million of warehouse facility at December 31, 2005 and 2004, respectively.
13
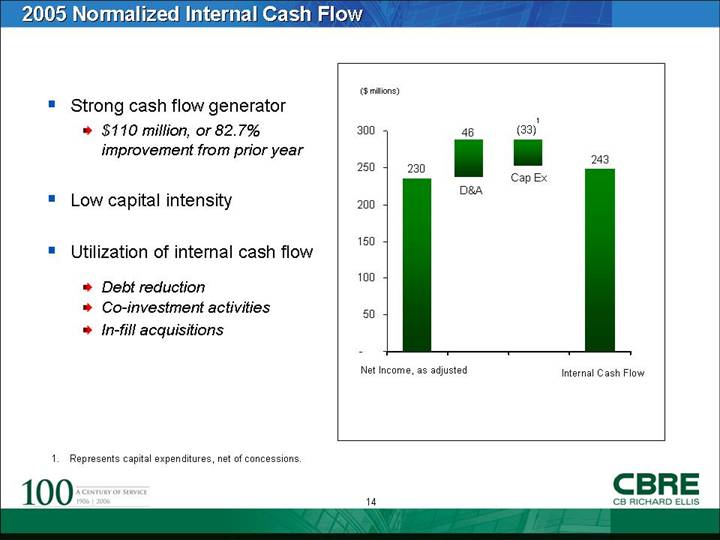
2005 Normalized Internal Cash Flow
• Strong cash flow generator
• $110 million, or 82.7% improvement from prior year
• Low capital intensity
• Utilization of internal cash flow
• Debt reduction
• Co-investment activities
• In-fill acquisitions
[CHART]
(1) Represents capital expenditures, net of concessions.
14
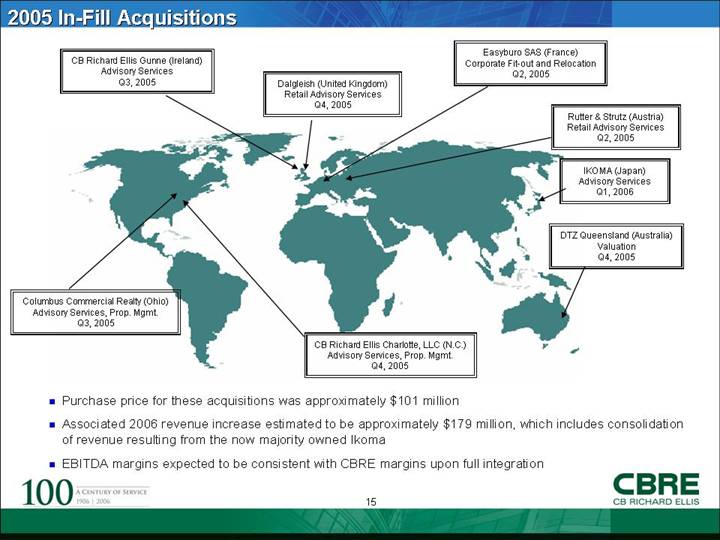
2005 In-Fill Acquisitions
[GRAPHIC]
• Purchase price for these acquisitions was approximately $101 million
• Associated 2006 revenue increase estimated to be approximately $179 million, which includes consolidation of revenue resulting from the now majority owned Ikoma
• EBITDA margins expected to be consistent with CBRE margins upon full integration
15
2006 Guidance
As compared to 2005 results, the Company expects to generate full year 2006 diluted earnings per share(1) growth of approximately 15 – 20%
(1) Excluding one-time acquisition related and debt buy-back charges.
16
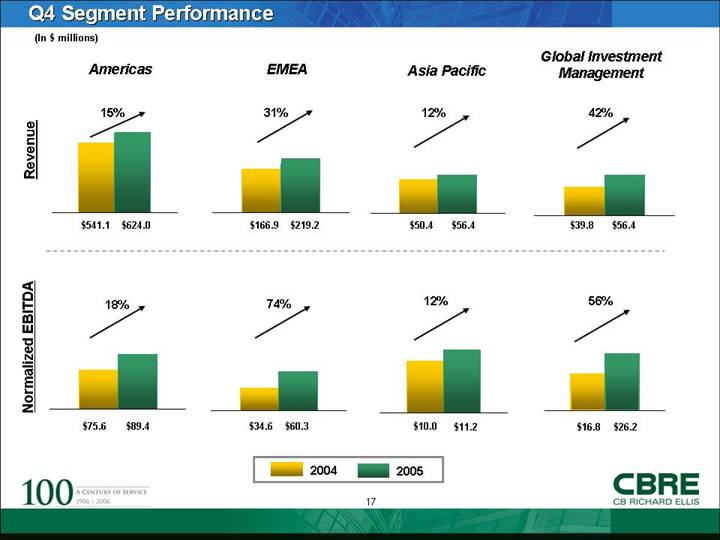
Q4 Segment Performance
(In $ millions)
|
|
|
Americas |
|
EMEA |
|
Asia Pacific |
|
Global Investment Management |
|
|
|
|
|
|
|
|
|
|
|
|
|
Revenue |
|
[CHART] |
|
[CHART] |
|
[CHART] |
|
[CHART] |
|
|
|
|
|
|
|
|
|
|
|
|
|
Normalized EBITDA |
|
[CHART] |
|
[CHART] |
|
[CHART] |
|
[CHART] |
|
17
CBRE Recent Wins
• RMB Realty – Represented RMB Realty in the $705 million sale of the Helmsley Building, one of the largest office building sales in New York City history
• Barclays Global Investors – Represented Barclays Global Investors for a 15-year lease on a 321,500 sq. ft. building. This is the first new office development to break ground in San Francisco since 2000
• Brascan Real Estate – A private equity fund awarded CBRE the management of 3.2 million sq. ft. of office, industrial and retail properties located primarily in Dallas, Houston, St. Louis, and Phoenix
• UK Coal Pension Fund – Represented the UK Coal Pension Fund in the sale of a 2.2 acre parcel of prime central London real estate encompassing 200,000 sq. ft. of offices, the London College of Fashion and retail stores for $750 million
• Hilton Group, Plc – Represented Hilton Group, plc in the sale and leaseback of a portfolio of 15 hotel properties throughout the United Kingdom, valued at approximately $727 million
• Vendex – Completed the largest retail sale-leaseback transaction in The Netherlands for Vendex which included 73 retail assets, comprising approximately 5.8 million sq. ft., or 1.5% of the total stock of Dutch retail space, valued at approximately $1.7 billion
• Hewlett Packard – Represented Hewlett Packard in a lease totaling nearly 500,000 sq. ft. at Olympic Technology Park in Chennai, India
• Bank of Tokyo-Mitsubishi – Represented Bank of Tokyo-Mitsubishi in a 96,875 sq. ft. office lease at Azia Center, an office tower in Shanghai, the largest lease ever signed by a Japanese Corporation in the People’s Republic of China
18
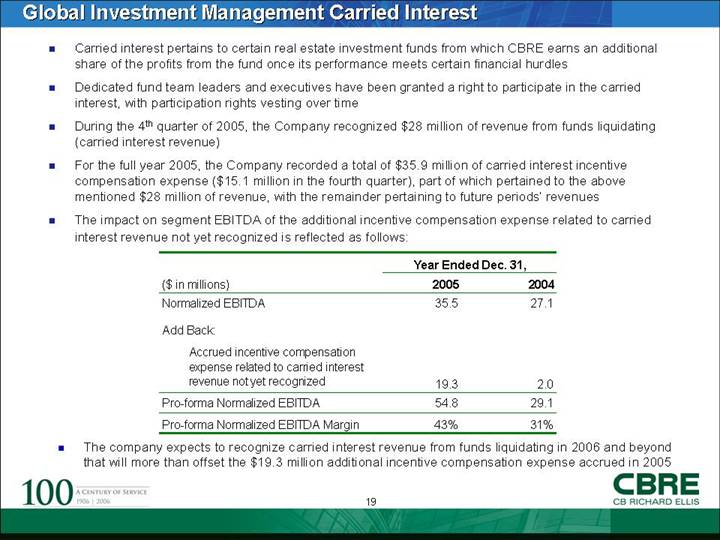
Global Investment Management Carried Interest
• Carried interest pertains to certain real estate investment funds from which CBRE earns an additional share of the profits from the fund once its performance meets certain financial hurdles
• Dedicated fund team leaders and executives have been granted a right to participate in the carried interest, with participation rights vesting over time
• During the 4th quarter of 2005, the Company recognized $28 million of revenue from funds liquidating (carried interest revenue)
• For the full year 2005, the Company recorded a total of $35.9 million of carried interest incentive compensation expense ($15.1 million in the fourth quarter), part of which pertained to the above mentioned $28 million of revenue, with the remainder pertaining to future periods’ revenues
• The impact on segment EBITDA of the additional incentive compensation expense related to carried interest revenue not yet recognized is reflected as follows:
|
|
|
Year Ended Dec. 31, |
|
||
|
($ in millions) |
|
2005 |
|
2004 |
|
|
Normalized EBITDA |
|
35.5 |
|
27.1 |
|
|
|
|
|
|
|
|
|
Add Back: |
|
|
|
|
|
|
Accrued incentive compensation expense related to carried interest revenue not yet recognized |
|
19.3 |
|
2.0 |
|
|
Pro-forma Normalized EBITDA |
|
54.8 |
|
29.1 |
|
|
Pro-forma Normalized EBITDA Margin |
|
43 |
% |
31 |
% |
• The company expects to recognize carried interest revenue from funds liquidating in 2006 and beyond that will more than offset the $19.3 million additional incentive compensation expense accrued in 2005
19
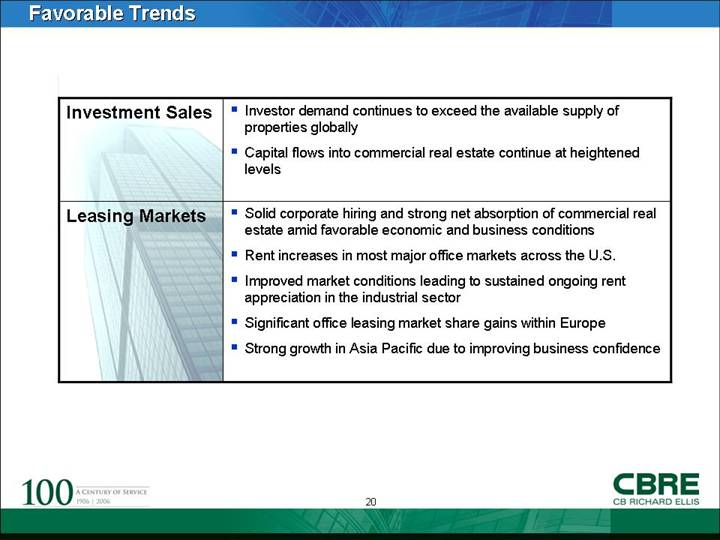
Favorable Trends
|
Investment Sales |
• |
Investor demand continues to exceed the available supply of properties globally |
|
|
|
|
|
|
• |
Capital flows into commercial real estate continue at heightened levels |
|
|
|
|
|
Leasing Markets |
• |
Solid corporate hiring and strong net absorption of commercial real estate amid favorable economic and business conditions |
|
|
|
|
|
|
• |
Rent increases in most major office markets across the U.S. |
|
|
|
|
|
|
• |
Improved market conditions leading to sustained ongoing rent appreciation in the industrial sector |
|
|
|
|
|
|
• |
Significant office leasing market share gains within Europe |
|
|
|
|
|
|
• |
Strong growth in Asia Pacific due to improving business confidence |
20
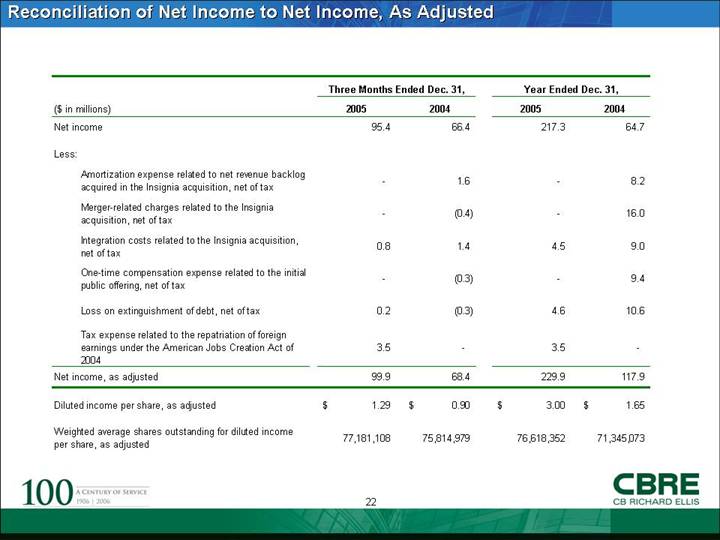
Reconciliation of Net Income to Net Income, As Adjusted
|
|
|
Three Months Ended Dec. 31, |
|
Year Ended Dec. 31, |
|
||||||||
|
($ in millions) |
|
2005 |
|
2004 |
|
2005 |
|
2004 |
|
||||
|
Net income |
|
95.4 |
|
66.4 |
|
217.3 |
|
64.7 |
|
||||
|
|
|
|
|
|
|
|
|
|
|
||||
|
Less: |
|
|
|
|
|
|
|
|
|
||||
|
|
|
|
|
|
|
|
|
|
|
||||
|
Amortization expense related to net revenue backlog acquired in the Insignia acquisition, net of tax |
|
— |
|
1.6 |
|
— |
|
8.2 |
|
||||
|
|
|
|
|
|
|
|
|
|
|
||||
|
Merger-related charges related to the Insignia acquisition, net of tax |
|
— |
|
(0.4 |
) |
— |
|
16.0 |
|
||||
|
|
|
|
|
|
|
|
|
|
|
||||
|
Integration costs related to the Insignia acquisition, net of tax |
|
0.8 |
|
1.4 |
|
4.5 |
|
9.0 |
|
||||
|
|
|
|
|
|
|
|
|
|
|
||||
|
One-time compensation expense related to the initial public offering, net of tax |
|
— |
|
(0.3 |
) |
— |
|
9.4 |
|
||||
|
|
|
|
|
|
|
|
|
|
|
||||
|
Loss on extinguishment of debt, net of tax |
|
0.2 |
|
(0.3 |
) |
4.6 |
|
10.6 |
|
||||
|
|
|
|
|
|
|
|
|
|
|
||||
|
Tax expense related to the repatriation of foreign earnings under the American Jobs Creation Act of 2004 |
|
3.5 |
|
— |
|
3.5 |
|
— |
|
||||
|
Net income, as adjusted |
|
99.9 |
|
68.4 |
|
229.9 |
|
117.9 |
|
||||
|
|
|
|
|
|
|
|
|
|
|
||||
|
Diluted income per share, as adjusted |
|
$ |
1.29 |
|
$ |
0.90 |
|
$ |
3.00 |
|
$ |
1.65 |
|
|
|
|
|
|
|
|
|
|
|
|
||||
|
Weighted average shares outstanding for diluted income per share, as adjusted |
|
77,181,108 |
|
75,814,979 |
|
76,618,352 |
|
71,345,073 |
|
||||
22
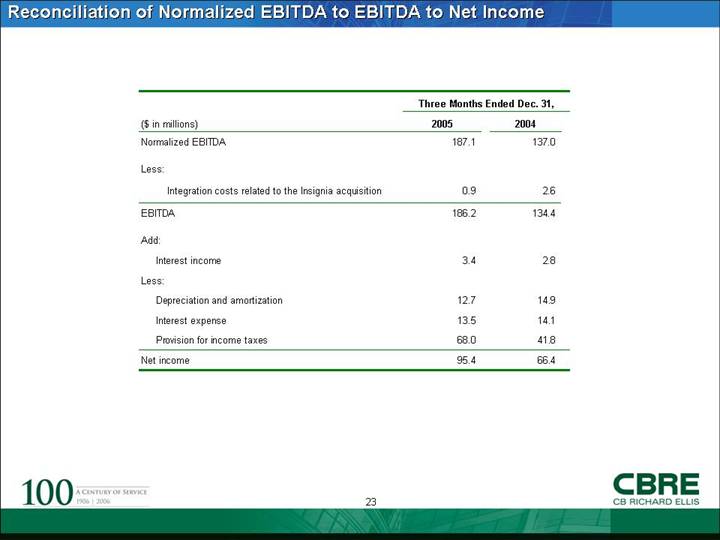
Reconciliation of Normalized EBITDA to EBITDA to Net Income
|
|
|
Three Months Ended Dec. 31, |
|
||
|
($ in millions) |
|
2005 |
|
2004 |
|
|
Normalized EBITDA |
|
187.1 |
|
137.0 |
|
|
|
|
|
|
|
|
|
Less: |
|
|
|
|
|
|
Integration costs related to the Insignia acquisition |
|
0.9 |
|
2.6 |
|
|
EBITDA |
|
186.2 |
|
134.4 |
|
|
|
|
|
|
|
|
|
Add: |
|
|
|
|
|
|
Interest income |
|
3.4 |
|
2.8 |
|
|
Less: |
|
|
|
|
|
|
Depreciation and amortization |
|
12.7 |
|
14.9 |
|
|
Interest expense |
|
13.5 |
|
14.1 |
|
|
Provision for income taxes |
|
68.0 |
|
41.8 |
|
|
Net income |
|
95.4 |
|
66.4 |
|
23
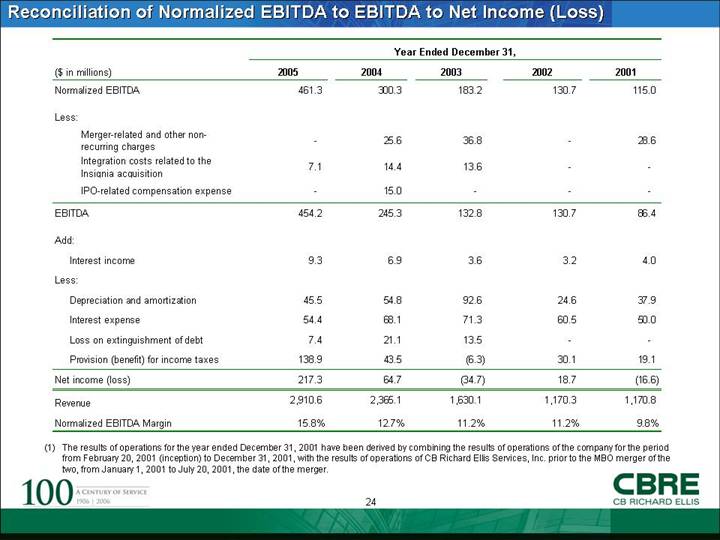
Reconciliation of Normalized EBITDA to EBITDA to Net Income (Loss)
|
|
|
Year Ended December 31, |
|
||||||||
|
($ in millions) |
|
2005 |
|
2004 |
|
2003 |
|
2002 |
|
2001 |
|
|
Normalized EBITDA |
|
461.3 |
|
300.3 |
|
183.2 |
|
130.7 |
|
115.0 |
|
|
|
|
|
|
|
|
|
|
|
|
|
|
|
Less: |
|
|
|
|
|
|
|
|
|
|
|
|
Merger-related and other non-recurring charges |
|
— |
|
25.6 |
|
36.8 |
|
— |
|
28.6 |
|
|
Integration costs related to the Insignia acquisition |
|
7.1 |
|
14.4 |
|
13.6 |
|
— |
|
— |
|
|
IPO-related compensation expense |
|
— |
|
15.0 |
|
— |
|
— |
|
— |
|
|
EBITDA |
|
454.2 |
|
245.3 |
|
132.8 |
|
130.7 |
|
86.4 |
|
|
|
|
|
|
|
|
|
|
|
|
|
|
|
Add: |
|
|
|
|
|
|
|
|
|
|
|
|
Interest income |
|
9.3 |
|
6.9 |
|
3.6 |
|
3.2 |
|
4.0 |
|
|
Less: |
|
|
|
|
|
|
|
|
|
|
|
|
Depreciation and amortization |
|
45.5 |
|
54.8 |
|
92.6 |
|
24.6 |
|
37.9 |
|
|
Interest expense |
|
54.4 |
|
68.1 |
|
71.3 |
|
60.5 |
|
50.0 |
|
|
Loss on extinguishment of debt |
|
7.4 |
|
21.1 |
|
13.5 |
|
— |
|
— |
|
|
Provision (benefit) for income taxes |
|
138.9 |
|
43.5 |
|
(6.3 |
) |
30.1 |
|
19.1 |
|
|
Net income (loss) |
|
217.3 |
|
64.7 |
|
(34.7 |
) |
18.7 |
|
(16.6 |
) |
|
Revenue |
|
2,910.6 |
|
2,365.1 |
|
1,630.1 |
|
1,170.3 |
|
1,170.8 |
|
|
Normalized EBITDA Margin |
|
15.8 |
% |
12.7 |
% |
11.2 |
% |
11.2 |
% |
9.8 |
% |
(1) The results of operations for the year ended December 31, 2001 have been derived by combining the results of operations of the company for the period from February 20, 2001 (inception) to December 31, 2001, with the results of operations of CB Richard Ellis Services, Inc. prior to the MBO merger of the two, from January 1, 2001 to July 20, 2001, the date of the merger.
24
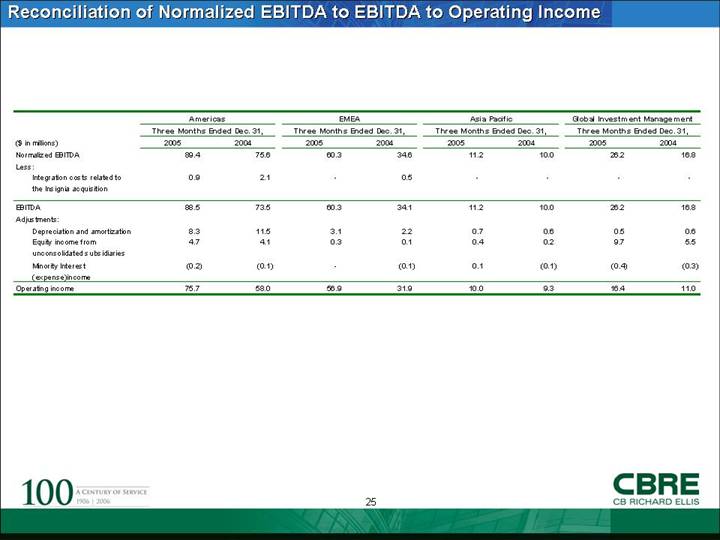
Reconciliation of Normalized EBITDA to EBITDA to Operating Income
|
|
|
Americas |
|
EMEA |
|
Asia Pacific |
|
Global Investment Management |
|
||||||||
|
|
|
Three Months Ended Dec. 31, |
|
Three Months Ended Dec. 31, |
|
Three Months Ended Dec. 31, |
|
Three Months Ended Dec. 31, |
|
||||||||
|
($ in millions) |
|
2005 |
|
2004 |
|
2005 |
|
2004 |
|
2005 |
|
2004 |
|
2005 |
|
2004 |
|
|
Normalized EBITDA |
|
89.4 |
|
75.6 |
|
60.3 |
|
34.6 |
|
11.2 |
|
10.0 |
|
26.2 |
|
16.8 |
|
|
Less: |
|
|
|
|
|
|
|
|
|
|
|
|
|
|
|
|
|
|
Integration costs related to the Insignia acquisition |
|
0.9 |
|
2.1 |
|
— |
|
0.5 |
|
— |
|
— |
|
— |
|
— |
|
|
EBITDA |
|
88.5 |
|
73.5 |
|
60.3 |
|
34.1 |
|
11.2 |
|
10.0 |
|
26.2 |
|
16.8 |
|
|
Adjustments: |
|
|
|
|
|
|
|
|
|
|
|
|
|
|
|
|
|
|
Depreciation and amortization |
|
8.3 |
|
11.5 |
|
3.1 |
|
2.2 |
|
0.7 |
|
0.6 |
|
0.5 |
|
0.6 |
|
|
Equity income from unconsolidated subsidiaries |
|
4.7 |
|
4.1 |
|
0.3 |
|
0.1 |
|
0.4 |
|
0.2 |
|
9.7 |
|
5.5 |
|
|
Minority Interest (expense)income |
|
(0.2 |
) |
(0.1 |
) |
— |
|
(0.1 |
) |
0.1 |
|
(0.1 |
) |
(0.4 |
) |
(0.3 |
) |
|
Operating income |
|
75.7 |
|
58.0 |
|
56.9 |
|
31.9 |
|
10.0 |
|
9.3 |
|
16.4 |
|
11.0 |
|
25