Exhibit 99.2

Link to searchable text of slide shown above
Searchable text section of graphics shown above
Exhibit 99.2
|
CB Richard Ellis |
[PHOTO] |
|
Third Quarter 2005 |
|
|
|
|
|
|
|
|
|
Earnings Conference Call |
|
[PHOTO] |
November 2, 2005 |
|
|
|
|
|
|
Looking Statements Forward Looking Statements
|
[GRAPHIC] |
This presentation contains statements that are forward looking within the meaning of the Private Securities Litigation Reform Act of 1995, including statements regarding our growth momentum in 2005 and 2006, future operations and future financial performance. These statements should be considered as estimates only and actual results may ultimately differ from these estimates. Except to the extent required by applicable securities laws, CB Richard Ellis Group, Inc. undertakes no obligation to update or publicly revise any of the forward-looking statements that you may hear today. Please refer to our annual report on Form 10-K and our quarterly reports on Form 10-Q, which are filed with the SEC and available at the SEC’s website (http://www.sec.gov), for a full discussion of the risks and other factors, that may impact any estimates that you may hear today. We may make certain statements during the course of this presentation which include references to “non-GAAP financial measures,” as defined by SEC regulations. As required by these regulations, we have provided reconciliations of these measures to what we believe are the most directly comparable GAAP measures, which are attached hereto within the appendix. |
1
Conference Call Participants
|
[PHOTO] |
• Brett White, President & Chief Executive Officer • Ken Kay, Senior Executive VP & Chief Financial • Rob Blain, President, Asia Pacific • Shelley Young, Director, Investor Relations |
2
Q3 2005 Summary
|
[PHOTO]
[PHOTO]
[PHOTO] |
• Record Financial Performance • Industry leader in margin expansion and market penetration • Strength of CB Richard Ellis brand and global platform
|
3
|
[PHOTO]
[PHOTO]
[PHOTO] |
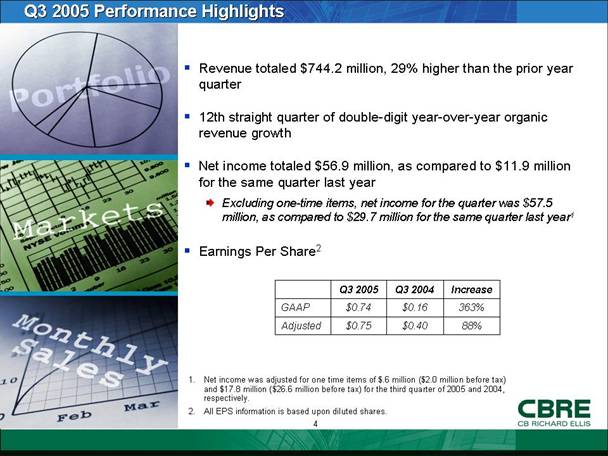
• Revenue totaled $744.2 million, 29% higher than the prior year quarter • 12th straight quarter of double-digit year-over-year organic revenue growth • Net income totaled $56.9 million, as compared to $11.9 million for the same quarter last year — Excluding one-time items, net income for the quarter was $57.5 million, as compared to $29.7 million for the same quarter last year1 • Earnings Per Share2 |
|
|
|
Q3 2005 |
|
Q3 2004 |
|
Increase |
|
|
GAAP |
|
$0.74 |
|
$0.16 |
|
363% |
|
|
Adjusted |
|
$0.75 |
|
$0.40 |
|
88% |
|
|
1. |
|
Net income was adjusted for one time items of $.6 million ($2.0 million before tax) and $17.8 million ($26.6 million before tax) for the third quarter of 2005 and 2004, respectively. |
|
2. |
|
All EPS information is based upon diluted shares. |
4
|
[PHOTO] |
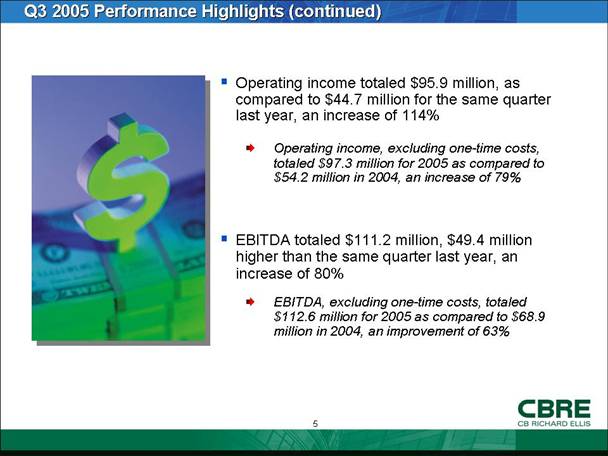
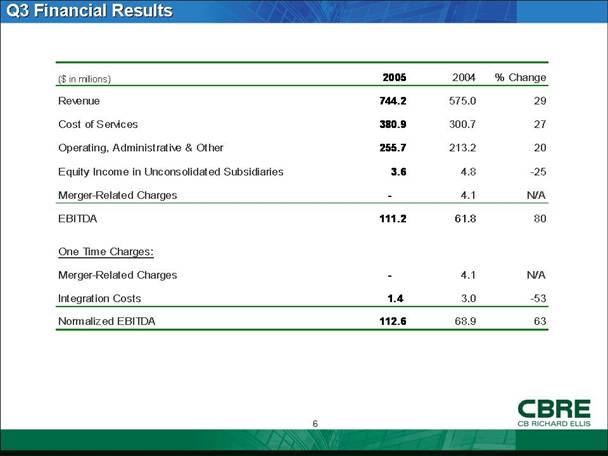
• Operating income totaled $95.9 million, as compared to $44.7 million for the same quarter last year, an increase of 114% — Operating income, excluding one-time costs, totaled $97.3 million for 2005 as compared to $54.2 million in 2004, an increase of 79%
• EBITDA totaled $111.2 million, $49.4 million higher than the same quarter last year, an increase of 80% — EBITDA, excluding one-time costs, totaled $112.6 million for 2005 as compared to $68.9 million in 2004, an improvement of 63% |
5
|
($ in millions) |
|
2005 |
|
2004 |
|
% Change |
|
|
Revenue |
|
744.2 |
|
575.0 |
|
29 |
|
|
Cost of Services |
|
380.9 |
|
300.7 |
|
27 |
|
|
Operating, Administrative & Other |
|
255.7 |
|
213.2 |
|
20 |
|
|
Equity Income in Unconsolidated Subsidiaries |
|
3.6 |
|
4.8 |
|
-25 |
|
|
Merger-Related Charges |
|
— |
|
4.1 |
|
N/A |
|
|
EBITDA |
|
111.2 |
|
61.8 |
|
80 |
|
|
|
|
|
|
|
|
|
|
|
One Time Charges: |
|
|
|
|
|
|
|
|
Merger-Related Charges |
|
— |
|
4.1 |
|
N/A |
|
|
Integration Costs |
|
1.4 |
|
3.0 |
|
-53 |
|
|
Normalized EBITDA |
|
112.6 |
|
68.9 |
|
63 |
|
6
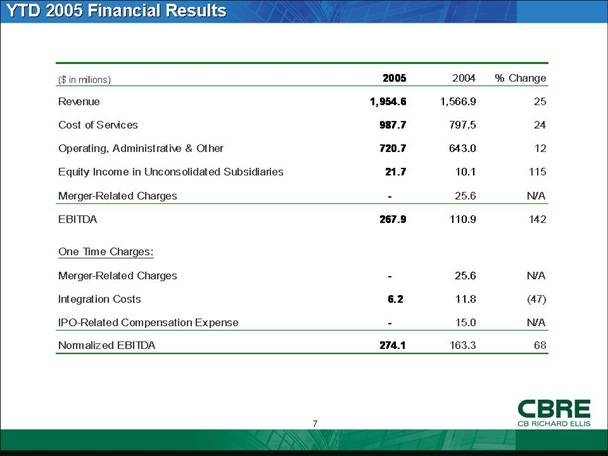
|
($ in millions) |
|
2005 |
|
2004 |
|
% Change |
|
|
Revenue |
|
1,954.6 |
|
1,566.9 |
|
25 |
|
|
Cost of Services |
|
987.7 |
|
797.5 |
|
24 |
|
|
Operating, Administrative & Other |
|
720.7 |
|
643.0 |
|
12 |
|
|
Equity Income in Unconsolidated Subsidiaries |
|
21.7 |
|
10.1 |
|
115 |
|
|
Merger-Related Charges |
|
— |
|
25.6 |
|
N/A |
|
|
EBITDA |
|
267.9 |
|
110.9 |
|
142 |
|
|
|
|
|
|
|
|
|
|
|
One Time Charges: |
|
|
|
|
|
|
|
|
Merger-Related Charges |
|
— |
|
25.6 |
|
N/A |
|
|
Integration Costs |
|
6.2 |
|
11.8 |
|
(47 |
) |
|
IPO-Related Compensation Expense |
|
— |
|
15.0 |
|
N/A |
|
|
Normalized EBITDA |
|
274.1 |
|
163.3 |
|
68 |
|
7
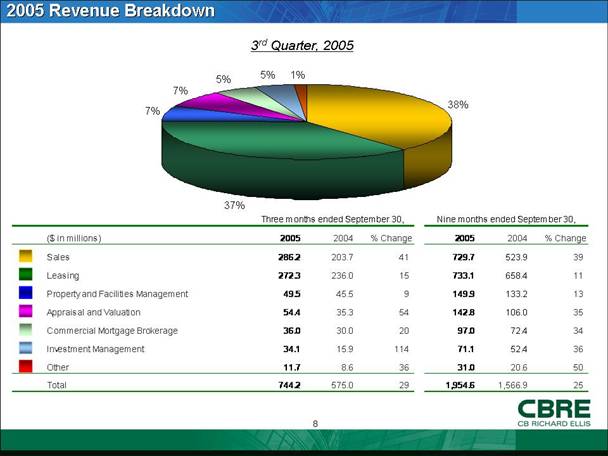
2005 Revenue Breakdown
3rd Quarter, 2005
[PIE CHART]
|
|
|
Three months ended September 30, |
|
Nine months ended September 30, |
|
||||||||
|
($ in millions) |
|
2005 |
|
2004 |
|
Change |
|
2005 |
|
2004 |
|
Change |
|
|
Sales |
|
286.2 |
|
203.7 |
|
41 |
|
729.7 |
|
523.9 |
|
39 |
|
|
Leasing |
|
272.3 |
|
236.0 |
|
15 |
|
733.1 |
|
658.4 |
|
11 |
|
|
Property and Facilities Management |
|
49.5 |
|
45.5 |
|
9 |
|
149.9 |
|
133.2 |
|
13 |
|
|
Appraisal and Valuation |
|
54.4 |
|
35.3 |
|
54 |
|
142.8 |
|
106.0 |
|
35 |
|
|
Commercial Mortgage Brokerage |
|
36.0 |
|
30.0 |
|
20 |
|
97.0 |
|
72.4 |
|
34 |
|
|
Investment Management |
|
34.1 |
|
15.9 |
|
114 |
|
71.1 |
|
52.4 |
|
36 |
|
|
Other |
|
11.7 |
|
8.6 |
|
36 |
|
31.0 |
|
20.6 |
|
50 |
|
|
Total |
|
744.2 |
|
575.0 |
|
29 |
|
1,954.6 |
|
1,566.9 |
|
25 |
|
8
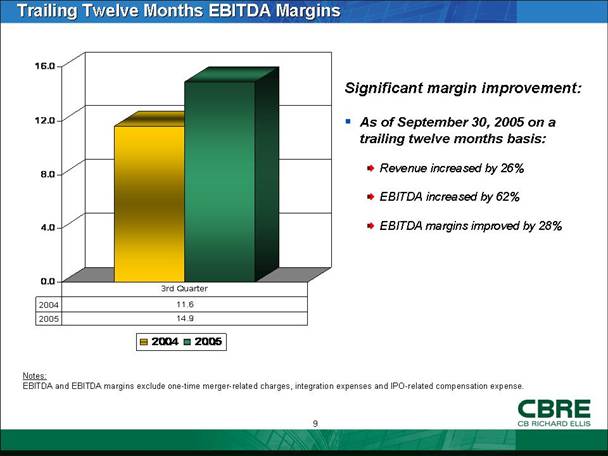
Trailing Twelve Months EBITDA Margins
|
[BAR GRAPH] |
Significant margin improvement: |
|
• As of September 30, 2005 on a trailing twelve months basis: |
|
|
– Revenue increased by 26% |
|
|
– EBITDA increased by 62% |
|
|
– EBITDA margins improved by 28% |
Notes:
EBITDA and EBITDA margins exclude one-time merger-related charges, integration expenses and IPO-related compensation expense.
9
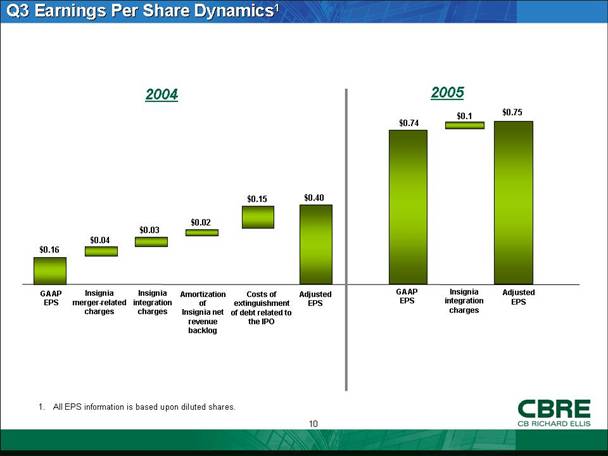
Q3 Earnings Per Share Dynamics1
|
|
|
|
2004 |
2005 |
|
|
|
|
[BAR GRAPH] |
[BAR GRAPH] |
1. All EPS information is based upon diluted shares.
10
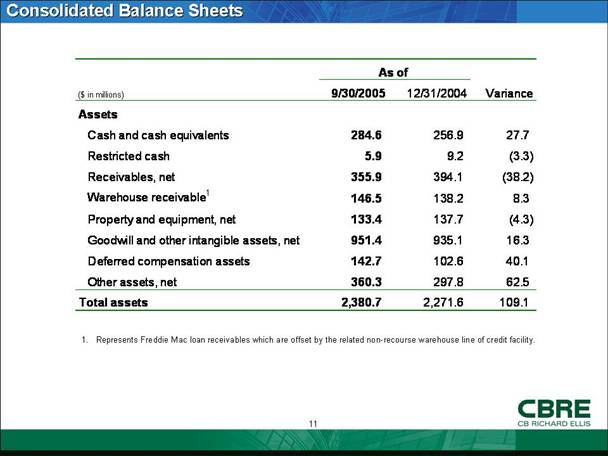
Consolidated Balance Sheets
|
|
|
As of |
|
|
|
||
|
($ in millions) |
|
9/30/2005 |
|
12/31/2004 |
|
Variance |
|
|
Assets |
|
|
|
|
|
|
|
|
Cash and cash equivalents |
|
284.6 |
|
256.9 |
|
27.7 |
|
|
Restricted cash |
|
5.9 |
|
9.2 |
|
(3.3 |
) |
|
Receivables, net |
|
355.9 |
|
394.1 |
|
(38.2 |
) |
|
Warehouse receivable1 |
|
146.5 |
|
138.2 |
|
8.3 |
|
|
Property and equipment, net |
|
133.4 |
|
137.7 |
|
(4.3 |
) |
|
Goodwill and other intangible assets, net |
|
951.4 |
|
935.1 |
|
16.3 |
|
|
Deferred compensation assets |
|
142.7 |
|
102.6 |
|
40.1 |
|
|
Other assets, net |
|
360.3 |
|
297.8 |
|
62.5 |
|
|
Total assets |
|
2,380.7 |
|
2,271.6 |
|
109.1 |
|
1. Represents Freddie Mac loan receivables which are offset by the related non-recourse warehouse line of credit facility.
11
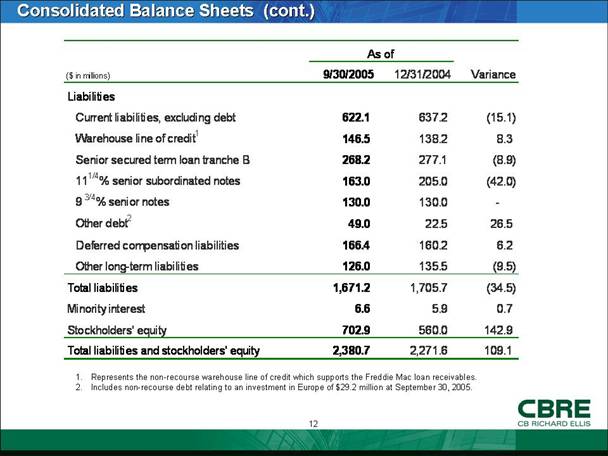
Consolidated Balance Sheets (cont.)
|
|
|
As of |
|
|
|
||
|
($ in millions) |
|
9/30/2005 |
|
12/31/2004 |
|
Variance |
|
|
Liabilities |
|
|
|
|
|
|
|
|
Current liabilities, excluding debt |
|
622.1 |
|
637.2 |
|
(15.1 |
) |
|
Warehouse line of credit1 |
|
146.5 |
|
138.2 |
|
8.3 |
|
|
Senior secured term loan tranche B |
|
268.2 |
|
277.1 |
|
(8.9 |
) |
|
111/4% senior subordinated notes |
|
163.0 |
|
205.0 |
|
(42.0 |
) |
|
9 3/4% senior notes |
|
130.0 |
|
130.0 |
|
- |
|
|
Other debt2 |
|
49.0 |
|
22.5 |
|
26.5 |
|
|
Deferred compensation liabilities |
|
166.4 |
|
160.2 |
|
6.2 |
|
|
Other long-term liabilities |
|
126.0 |
|
135.5 |
|
(9.5 |
) |
|
Total liabilities |
|
1,671.2 |
|
1,705.7 |
|
(34.5 |
) |
|
Minority interest |
|
6.6 |
|
5.9 |
|
0.7 |
|
|
Stockholders’ equity |
|
702.9 |
|
560.0 |
|
142.9 |
|
|
Total liabilities and stockholders’ equity |
|
2,380.7 |
|
2,271.6 |
|
109.1 |
|
1. Represents the non-recourse warehouse line of credit which supports the Freddie Mac loan receivables.
2. Includes non-recourse debt relating to an investment in Europe of $29.2 million at September 30, 2005.
12
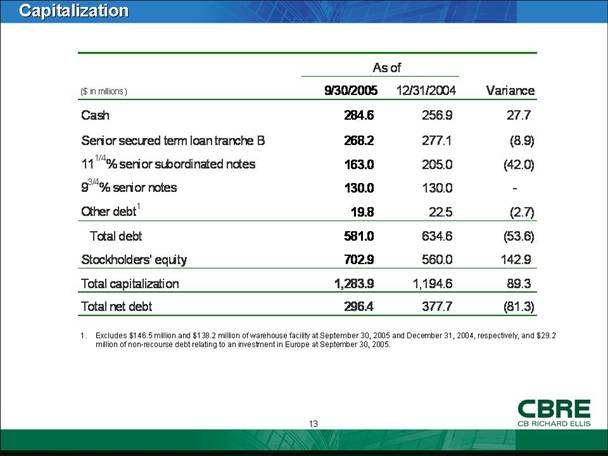
Capitalization
|
|
|
As of |
|
|
|
||
|
($ in millions) |
|
9/30/2005 |
|
12/31/2004 |
|
Variance |
|
|
Cash |
|
284.6 |
|
256.9 |
|
27.7 |
|
|
Senior secured term loan tranche B |
|
268.2 |
|
277.1 |
|
(8.9 |
) |
|
111/4% senior subordinated notes |
|
163.0 |
|
205.0 |
|
(42.0 |
) |
|
93/4% senior notes |
|
130.0 |
|
130.0 |
|
— |
|
|
Other debt1 |
|
19.8 |
|
22.5 |
|
(2.7 |
) |
|
Total debt |
|
581.0 |
|
634.6 |
|
(53.6 |
) |
|
Stockholders’ equity |
|
702.9 |
|
560.0 |
|
142.9 |
|
|
Total capitalization |
|
1,283.9 |
|
1,194.6 |
|
89.3 |
|
|
Total net debt |
|
296.4 |
|
377.7 |
|
(81.3 |
) |
1. Excludes $146.5 million and $138.2 million of warehouse facility at September 30, 2005 and December 31, 2004, respectively, and $29.2 million of non-recourse debt relating to an investment in Europe at September 30, 2005.
13
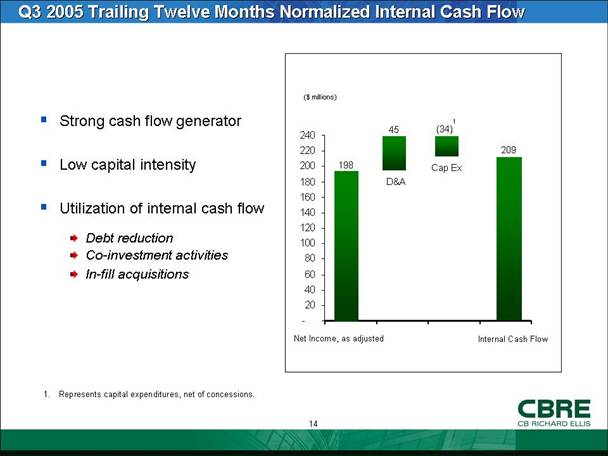
Q3 2005 Trailing Twelve Months Normalized Internal Cash Flow
|
• Strong cash flow generator |
[BAR GRAPH] |
|
|
|
|
• Low capital intensity |
|
|
|
|
|
• Utilization of internal cash flow |
|
|
|
|
|
– Debt reduction |
|
|
– Co-investment activities |
|
|
– In-fill acquisitions |
1. Represents capital expenditures, net of concessions.
14
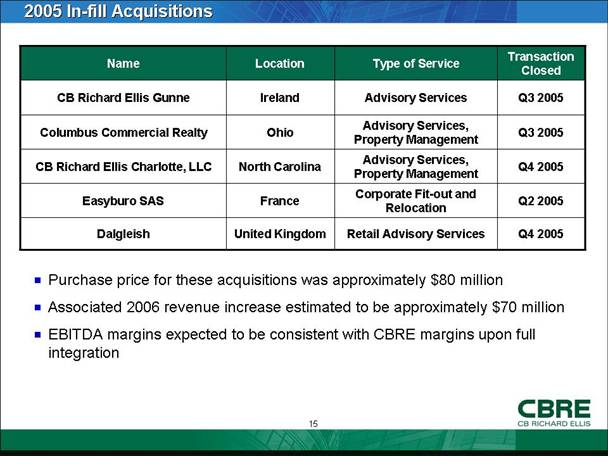
2005 In-fill Acquisitions
|
Name |
|
Location |
|
Type of Service |
|
Transaction Closed |
|
CB Richard Ellis Gunne |
|
Ireland |
|
Advisory Services |
|
Q3 2005 |
|
Columbus Commercial Realty |
|
Ohio |
|
Advisory Services, Property Management |
|
Q3 2005 |
|
CB Richard Ellis Charlotte, LLC |
|
North Carolina |
|
Advisory Services, Property Management |
|
Q4 2005 |
|
Easyburo SAS |
|
France |
|
Corporate Fit-out and Relocation |
|
Q2 2005 |
|
Dalgleish |
|
United Kingdom |
|
Retail Advisory Services |
|
Q4 2005 |
• Purchase price for these acquisitions was approximately $80 million
• Associated 2006 revenue increase estimated to be approximately $70 million
• EBITDA margins expected to be consistent with CBRE margins upon full integration
15
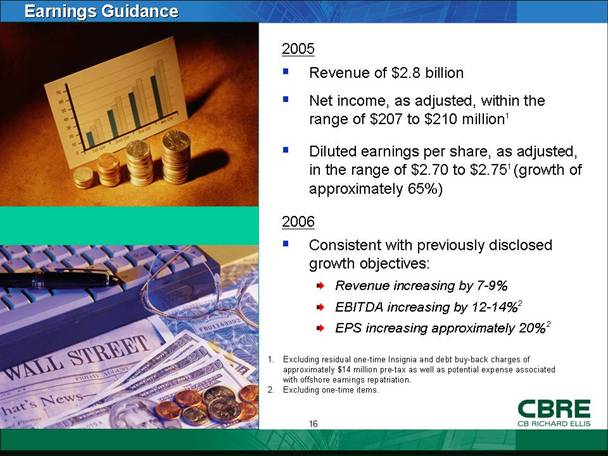
Earnings Guidance
|
[PHOTO]
[PHOTO] |
2005 • Revenue of $2.8 billion • Net income, as adjusted, within the range of $207 to $210 million1 • Diluted earnings per share, as adjusted, in the range of $2.70 to $2.751 (growth of approximately 65%) 2006 • Consistent with previously disclosed growth objectives: – Revenue increasing by 7-9% – EBITDA increasing by 12-14%2 – EPS increasing approximately 20%2
|
1. Excluding residual one-time Insignia and debt buy-back charges of approximately $14 million pre-tax as well as potential expense associated with offshore earnings repatriation.
2. Excluding one-time items.
16
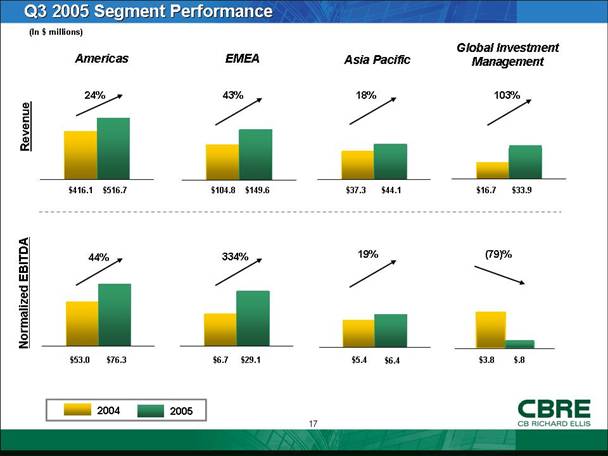
Q3 2005 Segment Performance
(In $ millions)
|
Americas |
EMEA |
Asia Pacific |
Global Investment Management |
|
|
|
|
|
|
[BAR GRAPH] |
[BAR GRAPH] |
[BAR GRAPH] |
[BAR GRAPH] |
|
|
|
|
|
|
|
|
|
|
|
[BAR GRAPH] |
[BAR GRAPH] |
[BAR GRAPH] |
[BAR GRAPH] |
17
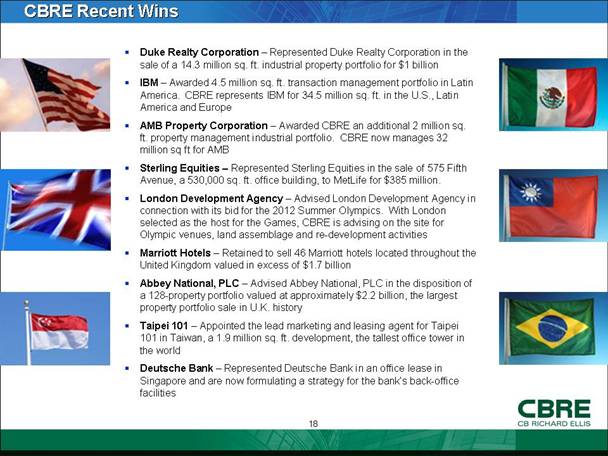
CBRE Recent Wins
|
|
• |
Duke Realty Corporation — Represented Duke Realty Corporation in the sale of a 14.3 million sq. ft. industrial property portfolio for $1 billion |
|
|
[PHOTO] |
• |
IBM — Awarded 4.5 million sq. ft. transaction management portfolio in Latin America. CBRE represents IBM for 34.5 million sq. ft. in the U.S., Latin America and Europe |
[PHOTO] |
|
|
• |
AMB Property Corporation — Awarded CBRE an additional 2 million sq. ft. property management industrial portfolio. CBRE now manages 32 million sq ft for AMB |
|
|
|
• |
Sterling Equities — Represented Sterling Equities in the sale of 575 Fifth Avenue, a 530,000 sq. ft. office building, to MetLife for $385 million. |
|
|
[PHOTO] |
• |
London Development Agency — Advised London Development Agency in connection with its bid for the 2012 Summer Olympics. With London selected as the host for the Games, CBRE is advising on the site for Olympic venues, land assemblage and re-development activities |
[PHOTO] |
|
|
• |
Marriott Hotels — Retained to sell 46 Marriott hotels located throughout the United Kingdom valued in excess of $1.7 billion |
|
|
|
• |
Abbey National, PLC — Advised Abbey National, PLC in the disposition of a 128-property portfolio valued at approximately $2.2 billion, the largest property portfolio sale in U.K. history |
|
|
[PHOTO] |
• |
Taipei 101 — Appointed the lead marketing and leasing agent for Taipei 101 in Taiwan, a 1.9 million sq. ft. development, the tallest office tower in the world |
[PHOTO] |
|
|
• |
Deutsche Bank — Represented Deutsche Bank in an office lease in Singapore and are now formulating a strategy for the bank’s back-office facilities |
|
18
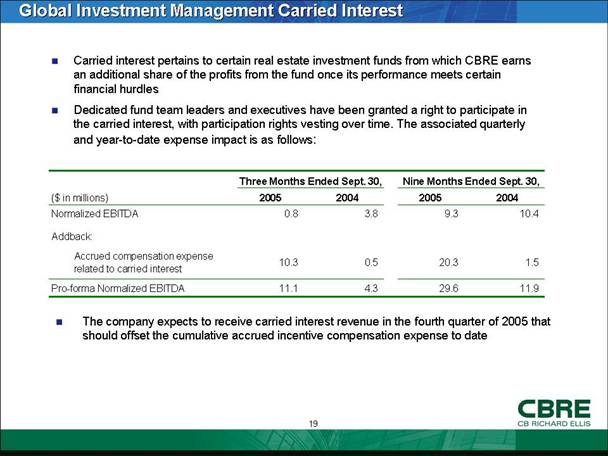
Global Investment Management Carried Interest
• Carried interest pertains to certain real estate investment funds from which CBRE earns an additional share of the profits from the fund once its performance meets certain financial hurdles
• Dedicated fund team leaders and executives have been granted a right to participate in the carried interest, with participation rights vesting over time. The associated quarterly and year-to-date expense impact is as follows:
|
|
|
Three Months Ended Sept. 30, |
|
Nine Months Ended Sept. 30, |
|
||||
|
($ in millions) |
|
2005 |
|
2004 |
|
2005 |
|
2004 |
|
|
Normalized EBITDA |
|
0.8 |
|
3.8 |
|
9.3 |
|
10.4 |
|
|
|
|
|
|
|
|
|
|
|
|
|
Addback: |
|
|
|
|
|
|
|
|
|
|
Accrued compensation expense related to carried interest |
|
10.3 |
|
0.5 |
|
20.3 |
|
1.5 |
|
|
Pro-forma Normalized EBITDA |
|
11.1 |
|
4.3 |
|
29.6 |
|
11.9 |
|
• The company expects to receive carried interest revenue in the fourth quarter of 2005 that should offset the cumulative accrued incentive compensation expense to date
19
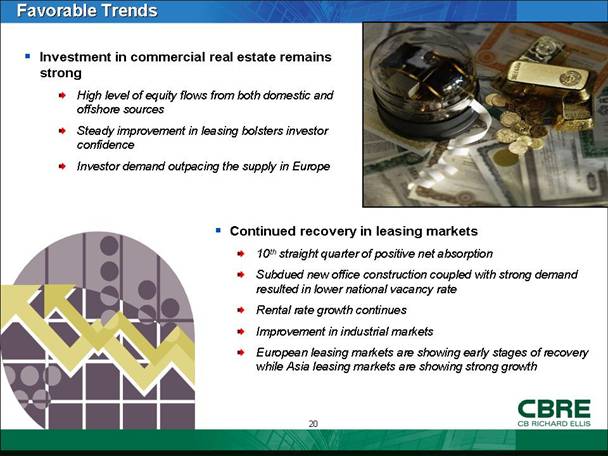
Favorable Trends
|
• Investment in commercial real estate remains strong – High level of equity flows from both domestic and offshore sources – Steady improvement in leasing bolsters investor confidence – Investor demand outpacing the supply in Europe |
[PHOTO] |
|
[PHOTO]
|
• Continued recovery in leasing markets – 10th straight quarter of positive net absorption – Subdued new office construction coupled with strong demand resulted in lower national vacancy rate – Rental rate growth continues – Improvement in industrial markets – European leasing markets are showing early stages of recovery while Asia leasing markets are showing strong growth – Increased cross border investment activity |
20
Reconciliation of Net Income to Net Income, As Adjusted
|
|
|
Three Months Ended September 30, |
|
||||
|
($ in millions, except share data) |
|
2005 |
|
2004 |
|
||
|
Net income |
|
56.9 |
|
11.9 |
|
||
|
Amortization related to net revenue backlog acquired in the Insignia acquisition, net of tax |
|
— |
|
1.7 |
|
||
|
Merger-related charges related to the Insignia acquisition, net of tax |
|
— |
|
2.9 |
|
||
|
Integration costs related to the Insignia acquisition, net of tax |
|
0.6 |
|
2.0 |
|
||
|
One-time compensation expense related to the IPO, net of tax |
|
— |
|
0.2 |
|
||
|
Loss on extinguishment of debt, net of tax |
|
— |
|
11.0 |
|
||
|
Net income, as adjusted |
|
57.5 |
|
29.7 |
|
||
|
|
|
|
|
|
|
||
|
Diluted income per share, as adjusted |
|
$ |
0.75 |
|
$ |
0.40 |
|
|
|
|
|
|
|
|
||
|
Weighted average shares outstanding for diluted income per share, as adjusted |
|
76,777,271 |
|
75,184,418 |
|
||
22
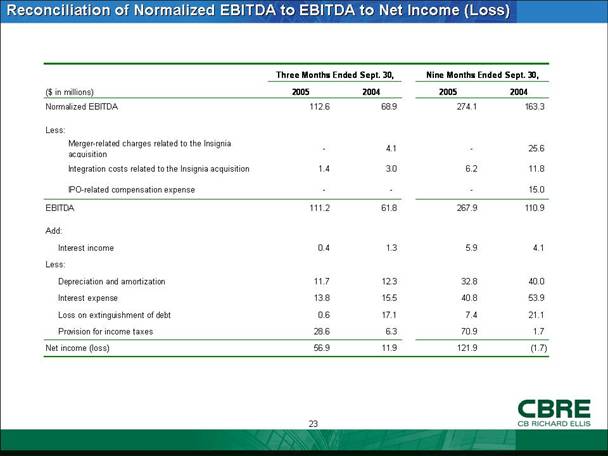
Reconciliation of Normalized EBITDA to EBITDA to Net Income (Loss)
|
|
|
Three Months Ended Sept. 30, |
|
Nine Months Ended Sept. 30, |
|
||||
|
($ in millions) |
|
2005 |
|
2004 |
|
2005 |
|
2004 |
|
|
Normalized EBITDA |
|
112.6 |
|
68.9 |
|
274.1 |
|
163.3 |
|
|
|
|
|
|
|
|
|
|
|
|
|
Less: |
|
|
|
|
|
|
|
|
|
|
Merger-related charges related to the Insignia acquisition |
|
— |
|
4.1 |
|
— |
|
25.6 |
|
|
Integration costs related to the Insignia acquisition |
|
1.4 |
|
3.0 |
|
6.2 |
|
11.8 |
|
|
IPO-related compensation expense |
|
— |
|
— |
|
— |
|
15.0 |
|
|
EBITDA |
|
111.2 |
|
61.8 |
|
267.9 |
|
110.9 |
|
|
|
|
|
|
|
|
|
|
|
|
|
Add: |
|
|
|
|
|
|
|
|
|
|
Interest income |
|
0.4 |
|
1.3 |
|
5.9 |
|
4.1 |
|
|
Less: |
|
|
|
|
|
|
|
|
|
|
Depreciation and amortization |
|
11.7 |
|
12.3 |
|
32.8 |
|
40.0 |
|
|
Interest expense |
|
13.8 |
|
15.5 |
|
40.8 |
|
53.9 |
|
|
Loss on extinguishment of debt |
|
0.6 |
|
17.1 |
|
7.4 |
|
21.1 |
|
|
Provision for income taxes |
|
28.6 |
|
6.3 |
|
70.9 |
|
1.7 |
|
|
Net income (loss) |
|
56.9 |
|
11.9 |
|
121.9 |
|
(1.7 |
) |
23
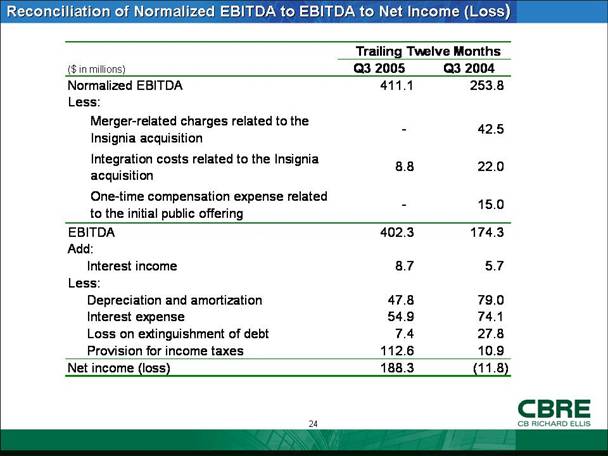
Reconciliation of Normalized EBITDA to EBITDA to Net Income (Loss)
|
|
|
Trailing Twelve Months |
|
||
|
($ in millions) |
|
Q3 2005 |
|
Q3 2004 |
|
|
Normalized EBITDA |
|
411.1 |
|
253.8 |
|
|
Less: |
|
|
|
|
|
|
Merger-related charges related to the Insignia acquisition |
|
— |
|
42.5 |
|
|
Integration costs related to the Insignia acquisition |
|
8.8 |
|
22.0 |
|
|
One-time compensation expense related to the initial public offering |
|
— |
|
15.0 |
|
|
EBITDA |
|
402.3 |
|
174.3 |
|
|
Add: |
|
|
|
|
|
|
Interest income |
|
8.7 |
|
5.7 |
|
|
Less: |
|
|
|
|
|
|
Depreciation and amortization |
|
47.8 |
|
79.0 |
|
|
Interest expense |
|
54.9 |
|
74.1 |
|
|
Loss on extinguishment of debt |
|
7.4 |
|
27.8 |
|
|
Provision for income taxes |
|
112.6 |
|
10.9 |
|
|
Net income (loss) |
|
188.3 |
|
(11.8 |
) |
24
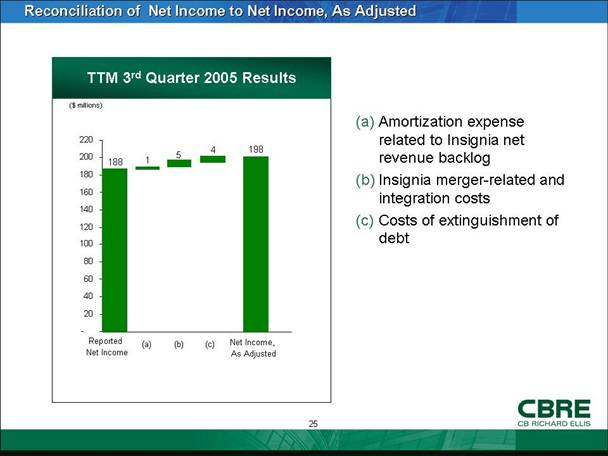
Reconciliation of Net Income to Net Income, As Adjusted
|
|
|
(a) |
Amortization expense related to Insignia net revenue backlog |
|
[BAR GRAPH] |
|
(b) |
Insignia merger-related and integration costs |
|
|
|
(c) |
Costs of extinguishment of debt |
25
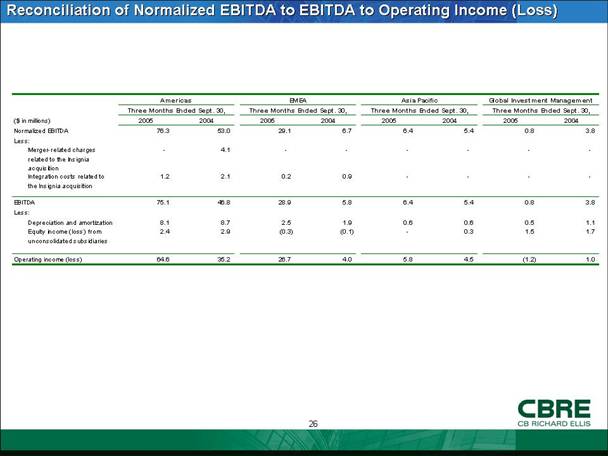
Reconciliation of Normalized EBITDA to EBITDA to Operating Income (Loss)
|
|
|
Americas |
|
EMEA |
|
Asia Pacific |
|
Global Investment Management |
|
||||||||
|
|
|
Three Months Ended |
|
Three Months Ended |
|
Three Months Ended |
|
Three Months Ended |
|
||||||||
|
($ in millions) |
|
2005 |
|
2004 |
|
2005 |
|
2004 |
|
2005 |
|
2004 |
|
2005 |
|
2004 |
|
|
Normalized EBITDA |
|
76.3 |
|
53.0 |
|
29.1 |
|
6.7 |
|
6.4 |
|
5.4 |
|
0.8 |
|
3.8 |
|
|
Less: |
|
|
|
|
|
|
|
|
|
|
|
|
|
|
|
|
|
|
Merger-related charges related to the Insignia acquisition |
|
— |
|
4.1 |
|
— |
|
— |
|
— |
|
— |
|
— |
|
— |
|
|
Integration costs related to the Insignia acquisition |
|
1.2 |
|
2.1 |
|
0.2 |
|
0.9 |
|
— |
|
— |
|
— |
|
— |
|
|
EBITDA |
|
75.1 |
|
46.8 |
|
28.9 |
|
5.8 |
|
6.4 |
|
5.4 |
|
0.8 |
|
3.8 |
|
|
Less: |
|
|
|
|
|
|
|
|
|
|
|
|
|
|
|
|
|
|
Depreciation and amortization |
|
8.1 |
|
8.7 |
|
2.5 |
|
1.9 |
|
0.6 |
|
0.6 |
|
0.5 |
|
1.1 |
|
|
Equity income (loss) from unconsolidated subsidiaries |
|
2.4 |
|
2.9 |
|
(0.3 |
) |
(0.1 |
) |
— |
|
0.3 |
|
1.5 |
|
1.7 |
|
|
Operating income (loss) |
|
64.6 |
|
35.2 |
|
26.7 |
|
4.0 |
|
5.8 |
|
4.5 |
|
(1.2 |
) |
1.0 |
|
26