Exhibit 99

Link to searchable text of slide shown above
Link to searchable text of slide shown above

Link to searchable text of slide shown above

Link to searchable text of slide shown above
Link to searchable text of slide shown above

Link to searchable text of slide shown above
Link to searchable text of slide shown above
Link to searchable text of slide shown above
Link to searchable text of slide shown above
Link to searchable text of slide shown above
Link to searchable text of slide shown above
Link to searchable text of slide shown above
Link to searchable text of slide shown above
Link to searchable text of slide shown above
Link to searchable text of slide shown above

Link to searchable text of slide shown above
Link to searchable text of slide shown above
Link to searchable text of slide shown above
Link to searchable text of slide shown above
Link to searchable text of slide shown above

Link to searchable text of slide shown above
Link to searchable text of slide shown above
Link to searchable text of slide shown above
Link to searchable text of slide shown above
Link to searchable text of slide shown above
Link to searchable text of slide shown above
Link to searchable text of slide shown above
Link to searchable text of slide shown above
Link to searchable text of slide shown above
Link to searchable text of slide shown above

Link to searchable text of slide shown above
Link to searchable text of slide shown above
Link to searchable text of slide shown above
Link to searchable text of slide shown above
Link to searchable text of slide shown above

Link to searchable text of slide shown above
Searchable text section of graphics shown above
[LOGO]
May 2005
Investor Presentation
|
Forward Looking Statements |
|
[LOGO] |
This presentation contains statements that are forward looking within the meaning of the Private Securities Litigation Reform Act of 1995. These statements should be considered as estimates only and actual results may ultimately differ from these estimates. Except to the extent required by applicable securities laws, CB Richard Ellis Group, Inc. undertakes no obligation to update or publicly revise any of the forward-looking statements that you may hear today. Please refer to our annual report on Form 10-K and our quarterly reports on Form 10-Q, which are filed with the SEC and available at the SEC’s Web site (http://www.sec.gov), for a full discussion of the risks and other factors, that may impact any estimates that you may hear today. We may make certain statements during the course of this presentation which include references to “non-GAAP financial measures,” as defined by SEC regulations. As required by these regulations, we have provided reconciliations of these measures to what we believe are the most directly comparable GAAP measures, which are attached hereto within the appendix.
1
Participants
Brett White – President
Ken Kay – Senior Executive Vice President and Chief Financial Officer
2
Overview
3
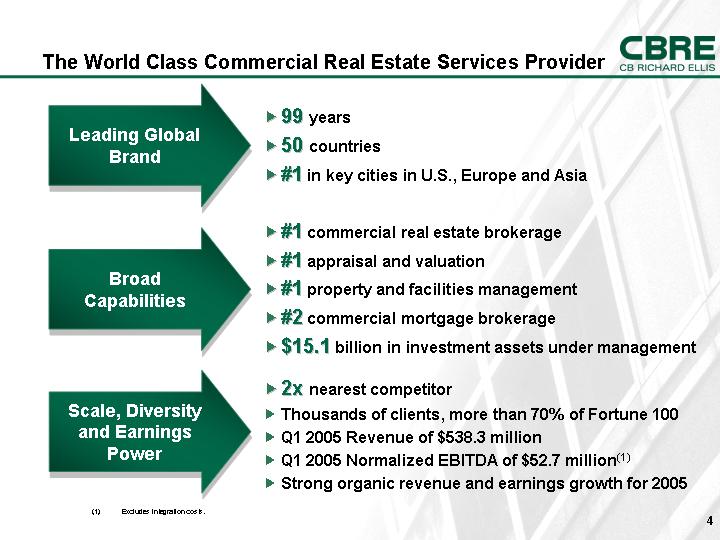
The World Class Commercial Real Estate Services Provider
|
Leading Global |
|
• 99 years |
|
|
• 50 countries |
|
|
|
• #1 in key cities in U.S., Europe and Asia |
|
|
|
|
|
|
Broad |
|
• #1 commercial real estate brokerage |
|
|
• #1 appraisal and valuation |
|
|
|
• #1 property and facilities management |
|
|
|
• #2 commercial mortgage brokerage |
|
|
|
• $15.1 billion in investment assets under management |
|
|
|
|
|
|
Scale, Diversity |
|
• 2x nearest competitor |
|
|
• Thousands of clients, more than 70% of Fortune 100 |
|
|
|
• Q1 2005 Revenue of $538.3 million |
|
|
|
• Q1 2005 Normalized EBITDA of $52.7 million(1) |
|
|
|
• Strong organic revenue and earnings growth for 2005 |
(1) Excludes integration costs.
4
Global Reach & Local Leadership
|
2004 Revenue by Region |
|
Leading |
|
|
|
|
|
|
|
[CHART] |
|
New York |
ý |
|
|
|
|
|
|
|
London |
ý |
|
|
|
|
|
|
|
|
Los Angeles |
ý |
|
|
|
|
|
|
|
|
Chicago |
ý |
|
|
|
|
|
|
|
|
Sydney |
ý |
|
|
|
|
|
|
|
|
Paris |
ý |
|
|
|
|
|
|
|
|
Washington, D.C. |
ý |
|
|
|
|
|
|
|
|
Madrid |
ý |
|
|
|
|
|
|
|
|
Singapore |
ý |
|
CBRE is unique in offering customers global coverage and leading local expertise.
5
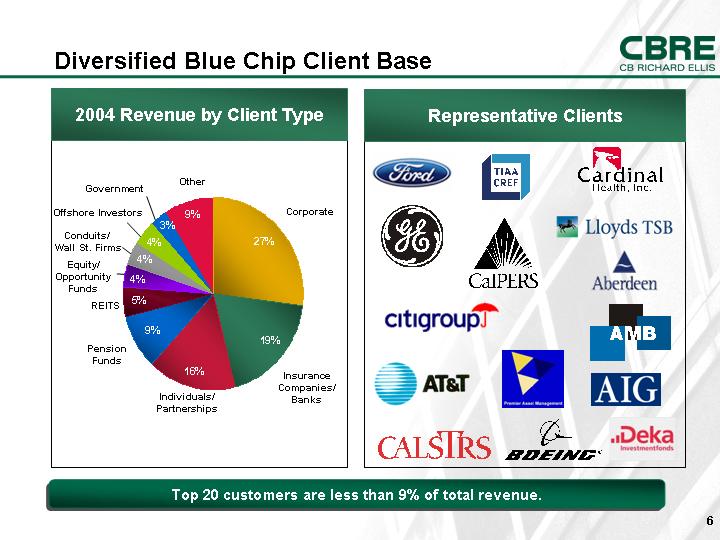
Diversified Blue Chip Client Base
|
2004 Revenue by Client Type |
|
Representative Clients |
|
|
|
|
|
|
|
[CHART] |
|
[LOGO] |
|
Top 20 customers are less than 9% of total revenue.
6
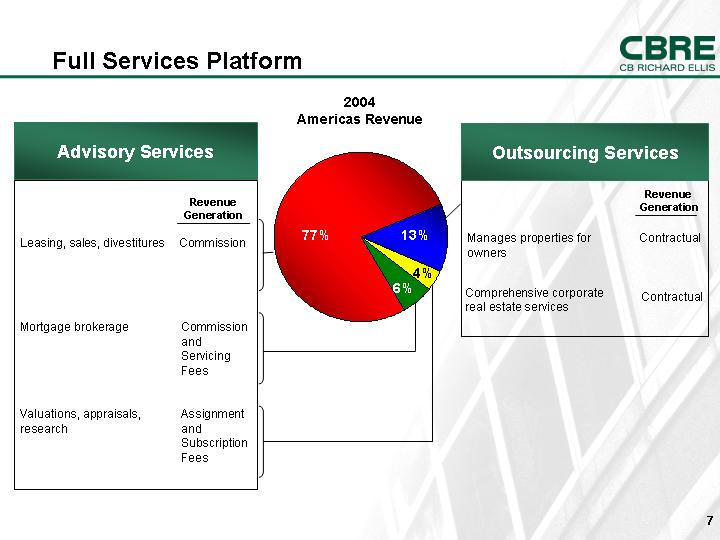
Full Services Platform
2004
Americas Revenue
|
Advisory Services |
|
Outsourcing Services |
||
|
|
[CHART] |
|
|
|
|
|
Revenue |
|
|
Revenue |
|
|
|
|
|
|
|
Leasing, sales, divestitures |
Commission |
Manages properties for owners |
Contractual |
|
|
|
|
|
|
|
|
|
|
Comprehensive corporate real estate services |
Contractual |
|
|
|
|
|
|
|
|
Mortgage brokerage |
Commission and Servicing Fees |
|
|
|
|
|
|
|
|
|
|
Valuations, appraisals, research |
Assignment and Subscription Fees |
|
|
|
7
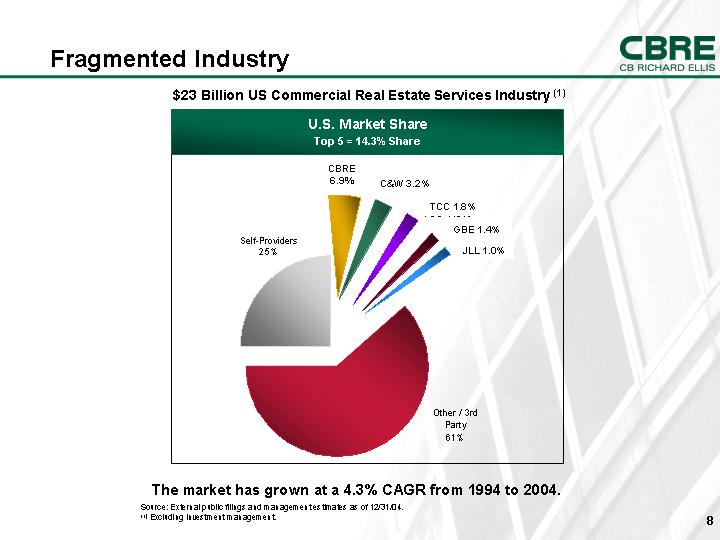
Fragmented Industry
$23 Billion US Commercial Real Estate Services Industry (1)
U.S. Market Share
Top 5 = 14.3% Share
[CHART]
The market has grown at a 4.3% CAGR from 1994 to 2004.
Source: External public filings and management estimates as of 12/31/04.
(1) Excluding investment management.
8
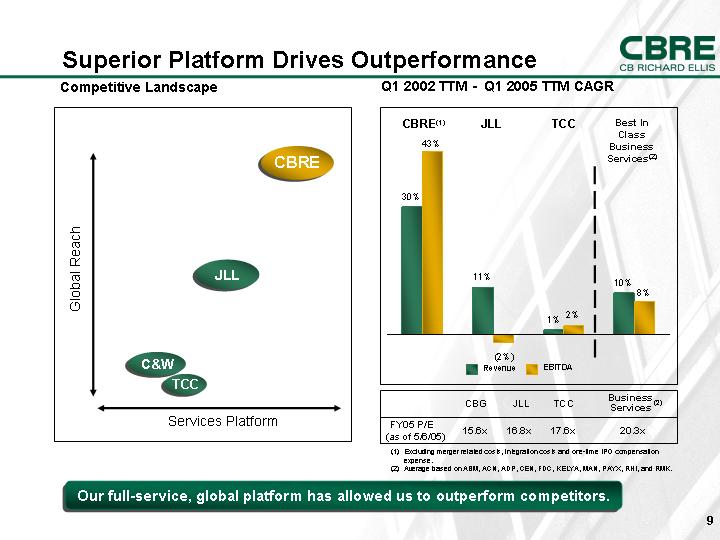
Superior Platform Drives Outperformance
Competitive Landscape
[CHART]
Q1 2002 TTM - - Q1 2005 TTM CAGR
[CHART]
|
|
|
CBG |
|
JLL |
|
TCC |
|
Business |
|
|
FY05 P/E |
|
15.6 |
x |
16.8 |
x |
17.6 |
x |
20.3 |
x |
(1) Excluding merger related costs, integration costs and one-time IPO compensation expense.
(2) Average based on ABM, ACN, ADP, CEN, FDC, KELYA, MAN, PAYX, RHI, and RMK.
Our full-service, global platform has allowed us to outperform competitors.
9
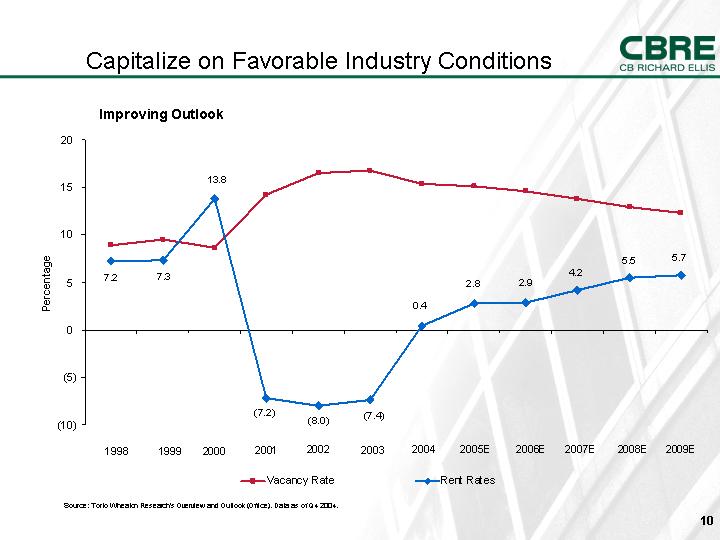
Capitalize on Favorable Industry Conditions
Improving Outlook
[CHART]
Source: Torto Wheaton Research’s Overview and Outlook (Office). Data as of Q4 2004.
10
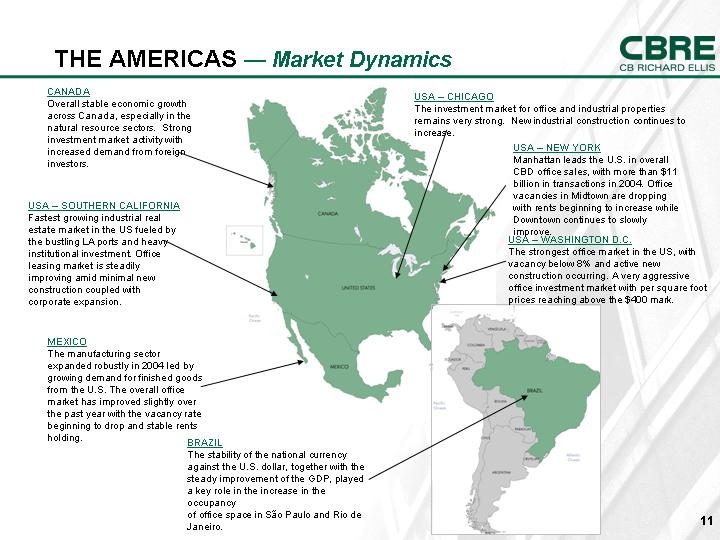
THE AMERICAS — Market Dynamics
|
CANADA |
|
|
|
USA – CHICAGO |
|
|
Overall stable economic growth across Canada, especially in the natural resource sectors. Strong investment market activity with increased demand from foreign investors. |
|
|
|
The investment market for office and industrial properties remains very strong. New industrial construction continues to increase. |
|
|
|
|
|
|
|
|
|
USA – SOUTHERN CALIFORNIA |
|
|
|
USA – NEW YORK |
|
|
Fastest growing industrial real estate market in the US fueled by the bustling LA ports and heavy institutional investment. Office leasing market is steadily improving amid minimal new construction coupled with corporate expansion. |
|
[GRAPHIC] |
|
Manhattan leads the U.S. in overall CBD office sales, with more than $11 billion in transactions in 2004. Office vacancies in Midtown are dropping with rents beginning to increase while Downtown continues to slowly improve. |
|
|
|
|
|
|
|
|
|
MEXICO |
|
|
|
USA – WASHINGTON D.C. |
|
|
The manufacturing sector expanded robustly in 2004 led by growing demand for finished goods from the U.S. The overall office market has improved slightly over the past year with the vacancy rate beginning to drop and stable rents holding. |
|
|
|
The strongest office market in the US, with vacancy below 8% and active new construction occurring. A very aggressive office investment market with per square foot prices reaching above the $400 mark. |
|
|
|
|
|
|
|
|
|
|
|
BRAZIL |
|
|
|
|
|
|
The stability of the national currency against the U.S. dollar, together with the steady improvement of the GDP, played a key role in the increase in the occupancy of office space in São Paulo and Rio de Janeiro. |
|
|
|
11
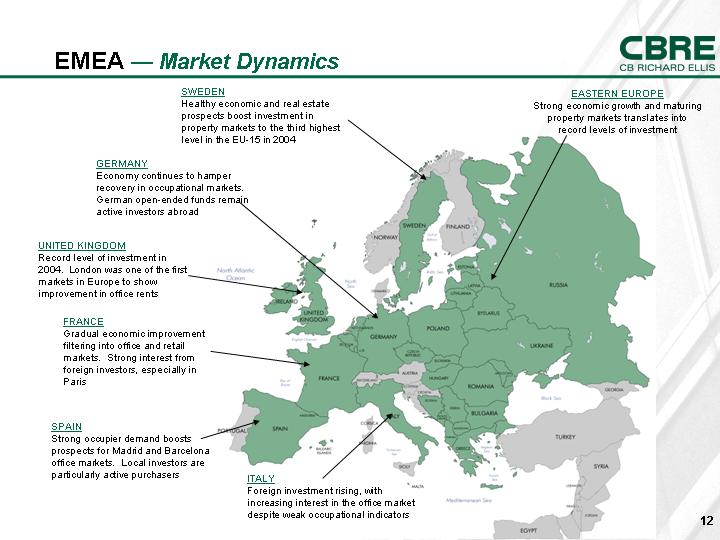
EMEA — Market Dynamics
|
SWEDEN |
|
|
|
EASTERN EUROPE |
|
|
Healthy economic and real estate prospects boost investment in property markets to the third highest level in the EU-15 in 2004 |
|
|
|
Strong economic growth and maturing property markets translates into record levels of investment |
|
|
|
|
|
|
|
|
|
GERMANY |
|
|
|
|
|
|
Economy continues to hamper recovery in occupational markets. German open-ended funds remain active investors abroad |
|
|
|
|
|
|
|
|
|
|
|
|
|
UNITED KINGDOM |
|
|
|
|
|
|
Record level of investment in 2004. London was one of the first markets in Europe to show improvement in office rents |
|
[GRAPHIC] |
|
|
|
|
|
|
|
|
|
|
|
FRANCE |
|
|
|
|
|
|
Gradual economic improvement filtering into office and retail markets. Strong interest from foreign investors, especially in Paris |
|
|
|
|
|
|
|
|
|
|
|
|
|
SPAIN |
|
|
|
|
|
|
Strong occupier demand boosts prospects for Madrid and Barcelona office markets. Local investors are particularly active purchasers |
|
ITALY |
|
|
|
|
|
|
Foreign investment rising, with increasing interest in the office market despite weak occupational indicators |
|
|
|
12
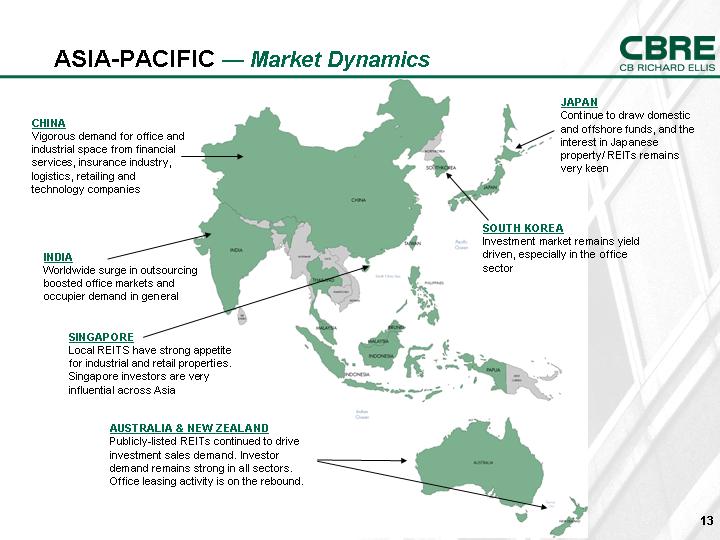
ASIA-PACIFIC — Market Dynamics
|
CHINA |
|
|
|
JAPAN |
|
|
Vigorous demand for office and industrial space from financial services, insurance industry, logistics, retailing and technology companies |
|
|
|
Continue to draw domestic and offshore funds, and the interest in Japanese property/ REITs remains very keen |
|
|
|
|
|
|
|
|
|
INDIA |
|
|
|
SOUTH KOREA |
|
|
Worldwide surge in outsourcing boosted office markets and occupier demand in general |
|
[GRAPHIC] |
|
Investment market remains yield driven, especially in the office sector |
|
|
|
|
|
|
|
|
|
SINGAPORE |
|
|
|
|
|
|
Local REITS have strong appetite for industrial and retail properties. Singapore investors are very influential across Asia |
|
|
|
|
|
|
|
|
|
|
|
|
|
AUSTRALIA & NEW ZEALAND |
|
|
|
|
|
|
Publicly-listed REITs continued to drive investment sales demand. Investor demand remains strong in all sectors. Office leasing activity is on the rebound. |
|
|
|
|
|
13
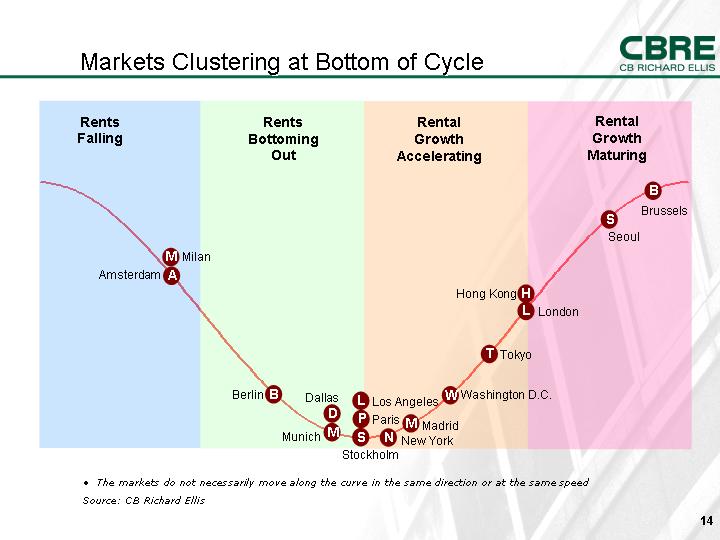
Markets Clustering at Bottom of Cycle
|
Rents |
|
Rents |
|
Rental |
|
Rental |
|
|
|
|
|
|
|
|
|
|
|
[CHART] |
|
||||||
• The markets do not necessarily move along the curve in the same direction or at the same speed
Source: CB Richard Ellis
14
Key Growth Strategies
15
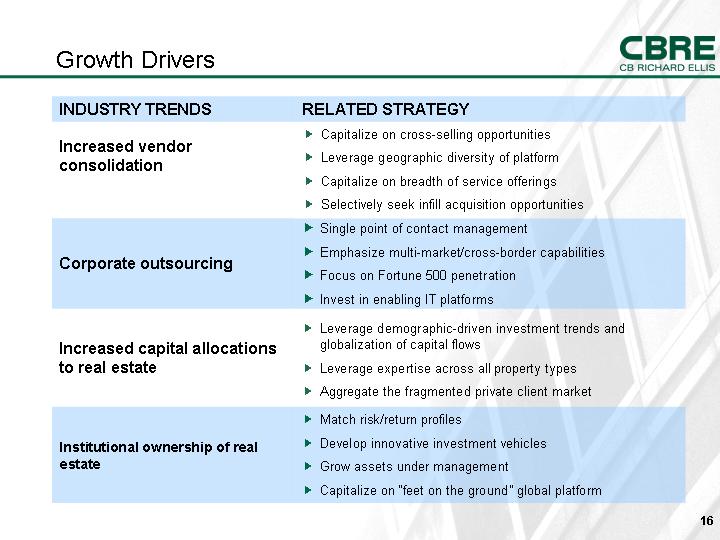
Growth Drivers
|
INDUSTRY TRENDS |
|
RELATED STRATEGY |
|
|
|
|
|
Increased vendor consolidation |
|
• Capitalize on cross-selling opportunities |
|
|
|
• Leverage geographic diversity of platform |
|
|
|
• Capitalize on breadth of service offerings |
|
|
|
• Selectively seek infill acquisition opportunities |
|
|
|
|
|
Corporate outsourcing |
|
• Single point of contact management |
|
|
|
• Emphasize multi-market/cross-border capabilities |
|
|
|
• Focus on Fortune 500 penetration |
|
|
|
• Invest in enabling IT platforms |
|
|
|
|
|
Increased capital allocations to real estate |
|
• Leverage
demographic-driven investment trends and globalization of capital |
|
|
|
• Leverage expertise across all property types |
|
|
|
• Aggregate the fragmented private client market |
|
|
|
|
|
Institutional ownership of real estate |
|
• Match risk/return profiles |
|
|
|
• Develop innovative investment vehicles |
|
|
|
• Grow assets under management |
|
|
|
• Capitalize on “feet on the ground” global platform |
16
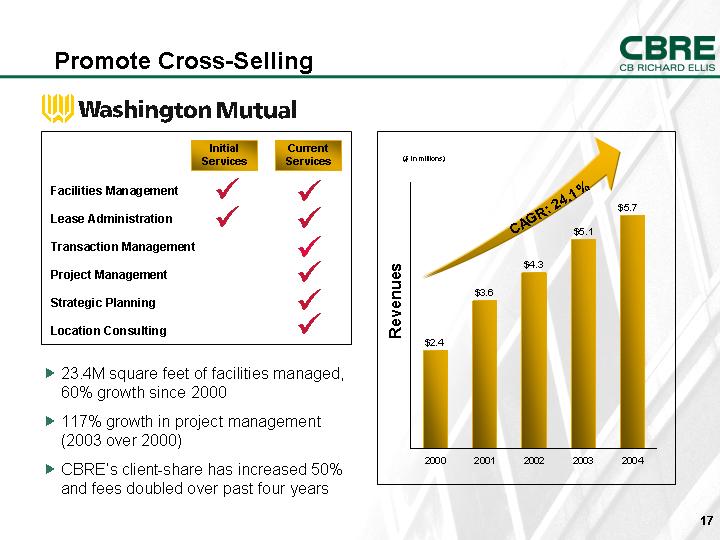
Promote Cross-Selling
Washington Mutual
|
|
|
Initial |
|
Current |
|
|
|
|
|
|
|
|
|
Facilities Management |
|
ý |
|
ý |
|
|
|
|
|
|
|
|
|
Lease Administration |
|
ý |
|
ý |
|
|
|
|
|
|
|
|
|
Transaction Management |
|
|
|
ý |
|
|
|
|
|
|
|
|
|
Project Management |
|
|
|
ý |
|
|
|
|
|
|
|
|
|
Strategic Planning |
|
|
|
ý |
|
|
|
|
|
|
|
|
|
Location Consulting |
|
|
|
ý |
|
• 23.4M square feet of facilities managed, 60% growth since 2000
• 117% growth in project management (2003 over 2000)
• CBRE’s client-share has increased 50% and fees doubled over past four years
[CHART]
17
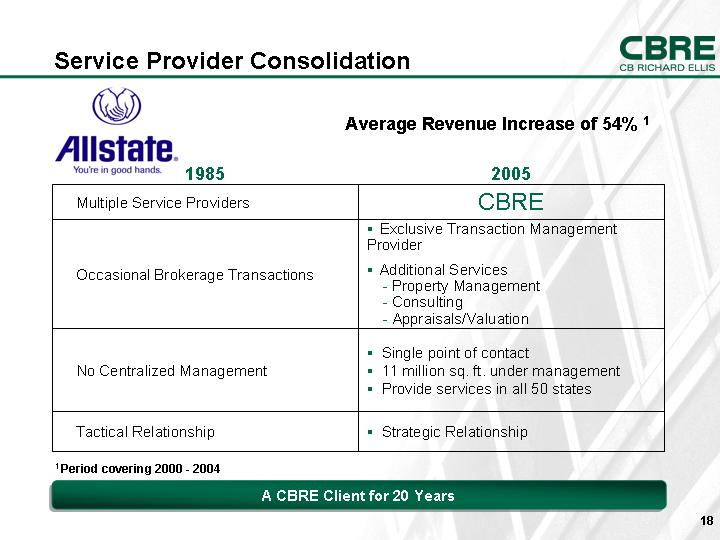
Service Provider Consolidation
Allstate
Average Revenue Increase of 54% (1)
|
1985 |
|
2005 |
|
Multiple Service Providers |
|
CBRE |
|
Occasional Brokerage Transactions |
|
• Exclusive Transaction Management Provider |
|
|
|
• Additional Services |
|
|
|
• Property Management |
|
|
|
• Consulting |
|
|
|
• Appraisals/Valuation |
|
|
|
|
|
No Centralized Management |
|
• Single point of contact |
|
|
|
• 11 million sq. ft. under management |
|
|
|
• Provide services in all 50 states |
|
|
|
|
|
Tactical Relationship |
|
• Strategic Relationship |
(1) Period covering 2000 - 2004
A CBRE Client for 20 Years
18
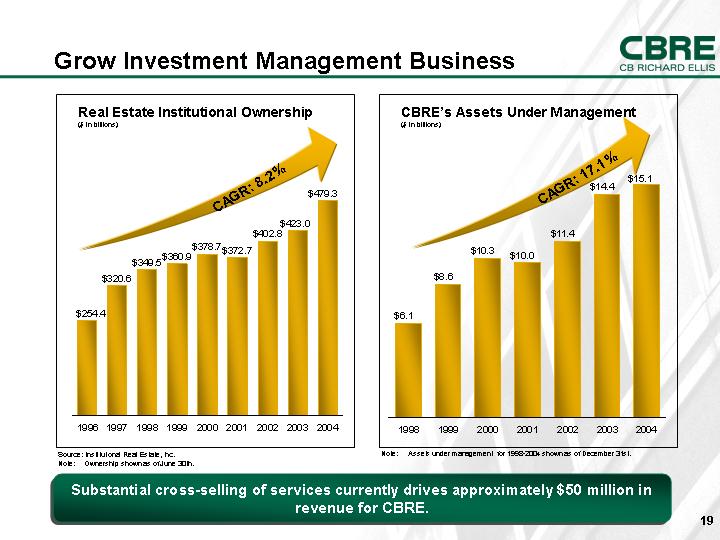
Grow Investment Management Business
|
Real Estate Institutional Ownership |
|
CBRE’s Assets Under Management |
|
($ in billions) |
|
($ in billions) |
|
|
|
|
|
[CHART] |
|
[CHART] |
|
|
|
Note: Assets under management for 1998-2004 |
Source: Institutional Real Estate, Inc.
Note: Ownership shown as of June 30th.
Substantial cross-selling of services currently drives approximately $50 million in revenue for CBRE.
19
Financial Overview
20
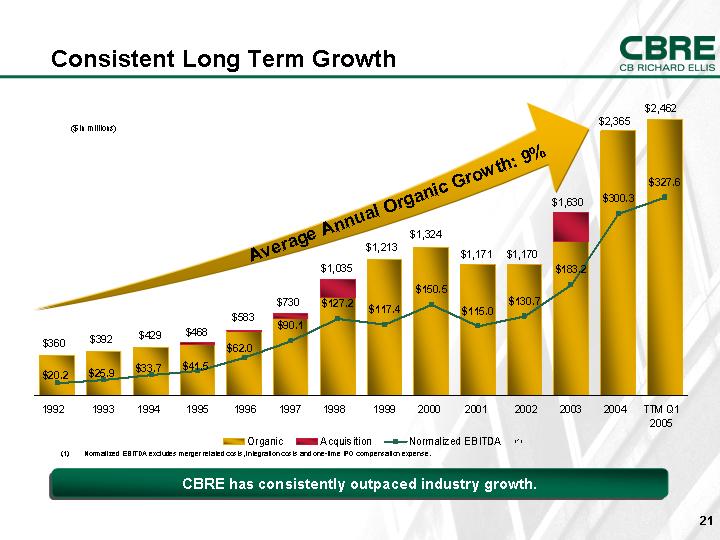
Consistent Long Term Growth
[CHART]
(1) Normalized EBITDA excludes merger related costs, integration costs and one-time IPO compensation expense.
CBRE has consistently outpaced industry growth.
21
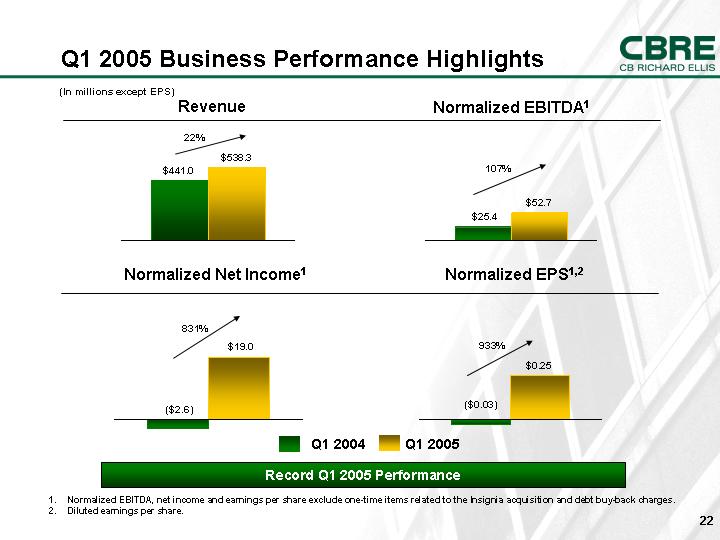
Q1 2005 Business Performance Highlights
(In millions except EPS)
|
Revenue |
|
Normalized EBITDA(1) |
|
|
|
|
|
[CHART] |
|
[CHART] |
|
|
|
|
|
|
|
|
|
Normalized Net Income(1) |
|
Normalized EPS(1),(2) |
|
|
|
|
|
[CHART] |
|
[CHART] |
|
|
|
|
Record Q1 2005 Performance
(1). Normalized EBITDA, net income and earnings per share exclude one-time items related to the Insignia acquisition and debt buy-back charges.
(2). Diluted earnings per share.
22
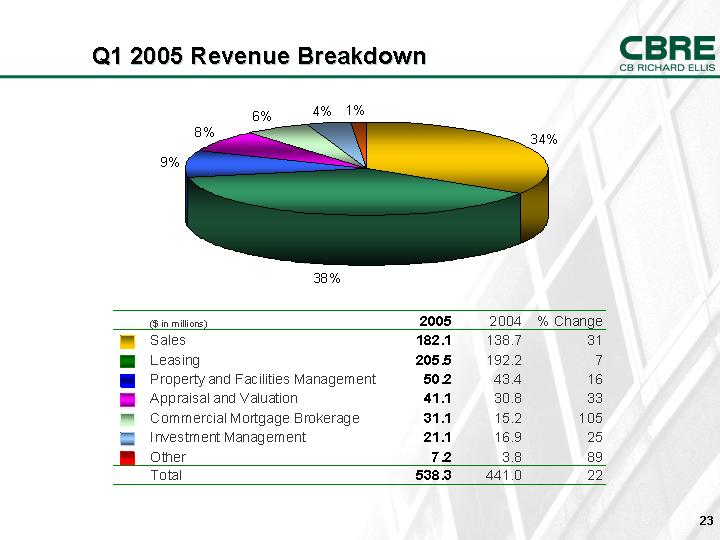
Q1 2005 Revenue Breakdown
[CHART]
|
($ in millions) |
|
2005 |
|
2004 |
|
% Change |
|
||
|
|
|
Sales |
|
182.1 |
|
138.7 |
|
31 |
|
|
|
|
|
|
|
|
|
|
|
|
|
|
|
Leasing |
|
205.5 |
|
192.2 |
|
7 |
|
|
|
|
|
|
|
|
|
|
|
|
|
|
|
Property and Facilities Management |
|
50.2 |
|
43.4 |
|
16 |
|
|
|
|
|
|
|
|
|
|
|
|
|
|
|
Appraisal and Valuation |
|
41.1 |
|
30.8 |
|
33 |
|
|
|
|
|
|
|
|
|
|
|
|
|
|
|
Commercial Mortgage Brokerage |
|
31.1 |
|
15.2 |
|
105 |
|
|
|
|
|
|
|
|
|
|
|
|
|
|
|
Investment Management |
|
21.1 |
|
16.9 |
|
25 |
|
|
|
|
|
|
|
|
|
|
|
|
|
|
|
Other |
|
7.2 |
|
3.8 |
|
89 |
|
|
|
|
|
|
|
|
|
|
|
|
|
|
|
Total |
|
538.3 |
|
441.0 |
|
22 |
|
23
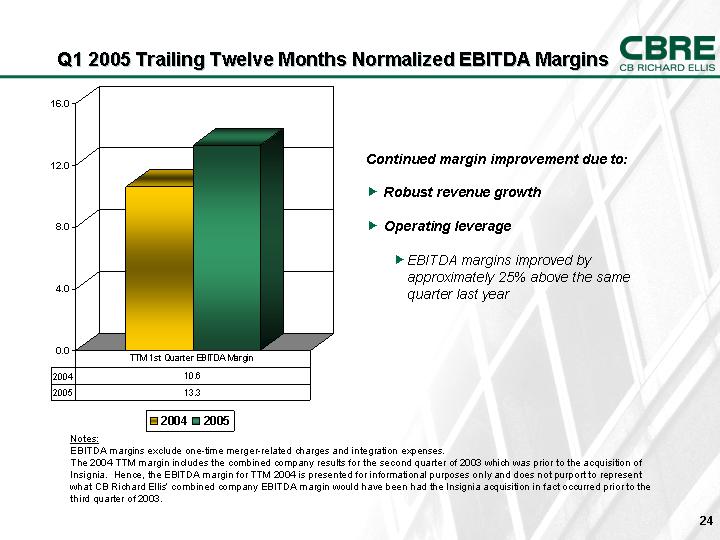
Q1 2005 Trailing Twelve Months Normalized EBITDA Margins
[CHART]
|
|
|
TTM 1st Quarter EBITDA Margin |
|
2004 |
|
10.6 |
|
2005 |
|
13.3 |
Continued margin improvement due to:
• Robust revenue growth
• Operating leverage
• EBITDA margins improved by approximately 25% above the same quarter last year
Notes:
EBITDA margins exclude one-time merger-related charges and integration expenses.
The 2004 TTM margin includes the combined company results for the second quarter of 2003 which was prior to the acquisition of Insignia. Hence, the EBITDA margin for TTM 2004 is presented for informational purposes only and does not purport to represent what CB Richard Ellis’ combined company EBITDA margin would have been had the Insignia acquisition in fact occurred prior to the third quarter of 2003.
24
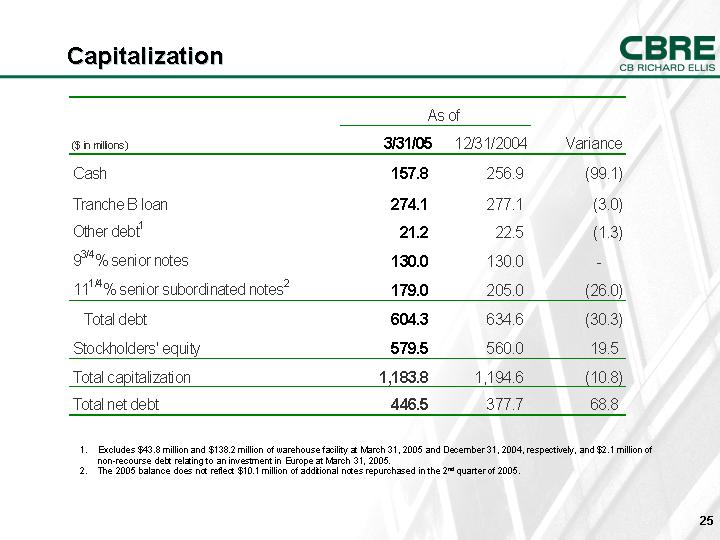
Capitalization
|
|
|
As of |
|
|
|
||
|
($ in millions) |
|
3/31/05 |
|
12/31/2004 |
|
Variance |
|
|
Cash |
|
157.8 |
|
256.9 |
|
(99.1 |
) |
|
|
|
|
|
|
|
|
|
|
Tranche B loan |
|
274.1 |
|
277.1 |
|
(3.0 |
) |
|
Other debt(1) |
|
21.2 |
|
22.5 |
|
(1.3 |
) |
|
93/4% senior notes |
|
130.0 |
|
130.0 |
|
— |
|
|
111/4% senior subordinated notes(2) |
|
179.0 |
|
205.0 |
|
(26.0 |
) |
|
Total debt |
|
604.3 |
|
634.6 |
|
(30.3 |
) |
|
Stockholders’ equity |
|
579.5 |
|
560.0 |
|
19.5 |
|
|
Total capitalization |
|
1,183.8 |
|
1,194.6 |
|
(10.8 |
) |
|
Total net debt |
|
446.5 |
|
377.7 |
|
68.8 |
|
(1). Excludes $43.8 million and $138.2 million of warehouse facility at March 31, 2005 and December 31, 2004, respectively, and $2.1 million of non-recourse debt relating to an investment in Europe at March 31, 2005.
(2). The 2005 balance does not reflect $10.1 million of additional notes repurchased in the 2nd quarter of 2005.
25
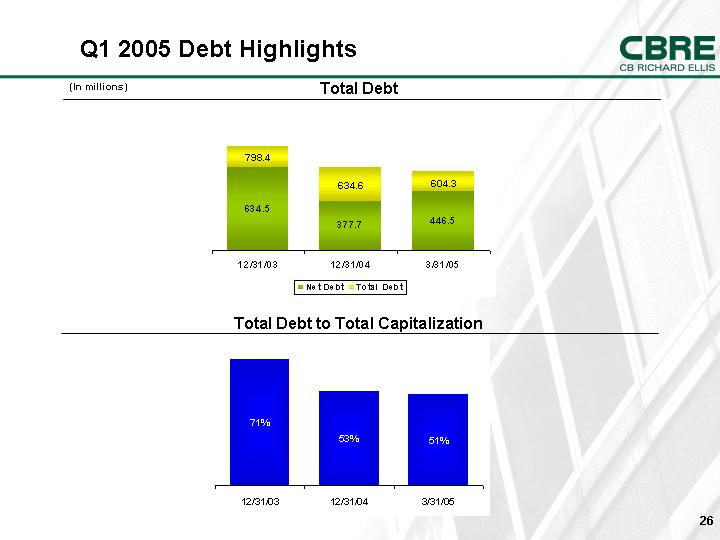
Q1 2005 Debt Highlights
(In millions)
|
Total Debt |
|
|
|
[CHART] |
|
|
|
Total Debt to Total Capitalization |
|
|
|
[CHART] |
26
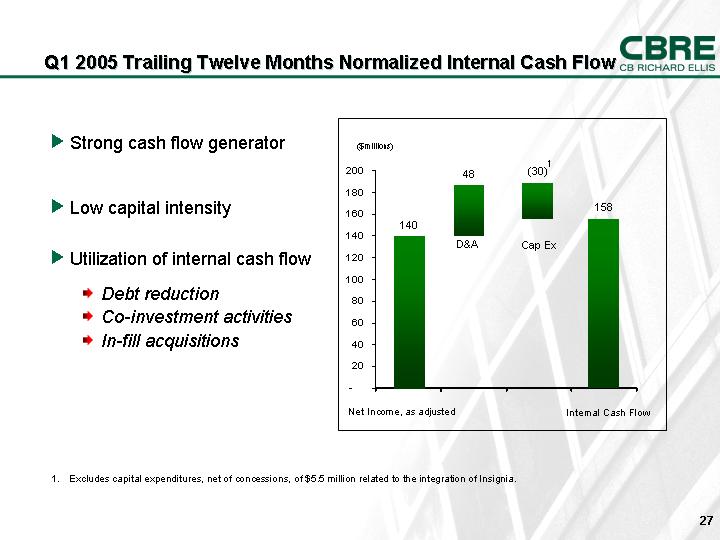
Q1 2005 Trailing Twelve Months Normalized Internal Cash Flow
• Strong cash flow generator
• Low capital intensity
• Utilization of internal cash flow
• Debt reduction
• Co-investment activities
• In-fill acquisitions
[CHART]
(1). Excludes capital expenditures, net of concessions, of $5.5 million related to the integration of Insignia.
27
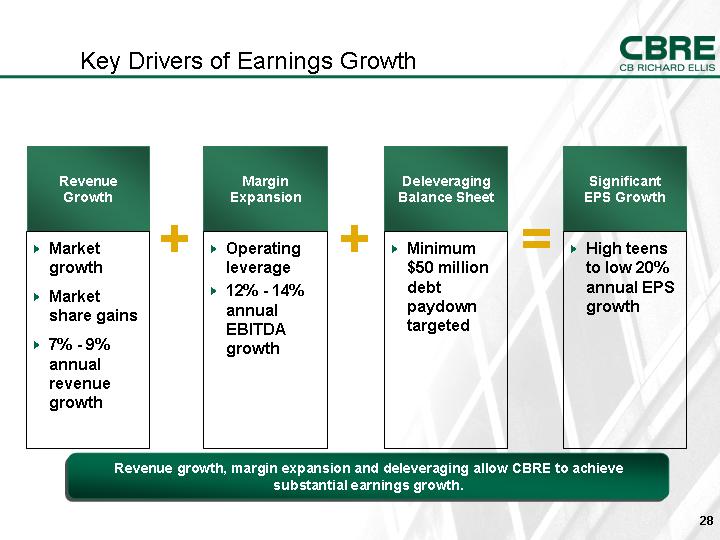
Key Drivers of Earnings Growth
|
Revenue |
|
Margin |
|
Deleveraging |
|
Significant |
||||
|
|
|
|
|
|
|
|
|
|||
|
• |
Market |
+ |
• |
Operating |
+ |
• |
Minimum |
= |
• |
High teens |
|
|
|
|
|
|
|
|
debt |
|
|
annual EPS |
|
• |
Market |
|
• |
12% - 14% |
|
|
paydown |
|
|
growth |
|
|
|
|
|
EBITDA |
|
|
|
|
|
|
|
• |
7% - 9% |
|
|
growth |
|
|
|
|
|
|
Revenue growth, margin expansion and deleveraging allow CBRE to achieve substantial earnings growth.
28
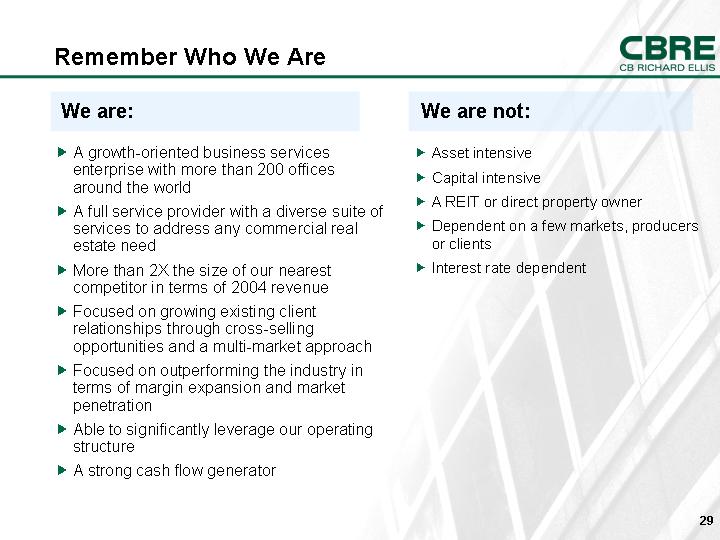
Remember Who We Are
We are:
• A growth-oriented business services
enterprise with more than 200 offices
around the world
• A full service provider with a diverse suite of services to address any commercial real estate need
• More than 2X the size of our nearest competitor in terms of 2004 revenue
• Focused on growing existing client relationships through cross-selling opportunities and a multi-market approach
• Focused on outperforming the industry in terms of margin expansion and market penetration
• Able to significantly leverage our operating structure
• A strong cash flow generator
We are not:
• Asset intensive
• Capital intensive
• A REIT or direct property owner
• Dependent on a few markets, producers or clients
• Interest rate dependent
29
Appendix
30
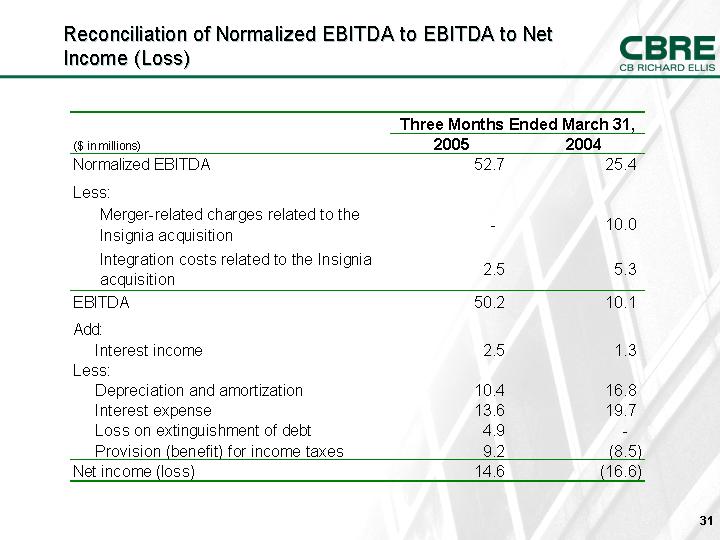
Reconciliation of Normalized EBITDA to EBITDA to Net Income (Loss)
|
|
|
Three Months Ended March 31, |
|
||
|
($ in millions) |
|
2005 |
|
2004 |
|
|
Normalized EBITDA |
|
52.7 |
|
25.4 |
|
|
|
|
|
|
|
|
|
Less: |
|
|
|
|
|
|
Merger-related charges related to the Insignia acquisition |
|
— |
|
10.0 |
|
|
Integration costs related to the Insignia acquisition |
|
2.5 |
|
5.3 |
|
|
EBITDA |
|
50.2 |
|
10.1 |
|
|
|
|
|
|
|
|
|
Add: |
|
|
|
|
|
|
Interest income |
|
2.5 |
|
1.3 |
|
|
Less: |
|
|
|
|
|
|
Depreciation and amortization |
|
10.4 |
|
16.8 |
|
|
Interest expense |
|
13.6 |
|
19.7 |
|
|
Loss on extinguishment of debt |
|
4.9 |
|
— |
|
|
Provision (benefit) for income taxes |
|
9.2 |
|
(8.5 |
) |
|
Net income (loss) |
|
14.6 |
|
(16.6 |
) |
31
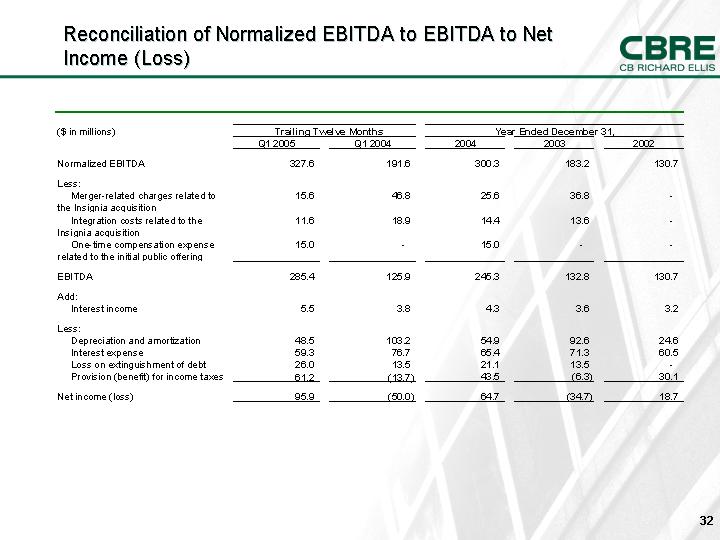
Reconciliation of Normalized EBITDA to EBITDA to Net Income (Loss)
|
|
|
Trailing Twelve Months |
|
Year Ended December 31, |
|
||||||
|
($ in millions) |
|
Q1 2005 |
|
Q1 2004 |
|
2004 |
|
2003 |
|
2002 |
|
|
|
|
|
|
|
|
|
|
|
|
|
|
|
Normalized EBITDA |
|
327.6 |
|
191.6 |
|
300.3 |
|
183.2 |
|
130.7 |
|
|
|
|
|
|
|
|
|
|
|
|
|
|
|
Less: |
|
|
|
|
|
|
|
|
|
|
|
|
Merger-related charges related to the Insignia acquisition |
|
15.6 |
|
46.8 |
|
25.6 |
|
36.8 |
|
— |
|
|
Integration costs related to the Insignia acquisition |
|
11.6 |
|
18.9 |
|
14.4 |
|
13.6 |
|
— |
|
|
One-time compensation expense related to the initial public offering |
|
15.0 |
|
— |
|
15.0 |
|
— |
|
— |
|
|
|
|
|
|
|
|
|
|
|
|
|
|
|
EBITDA |
|
285.4 |
|
125.9 |
|
245.3 |
|
132.8 |
|
130.7 |
|
|
|
|
|
|
|
|
|
|
|
|
|
|
|
Add: |
|
|
|
|
|
|
|
|
|
|
|
|
Interest income |
|
5.5 |
|
3.8 |
|
4.3 |
|
3.6 |
|
3.2 |
|
|
|
|
|
|
|
|
|
|
|
|
|
|
|
Less: |
|
|
|
|
|
|
|
|
|
|
|
|
Depreciation and amortization |
|
48.5 |
|
103.2 |
|
54.9 |
|
92.6 |
|
24.6 |
|
|
Interest expense |
|
59.3 |
|
76.7 |
|
65.4 |
|
71.3 |
|
60.5 |
|
|
Loss on extinguishment of debt |
|
26.0 |
|
13.5 |
|
21.1 |
|
13.5 |
|
— |
|
|
Provision (benefit) for income taxes |
|
61.2 |
|
(13.7 |
) |
43.5 |
|
(6.3 |
) |
30.1 |
|
|
|
|
|
|
|
|
|
|
|
|
|
|
|
Net income (loss) |
|
95.9 |
|
(50.0 |
) |
64.7 |
|
(34.7 |
) |
18.7 |
|
32
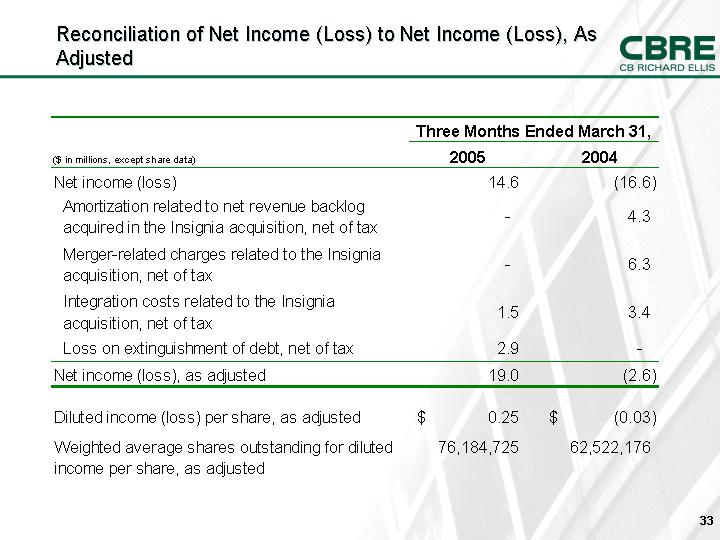
Reconciliation of Net Income (Loss) to Net Income (Loss), As Adjusted
33
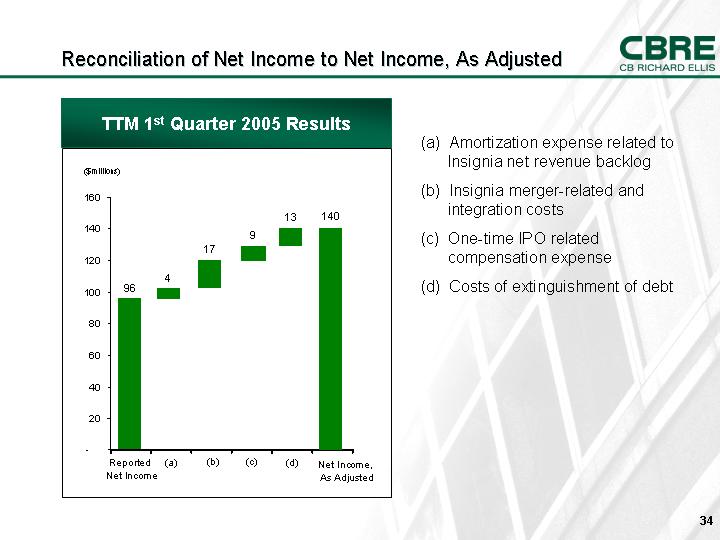
Reconciliation of Net Income to Net Income, As Adjusted
TTM 1st Quarter 2005 Results
[CHART]
(a) Amortization expense related to Insignia net revenue backlog
(b) Insignia merger-related and integration costs
(c) One-time IPO related compensation expense
(d) Costs of extinguishment of debt
34
[LOGO]
35