Exhibit 99.2

Link to searchable text of slide shown above
Searchable text section of graphics shown above
Forward Looking Statements
[GRAPHIC]
This presentation contains statements that are forward looking within the meaning of the Private Securities Litigation Reform Act of 1995. These statements should be considered as estimates only and actual results may ultimately differ from these estimates. Except to the extent required by applicable securities laws, CB Richard Ellis Group, Inc. undertakes no obligation to update or publicly revise any of the forward-looking statements that you may hear today. Please refer to our annual report on Form 10-K and our quarterly reports on Form 10-Q, which are filed with the SEC and available at the SEC’s Web site (http://www.sec.gov), for a full discussion of the risks and other factors, that may impact any estimates that you may hear today. We may make certain statements during the course of this presentation which include references to “non-GAAP financial measures,” as defined by SEC regulations. As required by these regulations, we have provided reconciliations of these measures to what we believe are the most directly comparable GAAP measures, which are attached hereto within the appendix.
1
Conference Call Participants
Brett White, President
Ken Kay, Senior Executive Vice President and Chief Financial Officer
Cal Frese, President, Americas
Shelley Young, Director of Investor Relations
2
Q1 2005 Performance Highlights
[GRAPHIC]
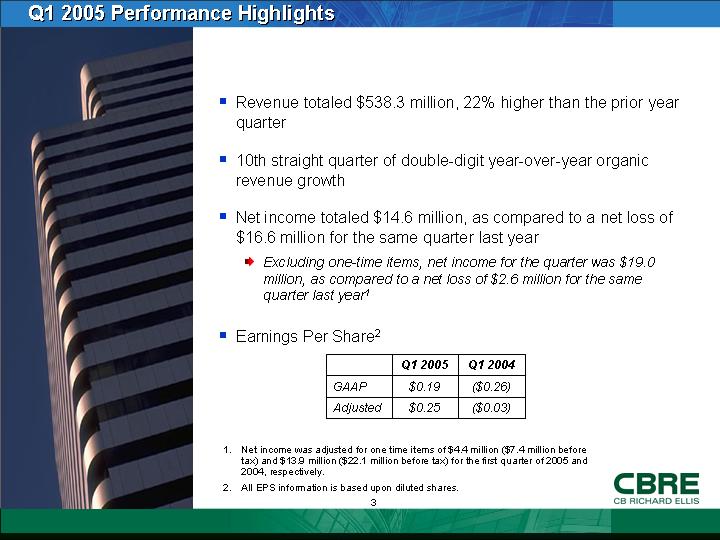
• Revenue totaled $538.3 million, 22% higher than the prior year quarter
• 10th straight quarter of double-digit year-over-year organic revenue growth
• Net income totaled $14.6 million, as compared to a net loss of $16.6 million for the same quarter last year
• Excluding one-time items, net income for the quarter was $19.0 million, as compared to a net loss of $2.6 million for the same quarter last year(1)
• Earnings Per Share(2)
|
|
|
Q1 2005 |
|
Q1 2004 |
|
||
|
GAAP |
|
$ |
0.19 |
|
$ |
(0.26 |
) |
|
Adjusted |
|
$ |
0.25 |
|
$ |
(0.03 |
) |
(1). Net income was adjusted for one time items of $4.4 million ($7.4 million before tax) and $13.9 million ($22.1 million before tax) for the first quarter of 2005 and 2004, respectively.
(2). All EPS information is based upon diluted shares.
3
[GRAPHIC]
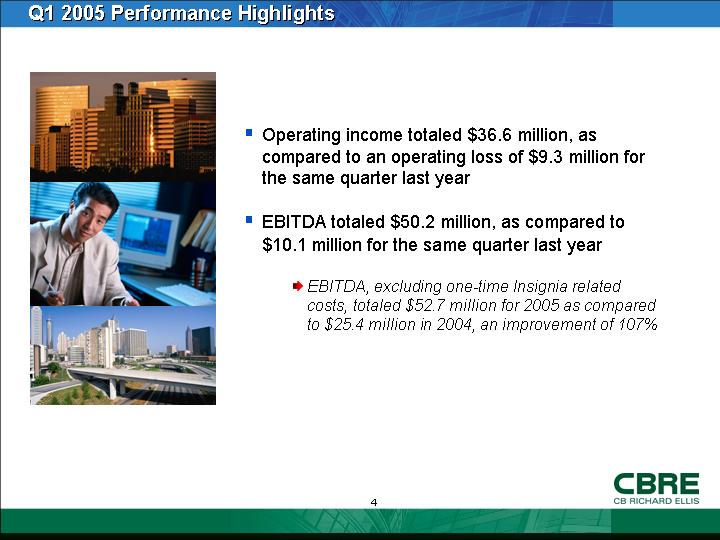
• Operating income totaled $36.6 million, as compared to an operating loss of $9.3 million for the same quarter last year
• EBITDA totaled $50.2 million, as compared to $10.1 million for the same quarter last year
• EBITDA, excluding one-time Insignia related costs, totaled $52.7 million for 2005 as compared to $25.4 million in 2004, an improvement of 107%
4
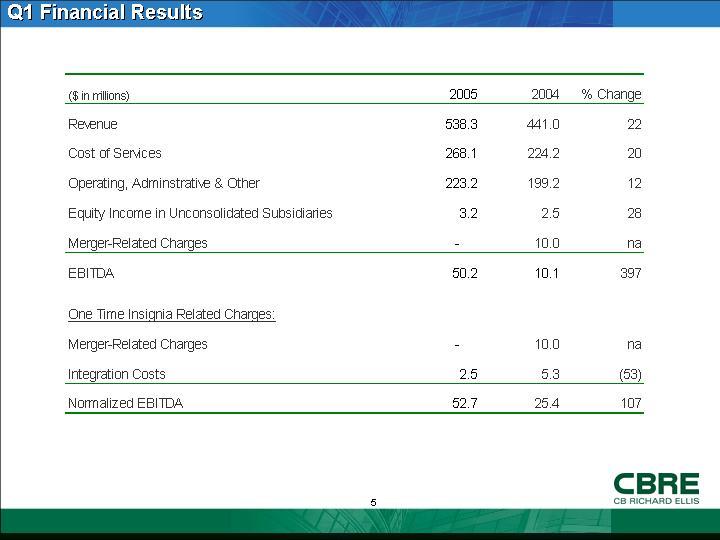
Q1 Financial Results
|
($ in millions) |
|
2005 |
|
2004 |
|
% Change |
|
|
Revenue |
|
538.3 |
|
441.0 |
|
22 |
|
|
Cost of Services |
|
268.1 |
|
224.2 |
|
20 |
|
|
Operating, Adminstrative & Other |
|
223.2 |
|
199.2 |
|
12 |
|
|
Equity Income in Unconsolidated Subsidiaries |
|
3.2 |
|
2.5 |
|
28 |
|
|
Merger-Related Charges |
|
— |
|
10.0 |
|
na |
|
|
EBITDA |
|
50.2 |
|
10.1 |
|
397 |
|
|
|
|
|
|
|
|
|
|
|
One Time Insignia Related Charges: |
|
|
|
|
|
|
|
|
Merger-Related Charges |
|
— |
|
10.0 |
|
na |
|
|
Integration Costs |
|
2.5 |
|
5.3 |
|
(53 |
) |
|
Normalized EBITDA |
|
52.7 |
|
25.4 |
|
107 |
|
5
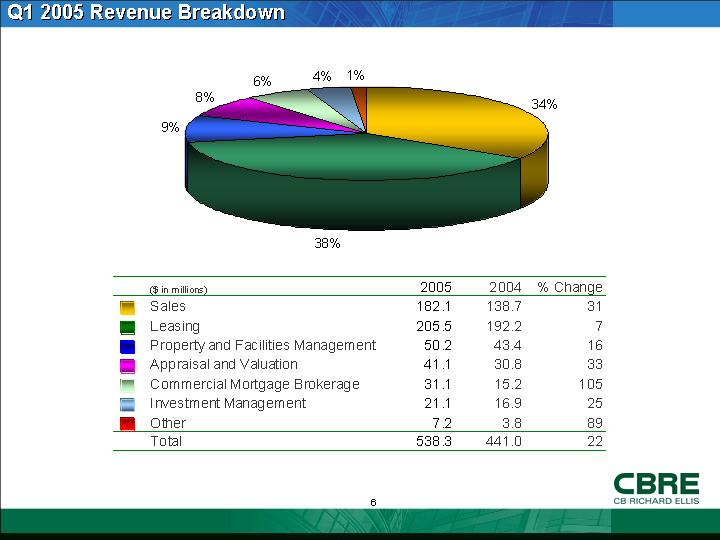
Q1 2005 Revenue Breakdown
[CHART]
|
($ in millions) |
|
2005 |
|
2004 |
|
% Change |
|
|
Sales |
|
182.1 |
|
138.7 |
|
31 |
|
|
Leasing |
|
205.5 |
|
192.2 |
|
7 |
|
|
Property and Facilities Management |
|
50.2 |
|
43.4 |
|
16 |
|
|
Appraisal and Valuation |
|
41.1 |
|
30.8 |
|
33 |
|
|
Commercial Mortgage Brokerage |
|
31.1 |
|
15.2 |
|
105 |
|
|
Investment Management |
|
21.1 |
|
16.9 |
|
25 |
|
|
Other |
|
7.2 |
|
3.8 |
|
89 |
|
|
Total |
|
538.3 |
|
441.0 |
|
22 |
|
6
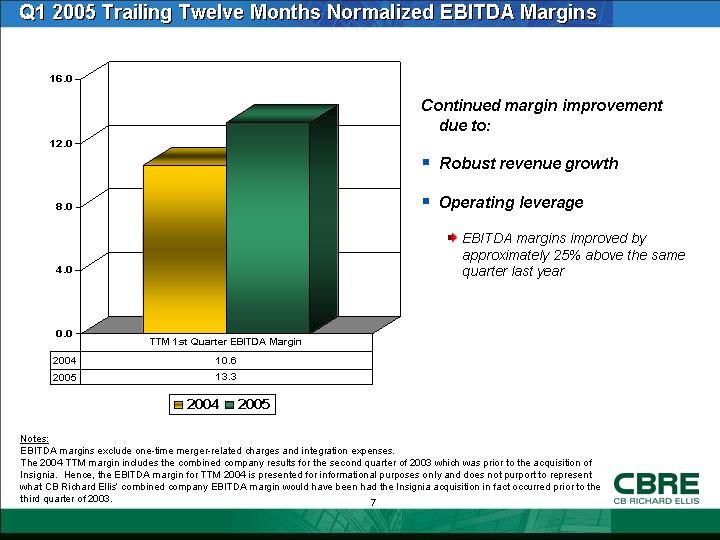
Q1 2005 Trailing Twelve Months Normalized EBITDA Margins
[CHART]
Continued margin improvement due to:
• Robust revenue growth
• Operating leverage
• EBITDA margins improved by approximately 25% above the same quarter last year
Notes:
EBITDA margins exclude one-time merger-related charges and integration expenses.
The 2004 TTM margin includes the combined company results for the second quarter of 2003 which was prior to the acquisition of Insignia. Hence, the EBITDA margin for TTM 2004 is presented for informational purposes only and does not purport to represent what CB Richard Ellis’ combined company EBITDA margin would have been had the Insignia acquisition in fact occurred prior to the third quarter of 2003.
7
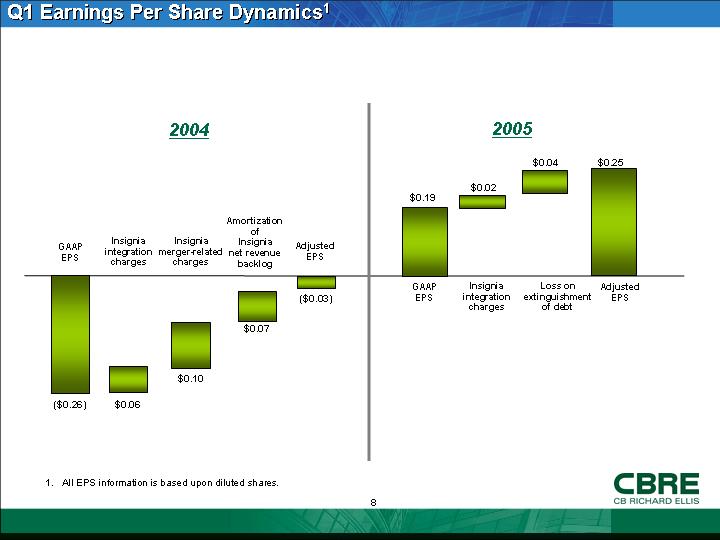
Q1 Earnings Per Share Dynamics(1)
2004
[CHART]
2005
[CHART]
(1). All EPS information is based upon diluted shares.
8
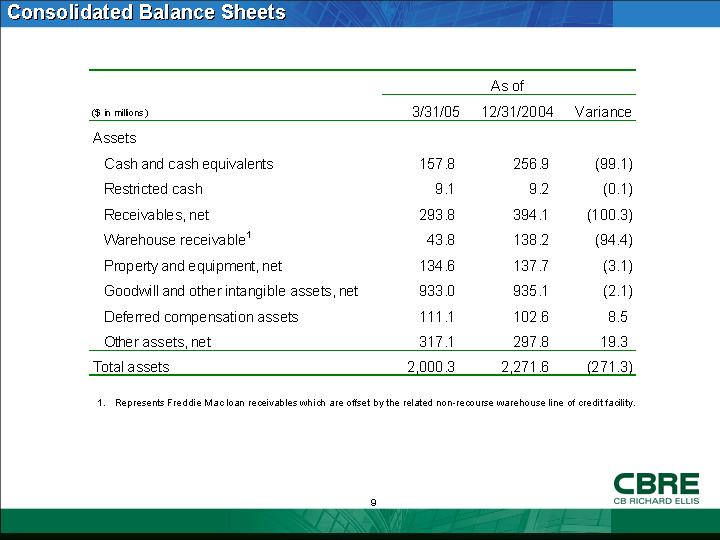
Consolidated Balance Sheets
|
|
|
As of |
|
||||
|
($ in millions) |
|
3/31/05 |
|
12/31/2004 |
|
Variance |
|
|
Assets |
|
|
|
|
|
|
|
|
Cash and cash equivalents |
|
157.8 |
|
256.9 |
|
(99.1 |
) |
|
Restricted cash |
|
9.1 |
|
9.2 |
|
(0.1 |
) |
|
Receivables, net |
|
293.8 |
|
394.1 |
|
(100.3 |
) |
|
Warehouse receivable(1) |
|
43.8 |
|
138.2 |
|
(94.4 |
) |
|
Property and equipment, net |
|
134.6 |
|
137.7 |
|
(3.1 |
) |
|
Goodwill and other intangible assets, net |
|
933.0 |
|
935.1 |
|
(2.1 |
) |
|
Deferred compensation assets |
|
111.1 |
|
102.6 |
|
8.5 |
|
|
Other assets, net |
|
317.1 |
|
297.8 |
|
19.3 |
|
|
Total assets |
|
2,000.3 |
|
2,271.6 |
|
(271.3 |
) |
(1). Represents Freddie Mac loan receivables which are offset by the related non-recourse warehouse line of credit facility.
9
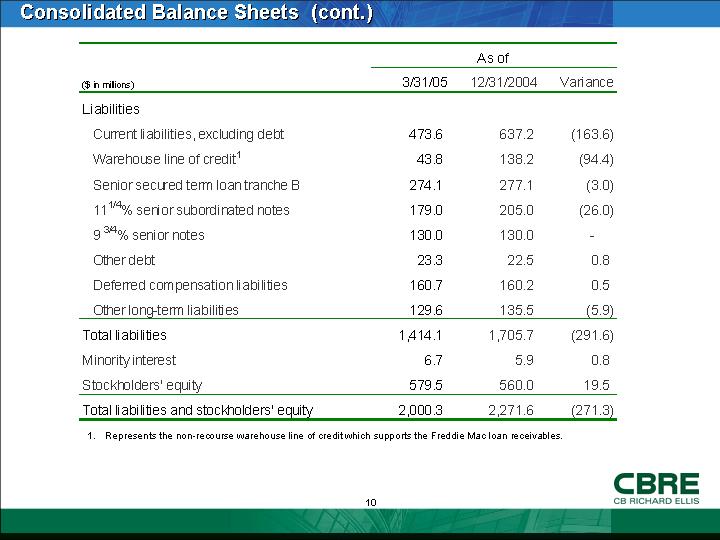
Consolidated Balance Sheets (cont.)
|
|
|
As of |
|
||||
|
($ in millions) |
|
3/31/05 |
|
12/31/2004 |
|
Variance |
|
|
Liabilities |
|
|
|
|
|
|
|
|
Current liabilities, excluding debt |
|
473.6 |
|
637.2 |
|
(163.6 |
) |
|
Warehouse line of credit(1) |
|
43.8 |
|
138.2 |
|
(94.4 |
) |
|
Senior secured term loan tranche B |
|
274.1 |
|
277.1 |
|
(3.0 |
) |
|
111/4% senior subordinated notes |
|
179.0 |
|
205.0 |
|
(26.0 |
) |
|
9 3/4% senior notes |
|
130.0 |
|
130.0 |
|
— |
|
|
Other debt |
|
23.3 |
|
22.5 |
|
0.8 |
|
|
Deferred compensation liabilities |
|
160.7 |
|
160.2 |
|
0.5 |
|
|
Other long-term liabilities |
|
129.6 |
|
135.5 |
|
(5.9 |
) |
|
Total liabilities |
|
1,414.1 |
|
1,705.7 |
|
(291.6 |
) |
|
Minority interest |
|
6.7 |
|
5.9 |
|
0.8 |
|
|
Stockholders’ equity |
|
579.5 |
|
560.0 |
|
19.5 |
|
|
Total liabilities and stockholders’ equity |
|
2,000.3 |
|
2,271.6 |
|
(271.3 |
) |
(1). Represents the non-recourse warehouse line of credit which supports the Freddie Mac loan receivables.
10
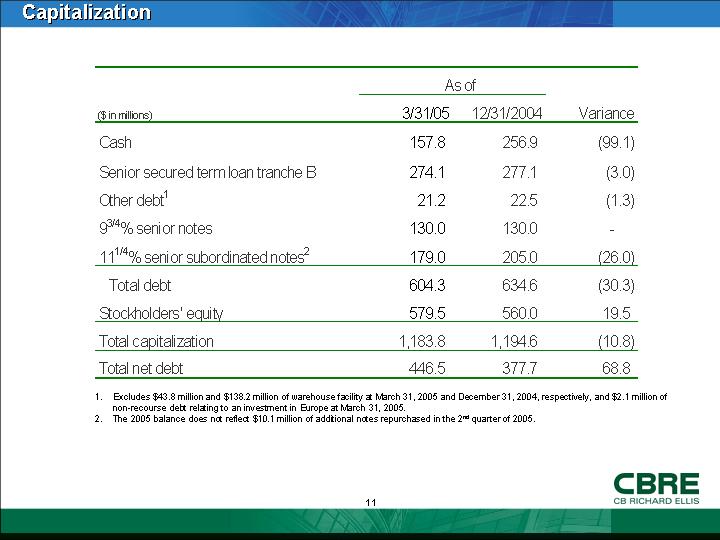
Capitalization
|
|
|
As of |
|
|
|
||
|
($ in millions) |
|
3/31/05 |
|
12/31/2004 |
|
Variance |
|
|
Cash |
|
157.8 |
|
256.9 |
|
(99.1 |
) |
|
Senior secured term loan tranche B |
|
274.1 |
|
277.1 |
|
(3.0 |
) |
|
Other debt(1) |
|
21.2 |
|
22.5 |
|
(1.3 |
) |
|
93/4% senior notes |
|
130.0 |
|
130.0 |
|
— |
|
|
111/4% senior subordinated notes(2) |
|
179.0 |
|
205.0 |
|
(26.0 |
) |
|
Total debt |
|
604.3 |
|
634.6 |
|
(30.3 |
) |
|
Stockholders’ equity |
|
579.5 |
|
560.0 |
|
19.5 |
|
|
Total capitalization |
|
1,183.8 |
|
1,194.6 |
|
(10.8 |
) |
|
Total net debt |
|
446.5 |
|
377.7 |
|
68.8 |
|
(1). Excludes $43.8 million and $138.2 million of warehouse facility at March 31, 2005 and December 31, 2004, respectively, and $2.1 million of non-recourse debt relating to an investment in Europe at March 31, 2005.
(2). The 2005 balance does not reflect $10.1 million of additional notes repurchased in the 2nd quarter of 2005.
11
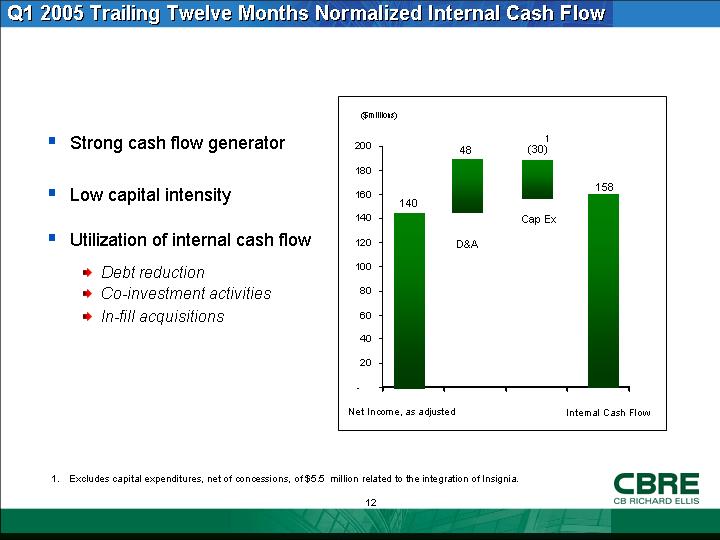
Q1 2005 Trailing Twelve Months Normalized Internal Cash Flow
• Strong cash flow generator
• Low capital intensity
• Utilization of internal cash flow
• Debt reduction
• Co-investment activities
• In-fill acquisitions
[CHART]
(1). Excludes capital expenditures, net of concessions, of $5.5 million related to the integration of Insignia.
12
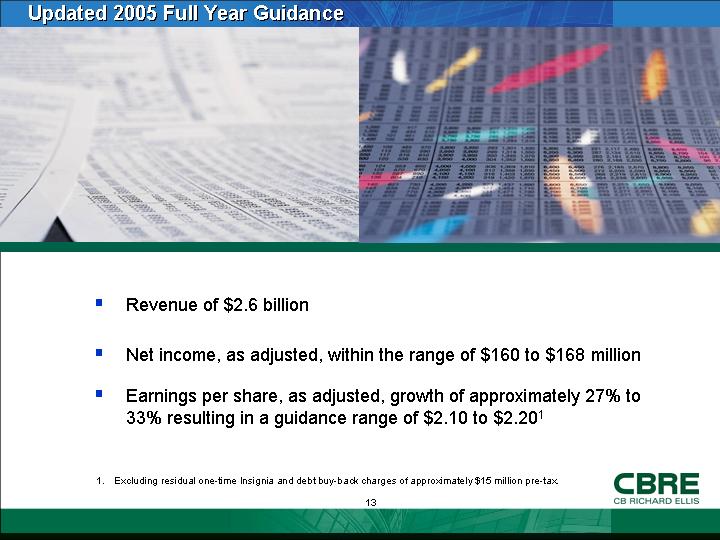
Updated 2005 Full Year Guidance
[GRAPHIC]
• Revenue of $2.6 billion
• Net income, as adjusted, within the range of $160 to $168 million
• Earnings per share, as adjusted, growth of approximately 27% to 33% resulting in a guidance range of $2.10 to $2.20(1)
(1). Excluding residual one-time Insignia and debt buy-back charges of approximately $15 million pre-tax.
13
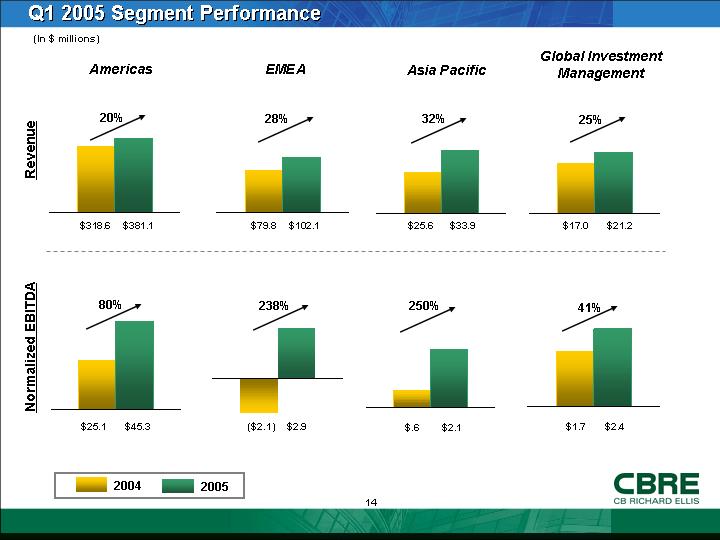
Q1 2005 Segment Performance
(In $ millions)
|
|
|
Americas |
|
EMEA |
|
Asia Pacific |
|
Global Investment |
|
|
|
|
|
|
|
|
|
|
|
|
|
Revenue |
|
[CHART] |
|
[CHART] |
|
[CHART] |
|
[CHART] |
|
|
|
|
|
|
|
|
|
|
|
|
|
Normalized EBITDA |
|
[CHART] |
|
[CHART] |
|
[CHART] |
|
[CHART] |
|
14
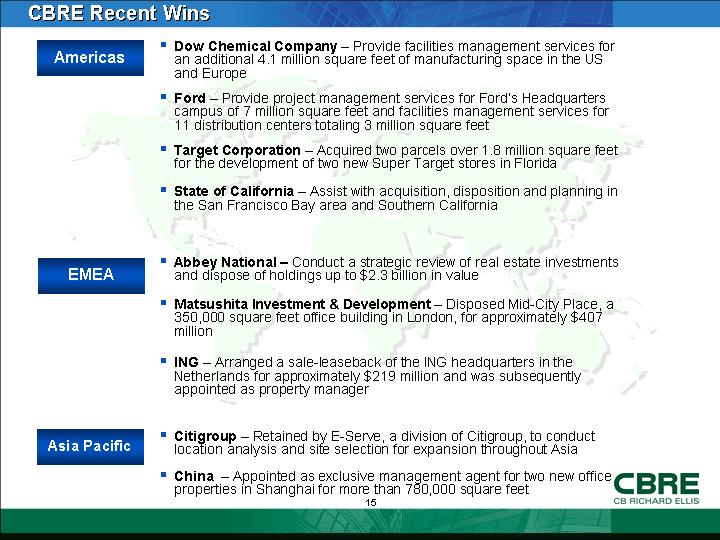
CBRE Recent Wins
Americas
• Dow Chemical Company – Provide facilities management services for an additional 4.1 million square feet of manufacturing space in the US and Europe
• Ford – Provide project management services for Ford’s Headquarters campus of 7 million square feet and facilities management services for 11 distribution centers totaling 3 million square feet
• Target Corporation – Acquired two parcels over 1.8 million square feet for the development of two new Super Target stores in Florida
• State of California – Assist with acquisition, disposition and planning in the San Francisco Bay area and Southern California
EMEA
• Abbey National – Conduct a strategic review of real estate investments and dispose of holdings up to $2.3 billion in value
• Matsushita Investment & Development – Disposed Mid-City Place, a 350,000 square feet office building in London, for approximately $407 million
• ING – Arranged a sale-leaseback of the ING headquarters in the Netherlands for approximately $219 million and was subsequently appointed as property manager
Asia Pacific
• Citigroup – Retained by E-Serve, a division of Citigroup, to conduct location analysis and site selection for expansion throughout Asia
• China – Appointed as exclusive management agent for two new office properties in Shanghai for more than 780,000 square feet
15
Favorable Trends
[GRAPHIC]
• Improving commercial real estate fundamentals in most major markets
• Declining vacancy rates
• Increasing net absorption
• Rising rental rates
• Low levels of new construction
• Continued strength of capital flows to commercial real estate and resulting strong commercial real estate capital markets environment are benefiting:
• Investment property sales
• Commercial mortgage market
• Investment management business
• CB Richard Ellis’ brand continues to gain strength
• Market share gains in most business lines and geographies
• Major assignment wins globally
• High rate of hiring key competitor personnel
• Very low attrition of key personnel
16
Summary
• Record Performance
• Strong revenue, EBITDA, net income and earnings per share as a result of improved performance from all lines of business
• Outlook
• Global economic expansion continues
• Leasing recovery underway
• Strong capital flows to real estate remain
[GRAPHIC]
17
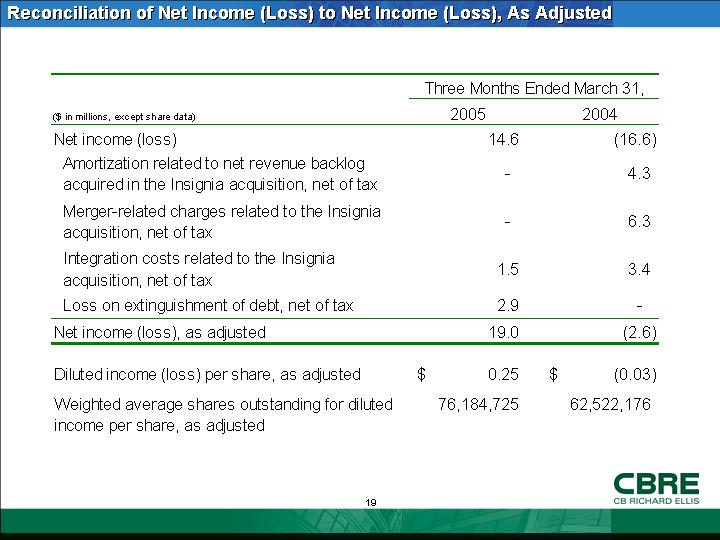
Reconciliation of Net Income (Loss) to Net Income (Loss), As Adjusted
|
|
|
Three Months Ended March 31, |
|
||||
|
($ in millions, except share data) |
|
2005 |
|
2004 |
|
||
|
Net income (loss) |
|
14.6 |
|
(16.6 |
) |
||
|
Amortization related to net revenue backlog acquired in the Insignia acquisition, net of tax |
|
— |
|
4.3 |
|
||
|
Merger-related charges related to the Insignia acquisition, net of tax |
|
— |
|
6.3 |
|
||
|
Integration costs related to the Insignia acquisition, net of tax |
|
1.5 |
|
3.4 |
|
||
|
Loss on extinguishment of debt, net of tax |
|
2.9 |
|
— |
|
||
|
Net income (loss), as adjusted |
|
19.0 |
|
(2.6 |
) |
||
|
|
|
|
|
|
|
||
|
Diluted income (loss) per share, as adjusted |
|
$ |
0.25 |
|
$ |
(0.03 |
) |
|
Weighted average shares outstanding for diluted income per share, as adjusted |
|
76,184,725 |
|
62,522,176 |
|
||
19
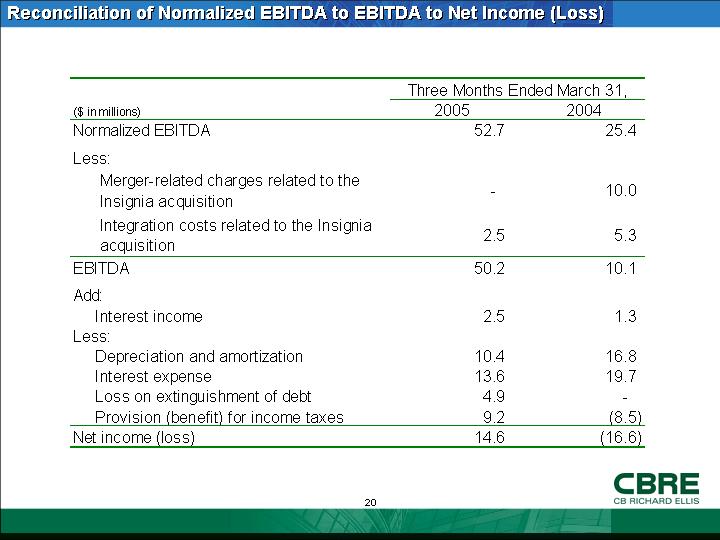
Reconciliation of Normalized EBITDA to EBITDA to Net Income (Loss)
|
|
|
Three Months Ended March 31, |
|
||
|
($ in millions) |
|
2005 |
|
2004 |
|
|
Normalized EBITDA |
|
52.7 |
|
25.4 |
|
|
|
|
|
|
|
|
|
Less: |
|
|
|
|
|
|
Merger-related charges related to the Insignia acquisition |
|
— |
|
10.0 |
|
|
Integration costs related to the Insignia acquisition |
|
2.5 |
|
5.3 |
|
|
EBITDA |
|
50.2 |
|
10.1 |
|
|
|
|
|
|
|
|
|
Add: |
|
|
|
|
|
|
Interest income |
|
2.5 |
|
1.3 |
|
|
Less: |
|
|
|
|
|
|
Depreciation and amortization |
|
10.4 |
|
16.8 |
|
|
Interest expense |
|
13.6 |
|
19.7 |
|
|
Loss on extinguishment of debt |
|
4.9 |
|
— |
|
|
Provision (benefit) for income taxes |
|
9.2 |
|
(8.5 |
) |
|
Net income (loss) |
|
14.6 |
|
(16.6 |
) |
20
|
|
|
Trailing Twelve Months |
|
||
|
($ in millions) |
|
Q1 2005 |
|
Q1 2004 |
|
|
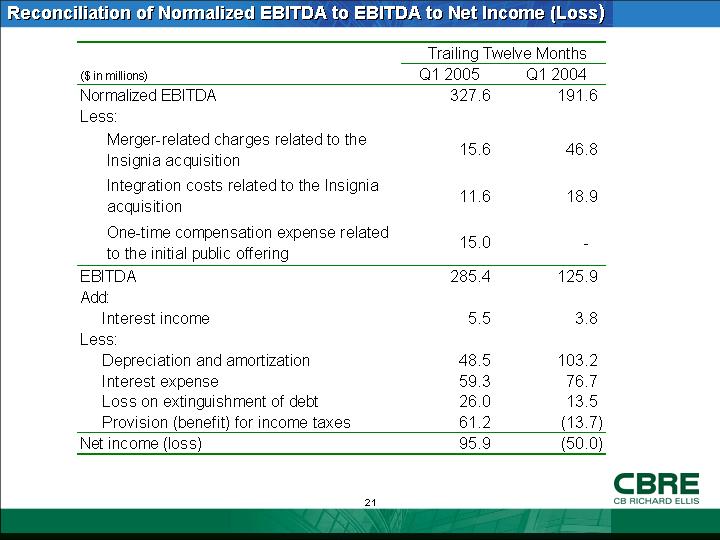
Normalized EBITDA |
|
327.6 |
|
191.6 |
|
|
Less: |
|
|
|
|
|
|
Merger-related charges related to the Insignia acquisition |
|
15.6 |
|
46.8 |
|
|
Integration costs related to the Insignia acquisition |
|
11.6 |
|
18.9 |
|
|
One-time compensation expense related to the initial public offering |
|
15.0 |
|
— |
|
|
EBITDA |
|
285.4 |
|
125.9 |
|
|
Add: |
|
|
|
|
|
|
Interest income |
|
5.5 |
|
3.8 |
|
|
Less: |
|
|
|
|
|
|
Depreciation and amortization |
|
48.5 |
|
103.2 |
|
|
Interest expense |
|
59.3 |
|
76.7 |
|
|
Loss on extinguishment of debt |
|
26.0 |
|
13.5 |
|
|
Provision (benefit) for income taxes |
|
61.2 |
|
(13.7 |
) |
|
Net income (loss) |
|
95.9 |
|
(50.0 |
) |
21
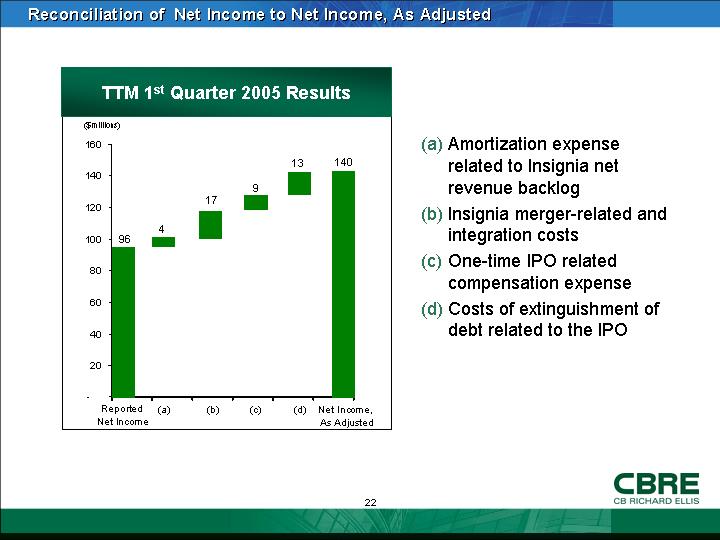
Reconciliation of Net Income to Net Income, As Adjusted
[CHART]
(a) Amortization expense related to Insignia net revenue backlog
(b) Insignia merger-related and integration costs
(c) One-time IPO related compensation expense
(d) Costs of extinguishment of debt related to the IPO
22
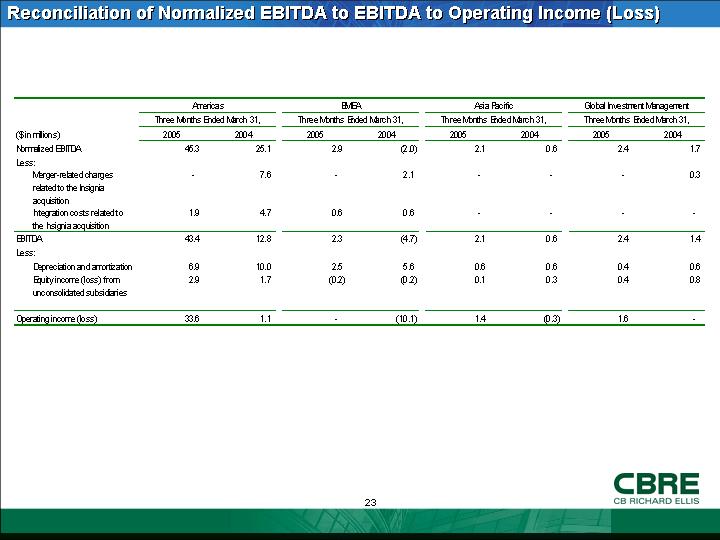
Reconciliation of Normalized EBITDA to EBITDA to Operating Income (Loss)
|
|
|
Americas |
|
EMEA |
|
Asia Pacific |
|
Global Investment Management |
|
||||||||
|
|
|
Three Months Ended March 31, |
|
Three Months Ended March 31, |
|
Three Months Ended March 31, |
|
Three Months Ended March 31, |
|
||||||||
|
($ in millions) |
|
2005 |
|
2004 |
|
2005 |
|
2004 |
|
2005 |
|
2004 |
|
2005 |
|
2004 |
|
|
Normalized EBITDA |
|
45.3 |
|
25.1 |
|
2.9 |
|
(2.0 |
) |
2.1 |
|
0.6 |
|
2.4 |
|
1.7 |
|
|
Less: |
|
|
|
|
|
|
|
|
|
|
|
|
|
|
|
|
|
|
Merger-related charges related to the Insignia acquisition |
|
— |
|
7.6 |
|
— |
|
2.1 |
|
— |
|
— |
|
— |
|
0.3 |
|
|
Integration costs related to the Insignia acquisition |
|
1.9 |
|
4.7 |
|
0.6 |
|
0.6 |
|
— |
|
— |
|
— |
|
— |
|
|
EBITDA |
|
43.4 |
|
12.8 |
|
2.3 |
|
(4.7 |
) |
2.1 |
|
0.6 |
|
2.4 |
|
1.4 |
|
|
Less: |
|
|
|
|
|
|
|
|
|
|
|
|
|
|
|
|
|
|
Depreciation and amortization |
|
6.9 |
|
10.0 |
|
2.5 |
|
5.6 |
|
0.6 |
|
0.6 |
|
0.4 |
|
0.6 |
|
|
Equity income (loss) from unconsolidated subsidiaries |
|
2.9 |
|
1.7 |
|
(0.2 |
) |
(0.2 |
) |
0.1 |
|
0.3 |
|
0.4 |
|
0.8 |
|
|
Operating income (loss) |
|
33.6 |
|
1.1 |
|
— |
|
(10.1 |
) |
1.4 |
|
(0.3 |
) |
1.6 |
|
— |
|
23