Exhibit 99.9
Link to searchable text of slide shown above
Link to searchable text of slide shown above
Link to searchable text of slide shown above
Link to searchable text of slide shown above
Link to searchable text of slide shown above
Link to searchable text of slide shown above
Link to searchable text of slide shown above
Link to searchable text of slide shown above
Link to searchable text of slide shown above
Link to searchable text of slide shown above
Link to searchable text of slide shown above
Link to searchable text of slide shown above
Link to searchable text of slide shown above
Link to searchable text of slide shown above
Link to searchable text of slide shown above
Link to searchable text of slide shown above
Link to searchable text of slide shown above
Link to searchable text of slide shown above

Link to searchable text of slide shown above
Link to searchable text of slide shown above
Link to searchable text of slide shown above
Link to searchable text of slide shown above
Link to searchable text of slide shown above
Link to searchable text of slide shown above
Link to searchable text of slide shown above
Searchable text section of graphics shown above
Business Review Day
New York Tri-State Region
Mary Ann Tighe
Chief Executive Officer
March 23, 2005
[GRAPHIC]
[LOGO]
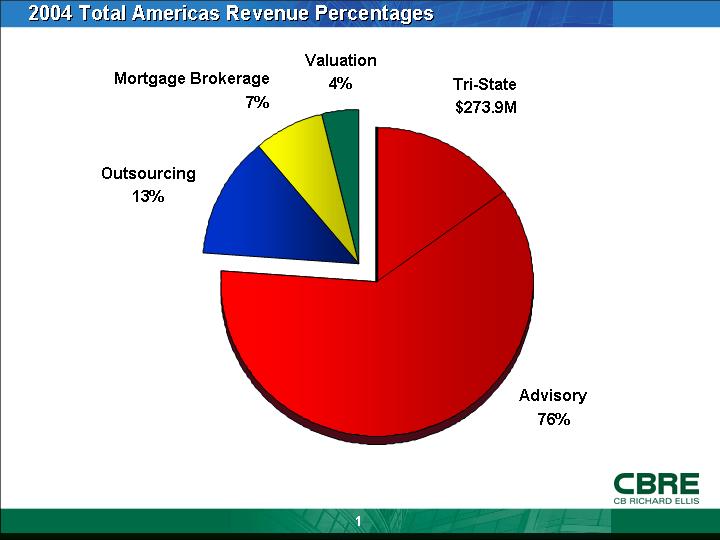
2004 Total Americas Revenue Percentages
[CHART]
1
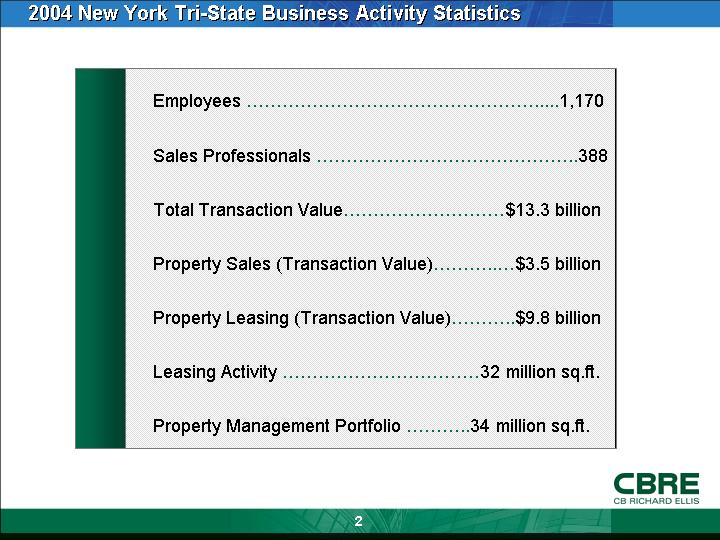
2004 New York Tri-State Business Activity Statistics
|
Employees |
|
1,170 |
|
|
|
|
|
|
|
Sales Professionals |
|
388 |
|
|
|
|
|
|
|
Total Transaction Value |
|
$13.3 billion |
|
|
|
|
|
|
|
Property Sales (Transaction Value) |
|
$3.5 billion |
|
|
|
|
|
|
|
Property Leasing (Transaction Value) |
|
$9.8 billion |
|
|
|
|
|
|
|
Leasing Activity |
|
32 million sq.ft. |
|
|
|
|
|
|
|
Property Management Portfolio |
|
34 million sq.ft. |
|
2
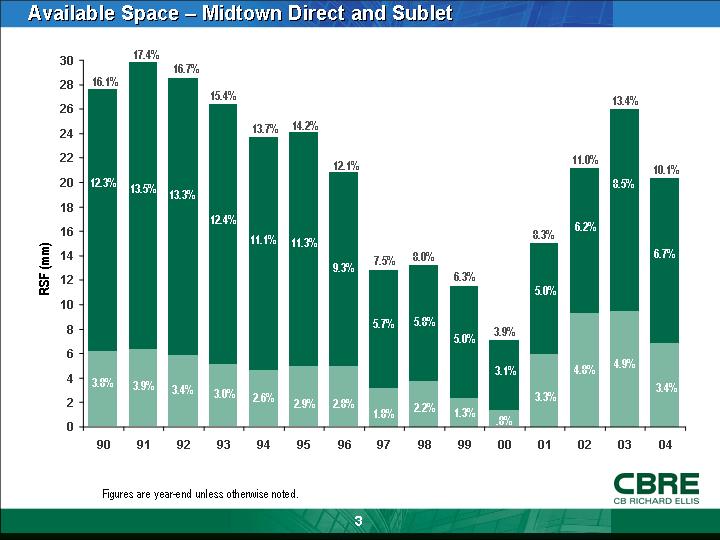
Available Space – Midtown Direct and Sublet
[CHART]
Figures are year-end unless otherwise noted.
3
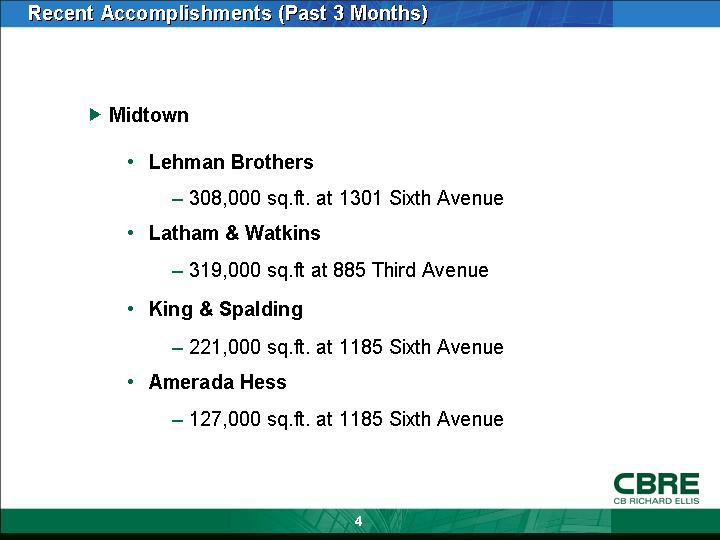
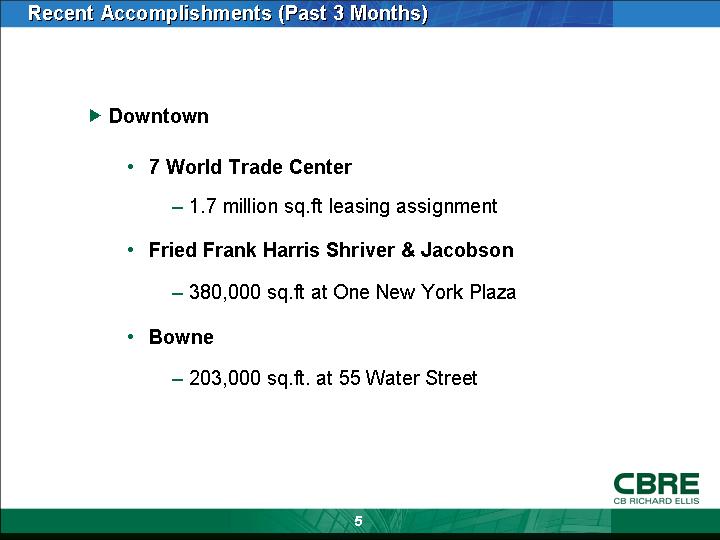
Recent Accomplishments (Past 3 Months)
• Midtown
• Lehman Brothers
• 308,000 sq.ft. at 1301 Sixth Avenue
• Latham & Watkins
• 319,000 sq.ft at 885 Third Avenue
• King & Spalding
• 221,000 sq.ft. at 1185 Sixth Avenue
• Amerada Hess
• 127,000 sq.ft. at 1185 Sixth Avenue
4
• Downtown
• 7 World Trade Center
• 1.7 million sq.ft leasing assignment
• Fried Frank Harris Shriver & Jacobson
• 380,000 sq.ft at One New York Plaza
• Bowne
• 203,000 sq.ft. at 55 Water Street
5
CBRE Unique Value Proposition
• Required Disciplines
• Market Clout
• Specific Real-Time Data
6
Required Disciplines
Full Spectrum Services
• Asset Services
• Corporate Services
• Investment Properties
• Landlord Representation
• Tenant Representation
• Valuation
7
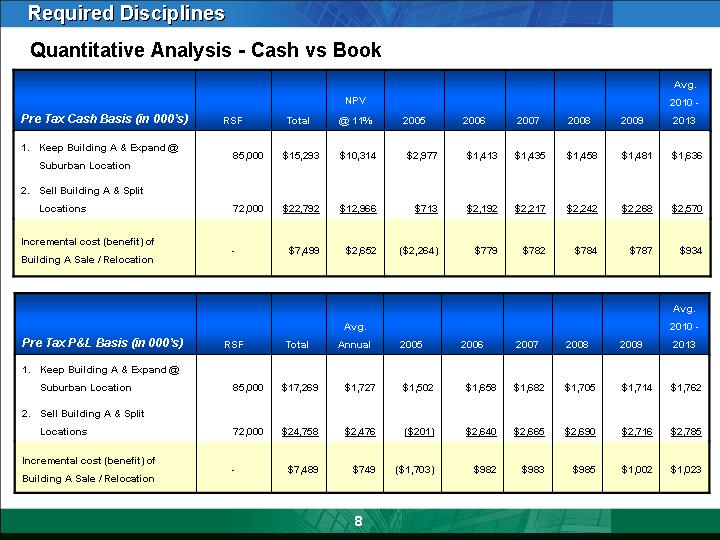
Quantitative Analysis - Cash vs Book
|
Pre Tax Cash Basis (in 000’s) |
|
RSF |
|
Total |
|
NPV |
|
2005 |
|
2006 |
|
2007 |
|
2008 |
|
2009 |
|
Avg. |
|
|||||||||
|
|
|
|
|
|
|
|
|
|
|
|
|
|
|
|
|
|
|
|
|
|||||||||
|
1. |
Keep Building A & Expand @ Suburban Location |
|
85,000 |
|
$ |
15,293 |
|
$ |
10,314 |
|
$ |
2,977 |
|
$ |
1,413 |
|
$ |
1,435 |
|
$ |
1,458 |
|
$ |
1,481 |
|
$ |
1,636 |
|
|
|
|
|
|
|
|
|
|
|
|
|
|
|
|
|
|
|
|
|
|
|
||||||||
|
2. |
Sell Building A & Split Locations |
|
72,000 |
|
$ |
22,792 |
|
$ |
12,966 |
|
$ |
713 |
|
$ |
2,192 |
|
$ |
2,217 |
|
$ |
2,242 |
|
$ |
2,268 |
|
$ |
2,570 |
|
|
|
|
|
|
|
|
|
|
|
|
|
|
|
|
|
|
|
|
|
|
|||||||||
|
Incremental cost (benefit) of Building A Sale / Relocation |
|
— |
|
$ |
7,499 |
|
$ |
2,652 |
|
$ |
(2,264 |
) |
$ |
779 |
|
$ |
782 |
|
$ |
784 |
|
$ |
787 |
|
$ |
934 |
|
|
|
|
|
|
|
|
|
|
|
|
|
|
|
|
|
|
|
|
|
|
|
|||||||||
|
Pre Tax P&L Basis (in 000’s) |
|
RSF |
|
Total |
|
Avg. |
|
2005 |
|
2006 |
|
2007 |
|
2008 |
|
2009 |
|
Avg. |
|
|||||||||
|
|
|
|
|
|
|
|
|
|
|
|
|
|
|
|
|
|
|
|
|
|||||||||
|
1. |
Keep Building A & Expand @ Suburban Location |
|
85,000 |
|
$ |
17,269 |
|
$ |
1,727 |
|
$ |
1,502 |
|
$ |
1,658 |
|
$ |
1,682 |
|
$ |
1,705 |
|
$ |
1,714 |
|
$ |
1,762 |
|
|
|
|
|
|
|
|
|
|
|
|
|
|
|
|
|
|
|
|
|
|
|
||||||||
|
2. |
Sell Building A & Split Locations |
|
72,000 |
|
$ |
24,758 |
|
$ |
2,476 |
|
$ |
(201 |
) |
$ |
2,640 |
|
$ |
2,665 |
|
$ |
2,690 |
|
$ |
2,716 |
|
$ |
2,785 |
|
|
|
|
|
|
|
|
|
|
|
|
|
|
|
|
|
|
|
|
|
|
|||||||||
|
Incremental cost (benefit) of Building A Sale / Relocation |
|
— |
|
$ |
7,489 |
|
$ |
749 |
|
$ |
(1,703 |
) |
$ |
982 |
|
$ |
983 |
|
$ |
985 |
|
$ |
1,002 |
|
$ |
1,023 |
|
|
8
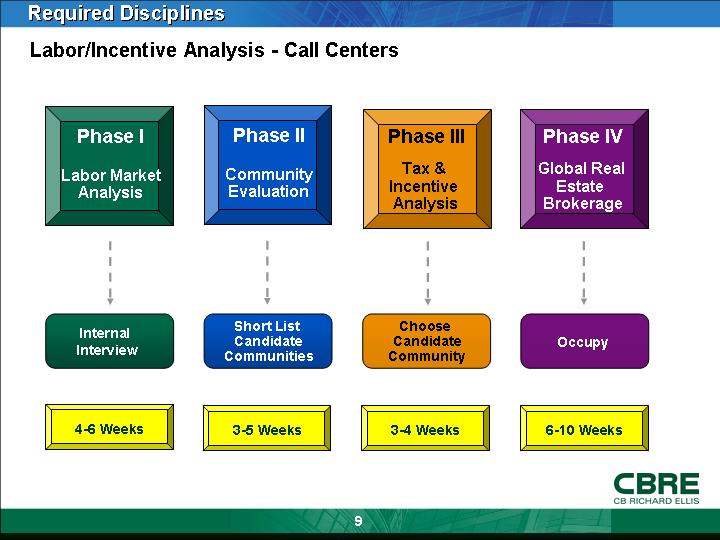
Labor/Incentive Analysis - Call Centers
|
Phase I |
|
Phase II |
|
Phase III |
|
Phase IV |
|
|
|
|
|
|
|
|
|
Labor Market |
|
Community |
|
Tax & |
|
Global Real |
|
Analysis |
|
Evaluation |
|
Incentive |
|
Estate |
|
|
|
|
|
Analysis |
|
Brokerage |
|
|
|
|
|
|
|
|
|
|
|
Short List |
|
Choose |
|
|
|
Internal |
|
Candidate |
|
Candidate |
|
Occupy |
|
Interview |
|
Communities |
|
Community |
|
|
|
|
|
|
|
|
|
|
|
4-6 Weeks |
|
3-5 Weeks |
|
3-4 Weeks |
|
6-10 Weeks |
9
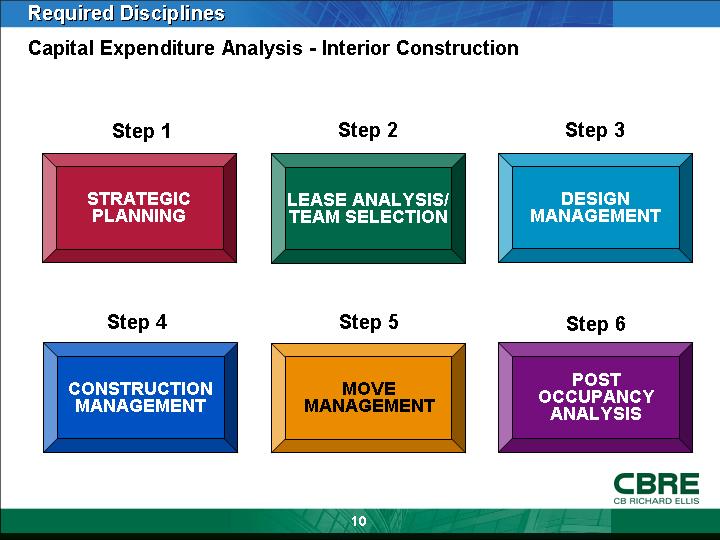
Capital Expenditure Analysis - Interior Construction
|
Step 1 |
|
Step 2 |
|
Step 3 |
|
|
|
|
|
|
|
STRATEGIC |
|
LEASE ANALYSIS/ |
|
DESIGN |
|
PLANNING |
|
TEAM SELECTION |
|
MANAGEMENT |
|
|
|
|
|
|
|
Step 4 |
|
Step 5 |
|
Step 6 |
|
|
|
|
|
|
|
|
|
|
|
POST |
|
CONSTRUCTION |
|
MOVE |
|
OCCUPANCY |
|
MANAGEMENT |
|
MANAGEMENT |
|
ANALYSIS |
10
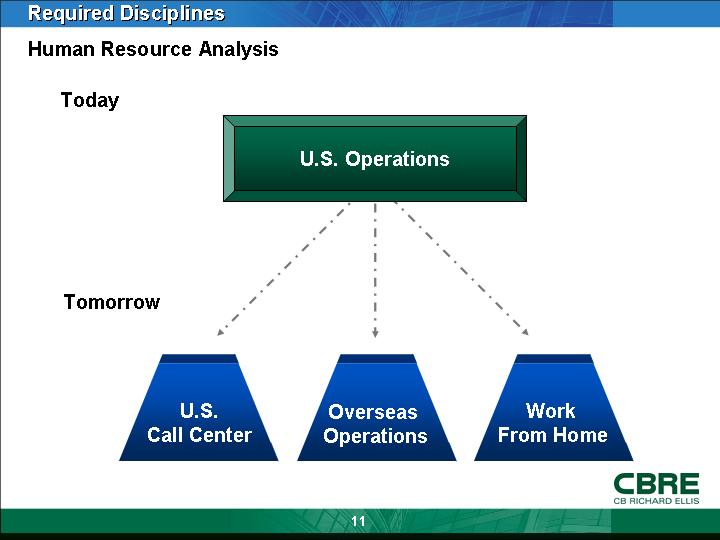
Human Resource Analysis
Today
U.S. Operations
Tomorrow
|
U.S. |
Overseas |
Work |
|
Call Center |
Operations |
From Home |
11
CBRE Unique Value Proposition
• Required Disciplines
• Market Clout
12
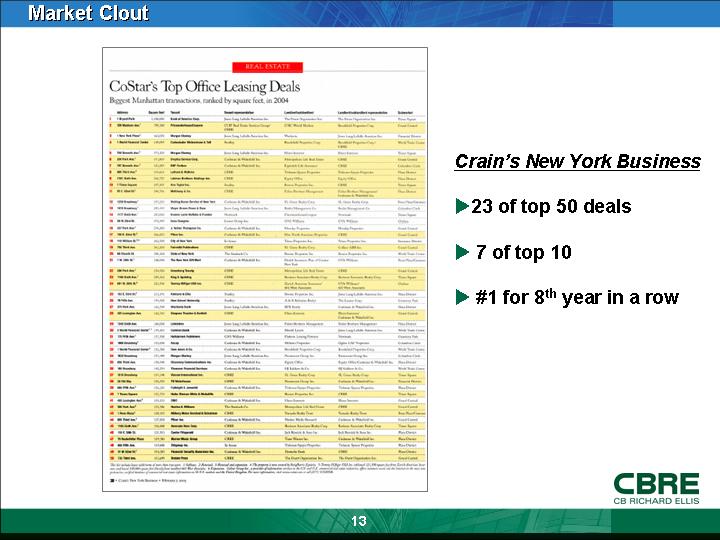
Market Clout
[GRAPHIC]
Crain’s New York Business
• 23 of top 50 deals
• 7 of top 10
• #1 for 8th year in a row
13
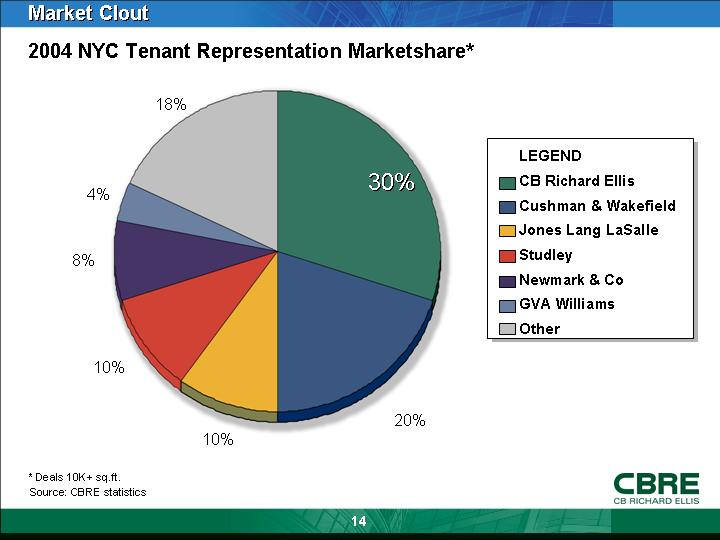
2004 NYC Tenant Representation Marketshare*
[CHART]
* Deals 10K+ sq.ft.
Source: CBRE statistics
14
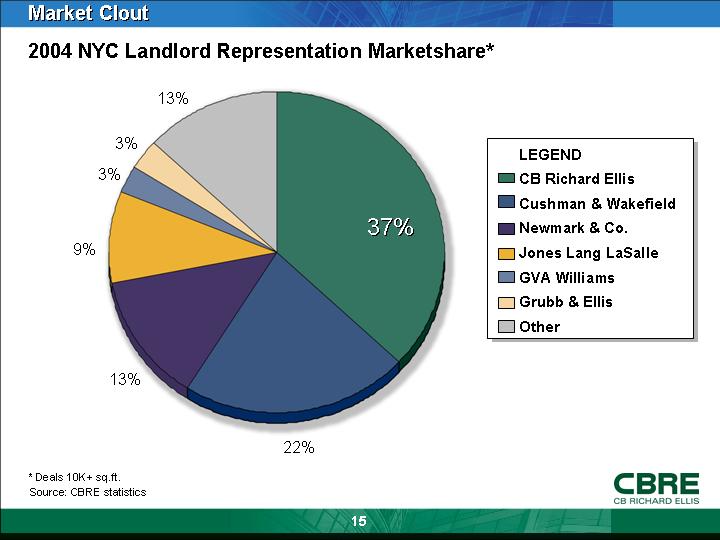
2004 NYC Landlord Representation Marketshare*
[CHART]
* Deals 10K+ sq.ft.
Source: CBRE statistics
15
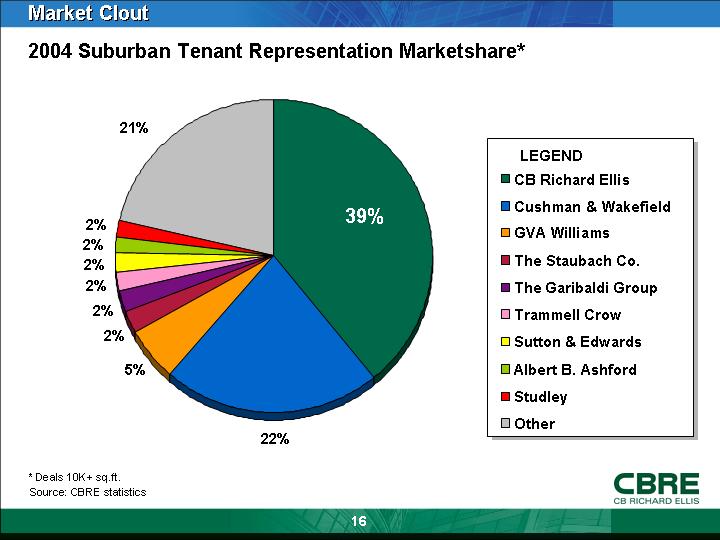
2004 Suburban Tenant Representation Marketshare*
[CHART]
* Deals 10K+ sq.ft.
Source: CBRE statistics
16
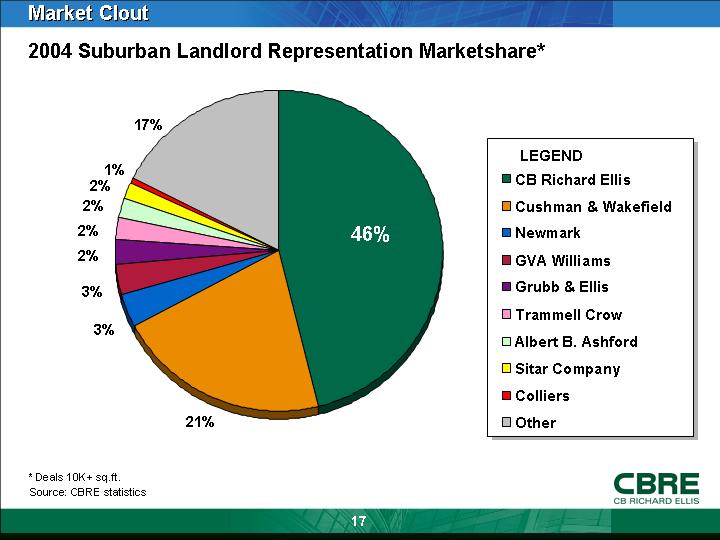
2004 Suburban Landlord Representation Marketshare*
[CHART]
* Deals 10K+ sq.ft.
Source: CBRE statistics
17
REITs/Public Companies that have Outsourced Leasing Responsibility to CBRE
• Boston Properties
• Times Square Tower
• 599 Lexington Avenue
• 28 Park Avenue
• Brookfield Properties Corporation
• 3 World Financial Center
• Equity Office Properties Trust
• 825 Eighth Avenue
• 527 Madison Avenue
• Forest City Ratner
• MetroTech
• Pierrepont Plaza
• Atlantic Terminal
• New York Times Building
• Harlem Center
• Mack-Cali Realty Corporation
• Harborside Financial Center (Plaza 4 & 5)
• Plaza 1, Jersey City
• Reckson Associates
• Tower 45
(120 West 45th Street)
• Vornado Realty Trust
• 909 Third Avenue
18
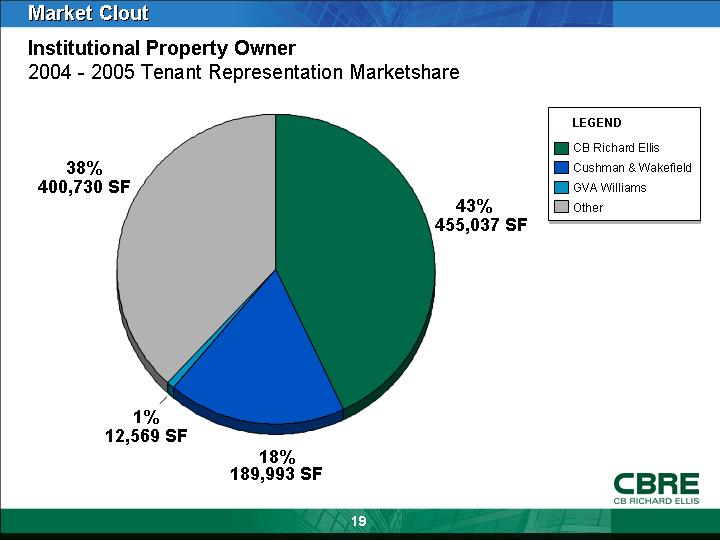
Institutional Property Owner
2004 - 2005 Tenant Representation Marketshare
[CHART]
19
CBRE Unique Value Proposition
• Market Clout
• Required Disciplines
• Specific Real-Time Data
20
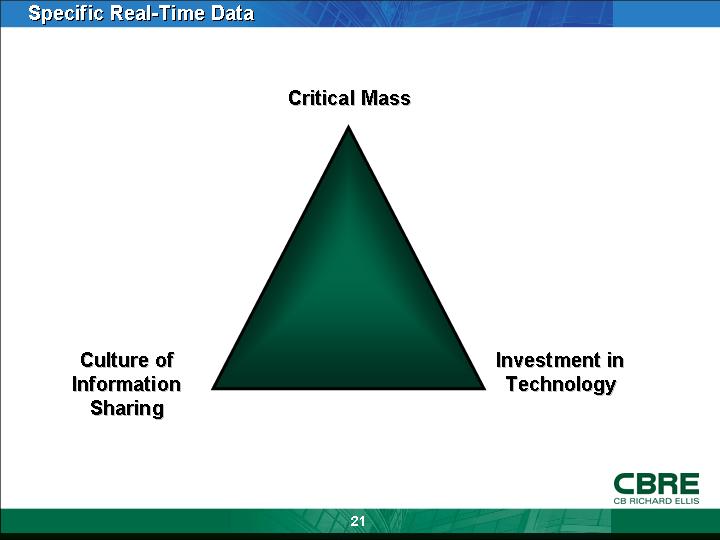
Specific Real-Time Data
[CHART]
21
|
|
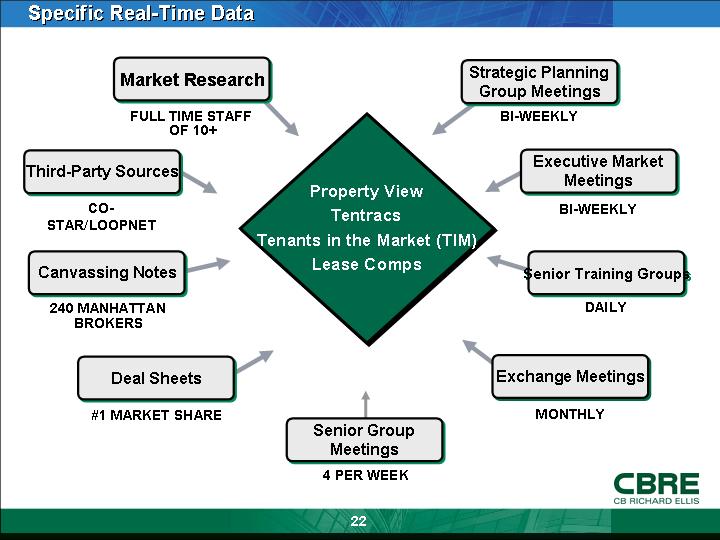
Market Research |
|
Strategic Planning |
|
||
|
|
FULL TIME STAFF |
|
Group Meetings |
|
||
|
|
|
|
|
|
||
|
Third-Party Sources |
|
|
|
Executive Market |
||
|
CO- |
|
Property View |
|
Meetings |
||
|
|
|
Tenants in the Market (TIM) |
|
|
||
|
|
|
Lease Comps |
|
|
||
|
Canvassing Notes |
|
|
|
Senior Training Groups |
||
|
240 MANHATTAN |
|
|
|
DAILY |
||
|
BROKERS |
|
|
|
|
||
|
|
|
|
|
|
||
|
|
Deal Sheets |
|
Exchange Meetings |
|
||
|
|
#1 MARKET SHARE |
|
MONTHLY |
|
||
|
|
|
Senior Group |
|
|
||
|
|
|
Meetings |
|
|
||
|
|
|
4 PER WEEK |
|
|
||
22
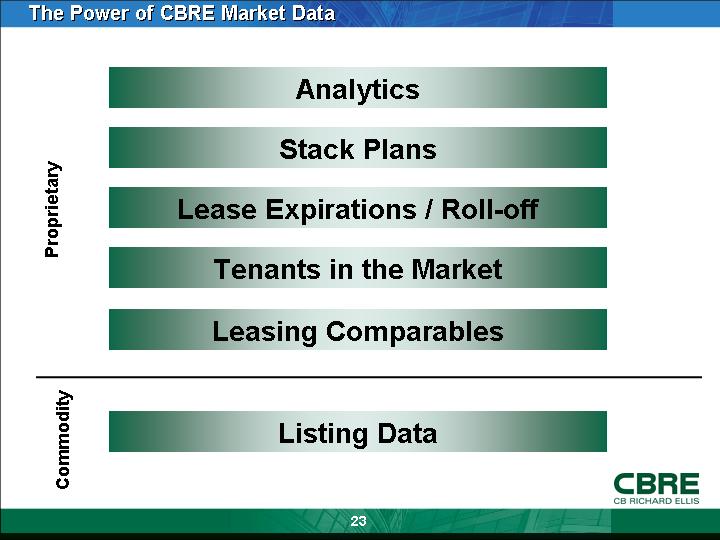
The Power of CBRE Market Data
Proprietary
Analytics
Stack Plans
Lease Expirations / Roll-off
Tenants in the Market
Leasing Comparables
Commodity
Listing Data
23
[LOGO]
24