Exhibit 99.7

Link to searchable text of slide shown above
Link to searchable text of slide shown above

Link to searchable text of slide shown above
Link to searchable text of slide shown above
Link to searchable text of slide shown above

Link to searchable text of slide shown above
Link to searchable text of slide shown above
Link to searchable text of slide shown above

Link to searchable text of slide shown above

Link to searchable text of slide shown above

Link to searchable text of slide shown above
Searchable text section of graphics shown above
Business Review Day
Investment Properties
Greg Vorwaller
President
March 23, 2005
[GRAPHIC]
[LOGO]
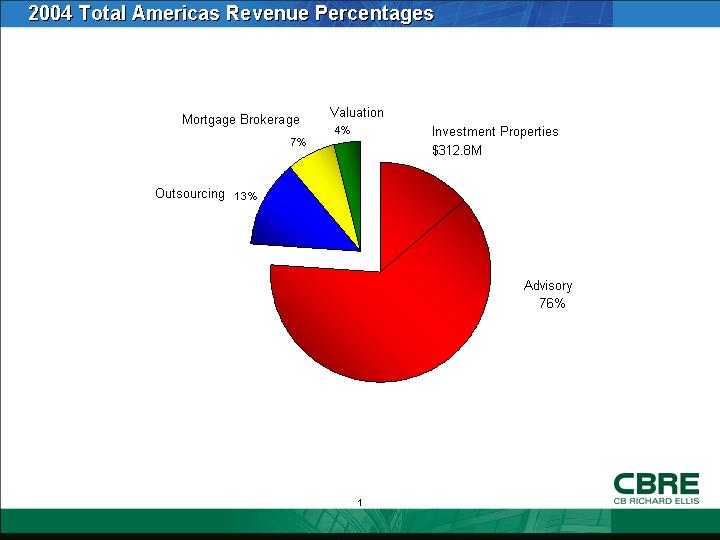
2004 Total Americas Revenue Percentages
[CHART]
1
Overview
Investment Properties advises investors and owners in the sale and acquisition of income producing properties
Property Sectors covered:
• Office
• Industrial
• Retail
• Multi-Housing
• Hotels
• Other growing niches, including Student Housing and Senior Housing
Services Include:
• Investment Valuations
• Investment Strategy Development
• Investment Brokerage
• Property & Portfolio Recapitalization
2
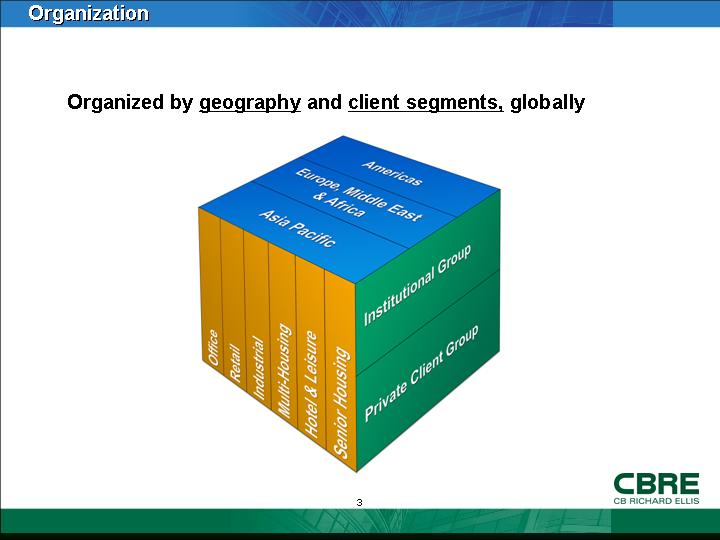
Organization
Organized by geography and client segments, globally
[CHART]
3
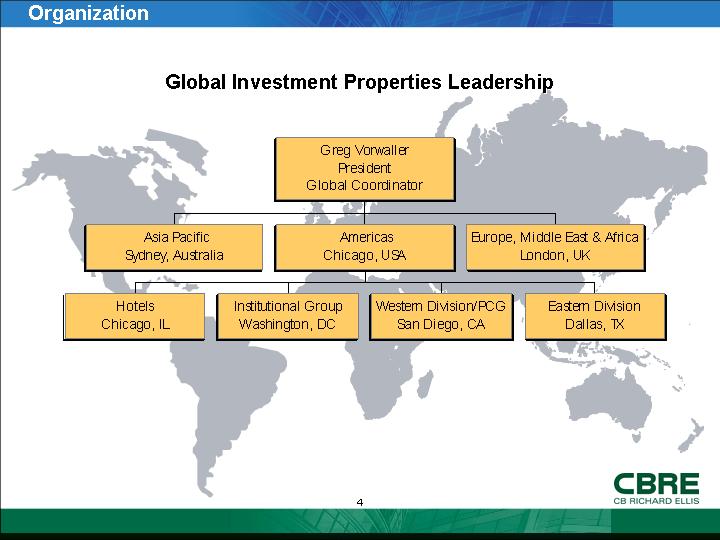
Global Investment Properties Leadership
[GRAPHIC]
|
Greg Vorwaller |
||||||||||
|
|
||||||||||
|
Asia Pacific |
|
Americas |
|
Europe, Middle East & Africa |
||||||
|
|
||||||||||
|
Hotels |
|
Institutional Group |
|
Western Division/PCG |
|
Eastern Division |
||||
4
Statistics
• A global business
• 600 sales professionals worldwide
• 350 in the US
• $60 Billion traded in 2004, $28 Billion in the US
• Ranked #1 for five years in the US for “Sales Over $5mm”
• Grew US sales by 65% compared with 50% for market
Source: Real Capital Analytics
5
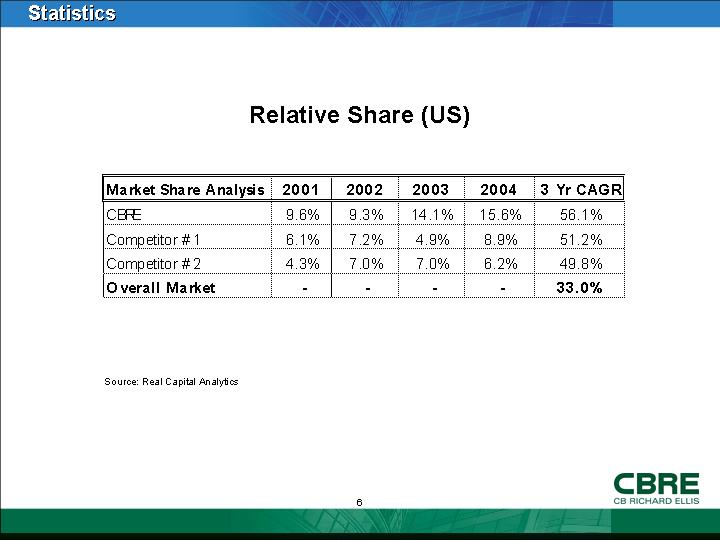
Relative Share (US)
|
Market Share Analysis |
|
2001 |
|
2002 |
|
2003 |
|
2004 |
|
3 Yr CAGR |
|
|
CBRE |
|
9.6 |
% |
9.3 |
% |
14.1 |
% |
15.6 |
% |
56.1 |
% |
|
Competitor #1 |
|
6.1 |
% |
7.2 |
% |
4.9 |
% |
8.9 |
% |
51.2 |
% |
|
Competitor #2 |
|
4.3 |
% |
7.0 |
% |
7.0 |
% |
6.2 |
% |
49.8 |
% |
|
Overall Market |
|
— |
|
— |
|
— |
|
— |
|
33.0 |
% |
Source: Real Capital Analytics
6
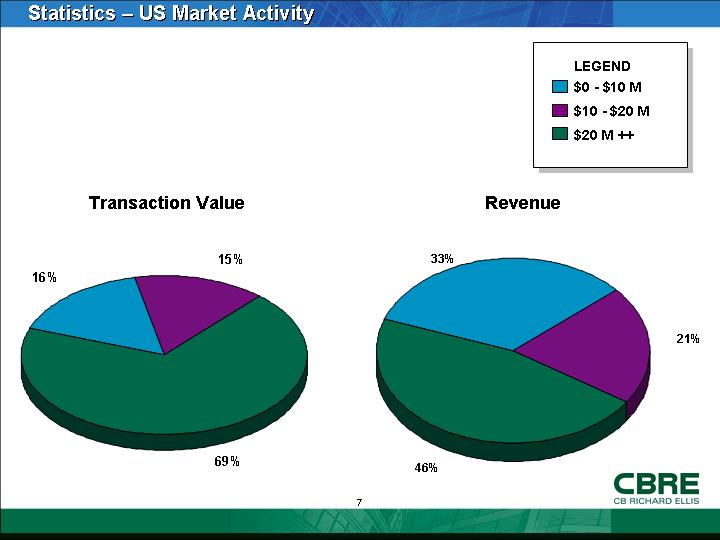
Statistics – US Market Activity
Transaction Value
[CHART]
Revenue
[CHART]
7
Key Business Drivers
• Demographically driven investor demand for income and value stability
• Permanent and increased role for real estate in institutional allocation models
• Globalization of capital flows
• Consolidation of service providers
• Aggregation of highly fragmented Private Client Market
8
2005 Strategic Priorities
• Continue to focus on institutional and private client segments – stay narrow and deep
• Acquire, retain and train talent with focus on key growth areas, e.g. Hotels
• Invest in enabling IT platforms to enhance client relationship management initiatives and improve overall execution efficiency and effectiveness
• Expand the integrated service linkage between L. J. Melody & Co. and the global platform
9
[LOGO]
10