Exhibit 99.6
Link to searchable text of slide shown above
Link to searchable text of slide shown above
Link to searchable text of slide shown above
Link to searchable text of slide shown above
Link to searchable text of slide shown above
Link to searchable text of slide shown above
Link to searchable text of slide shown above
Link to searchable text of slide shown above
Link to searchable text of slide shown above
Link to searchable text of slide shown above
Link to searchable text of slide shown above
Link to searchable text of slide shown above
Link to searchable text of slide shown above

Link to searchable text of slide shown above
Link to searchable text of slide shown above
Link to searchable text of slide shown above
Link to searchable text of slide shown above
Link to searchable text of slide shown above
Link to searchable text of slide shown above
Link to searchable text of slide shown above
Link to searchable text of slide shown above

Link to searchable text of slide shown above
Searchable text section of graphics shown above
Business Review Day
U.S. Brokerage
Jim Reid
President – Eastern Division
March 23, 2005
[GRAPHIC]
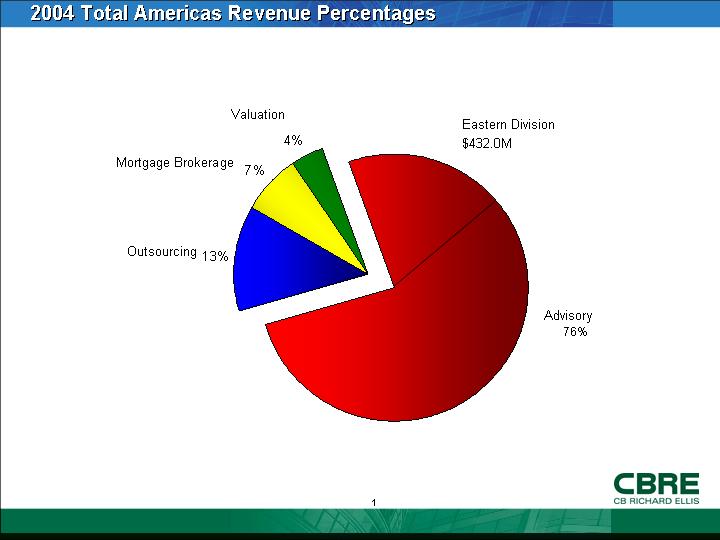
2004 Total Americas Revenue Percentages
[CHART]
[LOGO]
1
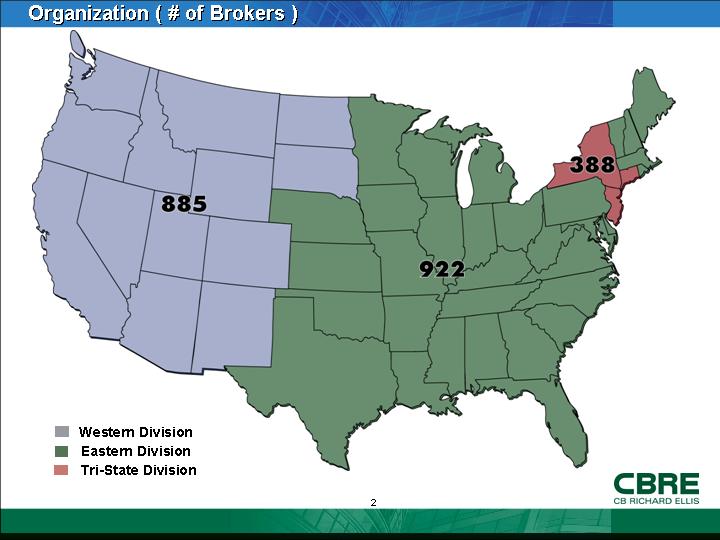
Organization ( # of Brokers )
[GRAPHIC]
2
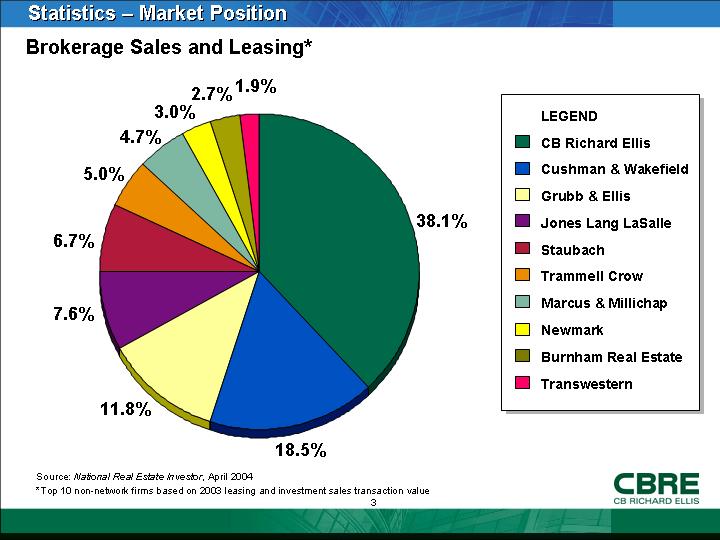
Statistics – Market Position
Brokerage Sales and Leasing*
[CHART]
Source: National Real Estate Investor, April 2004
*Top 10 non-network firms based on 2003 leasing and investment sales transaction value
3
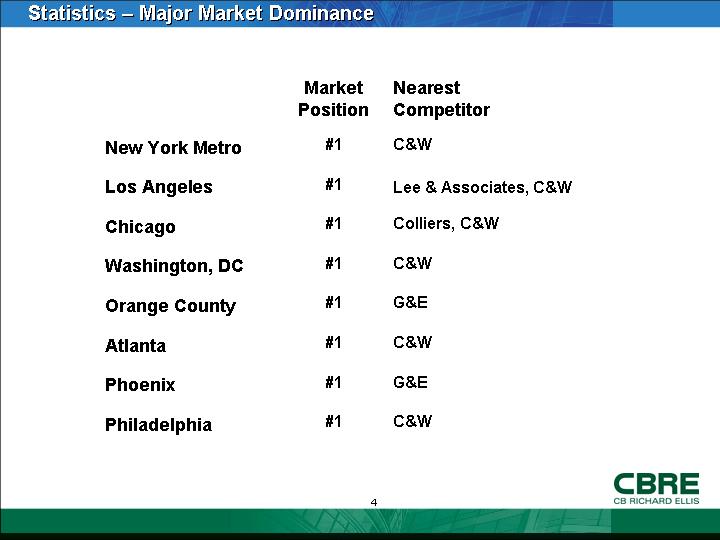
Statistics – Major Market Dominance
|
|
|
Market |
|
Nearest |
|
|
|
|
|
|
|
New York Metro |
|
#1 |
|
C&W |
|
|
|
|
|
|
|
Los Angeles |
|
#1 |
|
Lee & Associates, C&W |
|
|
|
|
|
|
|
Chicago |
|
#1 |
|
Colliers, C&W |
|
|
|
|
|
|
|
Washington, DC |
|
#1 |
|
C&W |
|
|
|
|
|
|
|
Orange County |
|
#1 |
|
G&E |
|
|
|
|
|
|
|
Atlanta |
|
#1 |
|
C&W |
|
|
|
|
|
|
|
Phoenix |
|
#1 |
|
G&E |
|
|
|
|
|
|
|
Philadelphia |
|
#1 |
|
C&W |
4
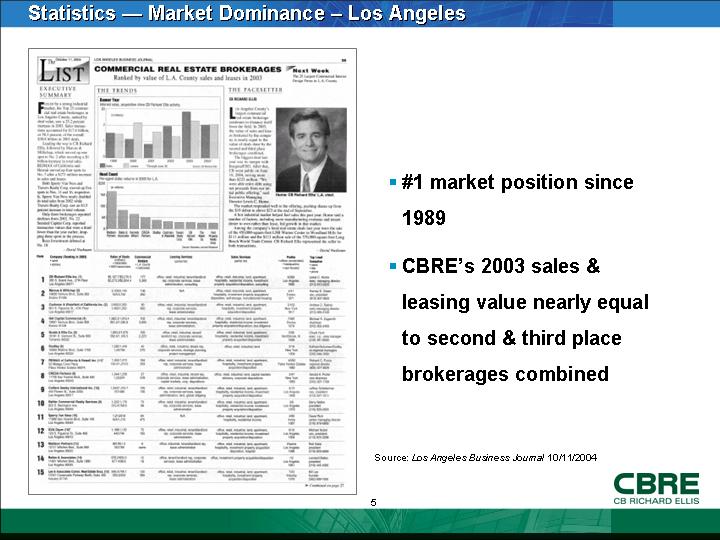
Statistics — Market Dominance – Los Angeles
[GRAPHIC]
• #1 market position since 1989
• CBRE’s 2003 sales & leasing value nearly equal to second & third place brokerages combined
Source: Los Angeles Business Journal 10/11/2004
5
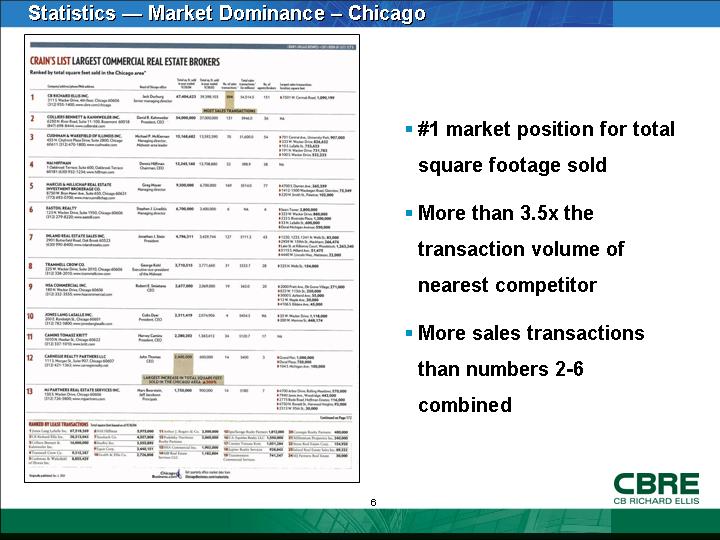
Statistics — Market Dominance – Chicago
[GRAPHIC]
• #1 market position for total square footage sold
• More than 3.5x the transaction volume of nearest competitor
• More sales transactions than numbers 2-6 combined
6
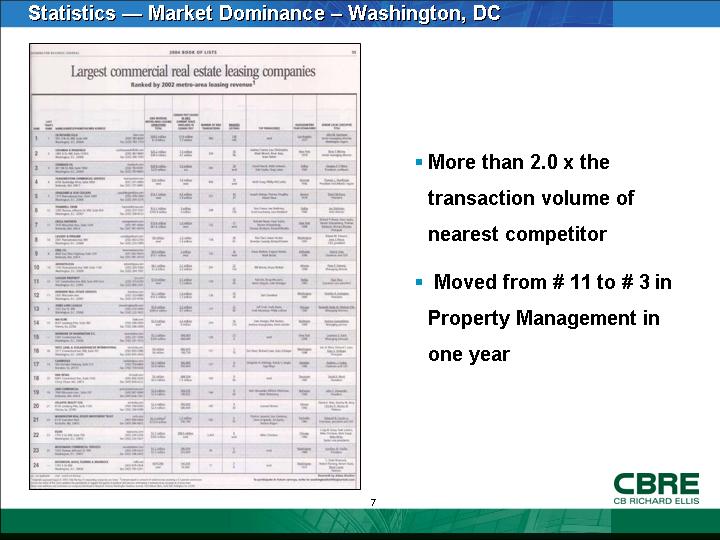
Statistics — Market Dominance – Washington, DC
[GRAPHIC]
• More than 2.0 x the transaction volume of nearest competitor
• Moved from # 11 to # 3 in Property Management in one year
7
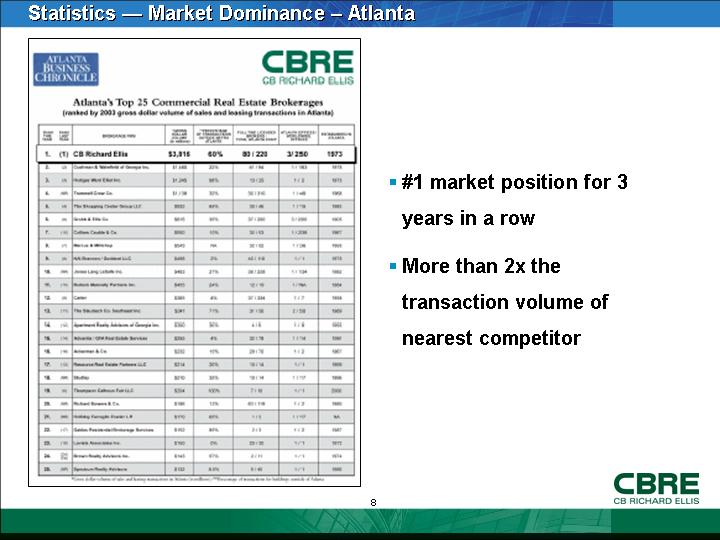
Statistics — Market Dominance – Atlanta
[GRAPHIC]
• #1 market position for 3 years in a row
• More than 2x the transaction volume of nearest competitor
8
Strategic Priorities
• Broker Retention
• Managed Brokerage
• Targeted Recruitment
• Professional Development
9
Strategic Priorities – Broker Retention
• Low annual attrition rate over time
• 44% broker productivity gain in 2004
• Best platform to do business
• Global footprint
• Breadth of services
• Technology and other support
10
Strategic Priorities – Managed Brokerage
• A brokerage unit that emphasizes
• client-driven teams
• broker accountability
• market intelligence and sharing of information
• Within a framework of
• active, centralized sales management
• superior support services
11
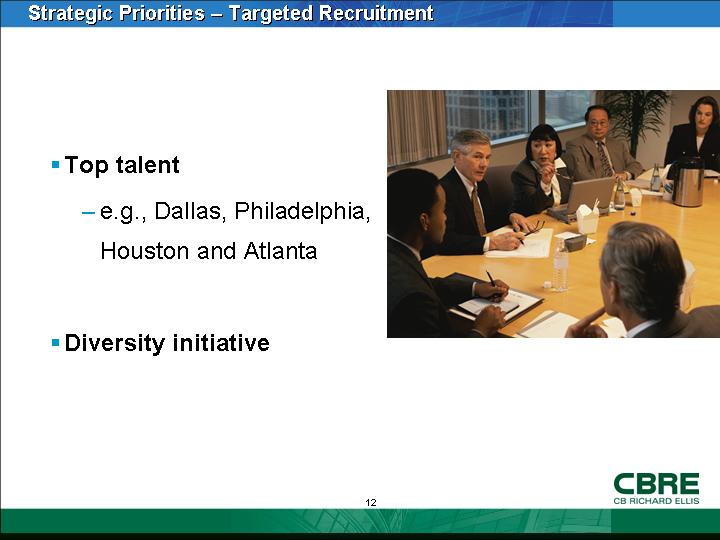
Strategic Priorities – Targeted Recruitment
• Top talent
• e.g., Dallas, Philadelphia, Houston and Atlanta
• Diversity initiative
[GRAPHIC]
12
Strategic Priorities – Professional Development
[GRAPHIC]
• CBRE University
• The Leadership Center and its core training facility, the CBRE University, were created to support and promote learning at all levels of our organization by putting thinking and learning at the forefront of everything we do
13
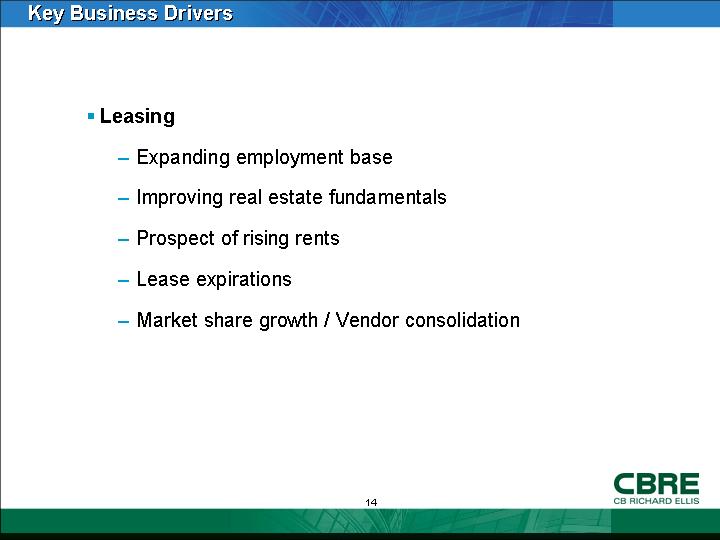
Key Business Drivers
• Leasing
• Expanding employment base
• Improving real estate fundamentals
• Prospect of rising rents
• Lease expirations
• Market share growth / Vendor consolidation
14
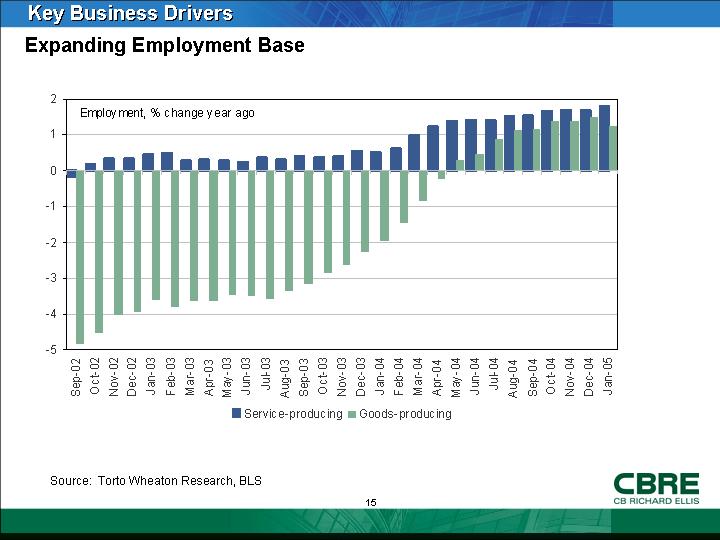
Expanding Employment Base
[CHART]
Source: Torto Wheaton Research, BLS
15
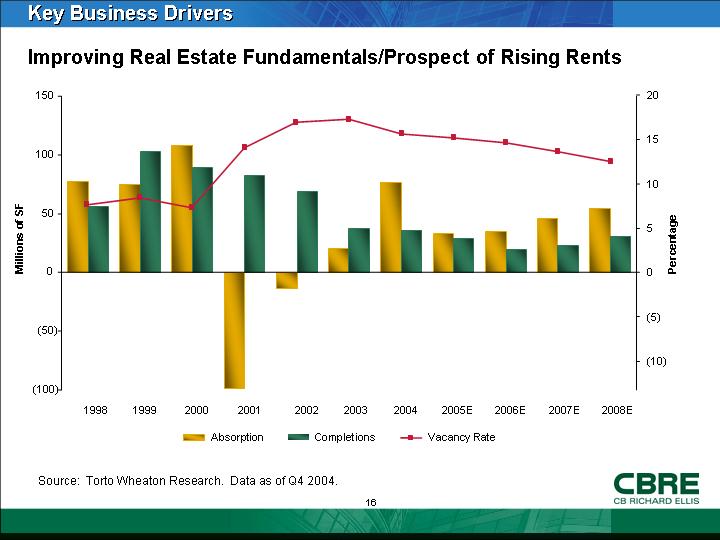
Improving Real Estate Fundamentals/Prospect of Rising Rents
[CHART]
Source: Torto Wheaton Research. Data as of Q4 2004.
16
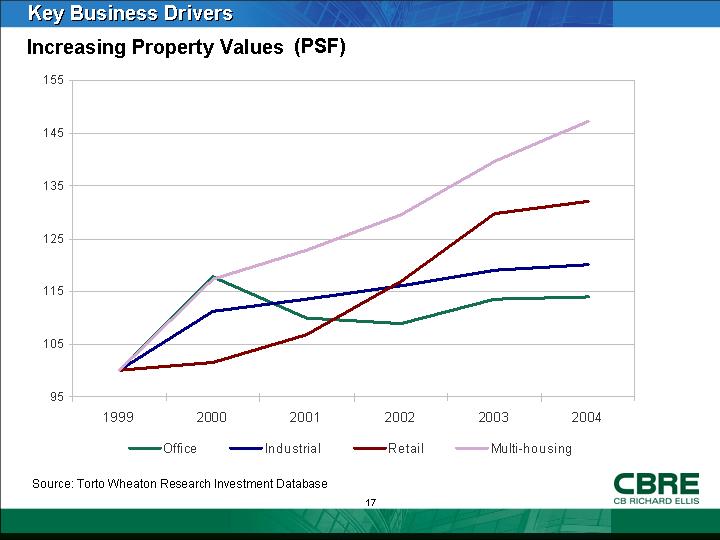
Increasing Property Values (PSF)
[CHART]
Source: Torto Wheaton Research Investment Database
17
Recent Wins
Tenant Rep
• Citgo relocated its 250,000 square foot headquarters from Oklahoma to Houston, the largest corporate relocation to Houston in ten years
• RR Donnelly leased 108,000 square feet at 111 South Wacker Drive in downtown Chicago
• Jones Day leased 163,000 square-feet at the former Arco Plaza (555 S. Flower Street) in Los Angeles
• Norfolk Southern Railway closed on a 420,000 square-foot regional headquarters lease in Atlanta’s Midtown sub-market
• UK-based Shire Pharmaceuticals established its North American headquarters in a 220,000 square-foot lease in suburban Philadelphia
• America Online leased 103,000 square-feet in Dulles, VA outside Washington, DC
18
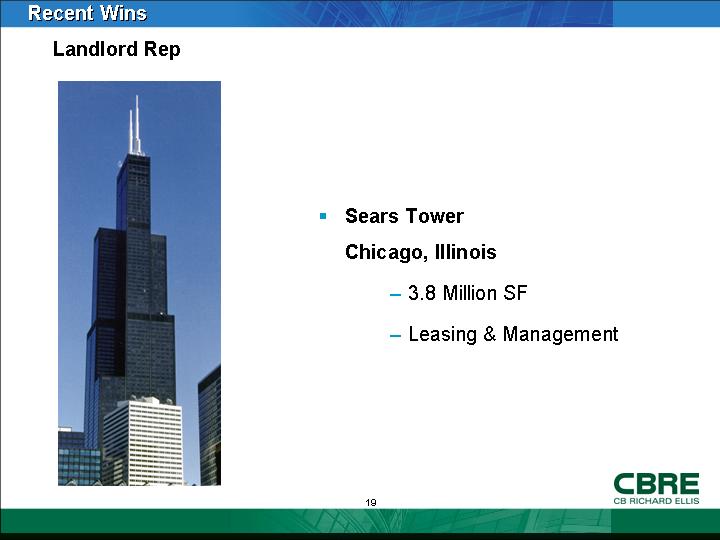
Landlord Rep
[GRAPHIC]
• Sears Tower
Chicago, Illinois
• 3.8 Million SF
• Leasing & Management
19
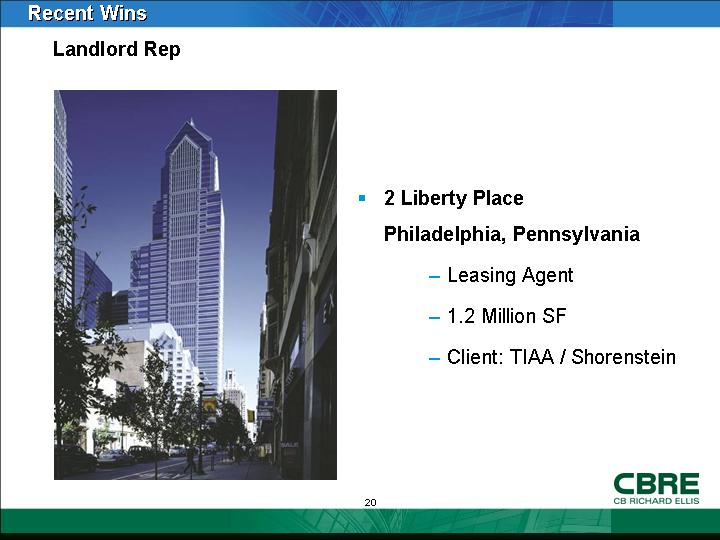
• 2 Liberty Place
Philadelphia, Pennsylvania
• Leasing Agent
• 1.2 Million SF
• Client: TIAA / Shorenstein
20
[LOGO]
21