Exhibit 99.4
Link to searchable text of slide shown above
Link to searchable text of slide shown above
Link to searchable text of slide shown above
Link to searchable text of slide shown above
Link to searchable text of slide shown above
Link to searchable text of slide shown above
Link to searchable text of slide shown above
Link to searchable text of slide shown above
Link to searchable text of slide shown above
Link to searchable text of slide shown above
Link to searchable text of slide shown above
Link to searchable text of slide shown above
Link to searchable text of slide shown above
Link to searchable text of slide shown above

Link to searchable text of slide shown above
Searchable text section of graphics shown above
Business Review Day
L.J. Melody & Company
Brian Stoffers
Chief Operating Officer
March 23, 2005
[GRAPHIC]
[LOGO]
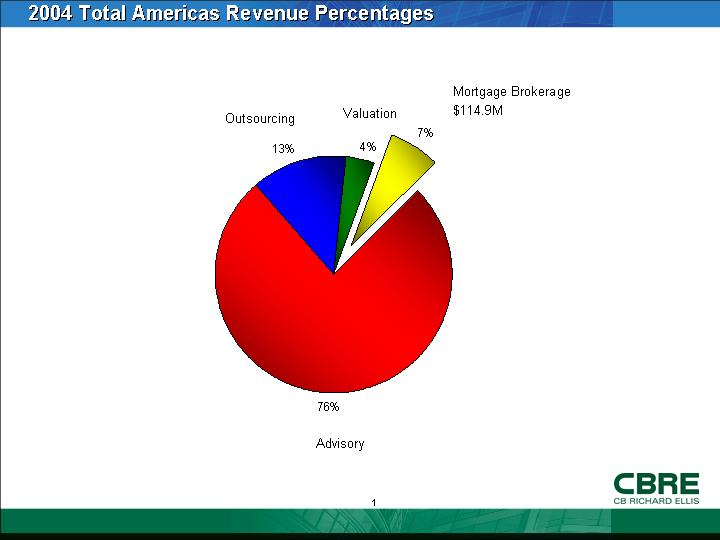
2004 Total Americas Revenue Percentages
[CHART]
1
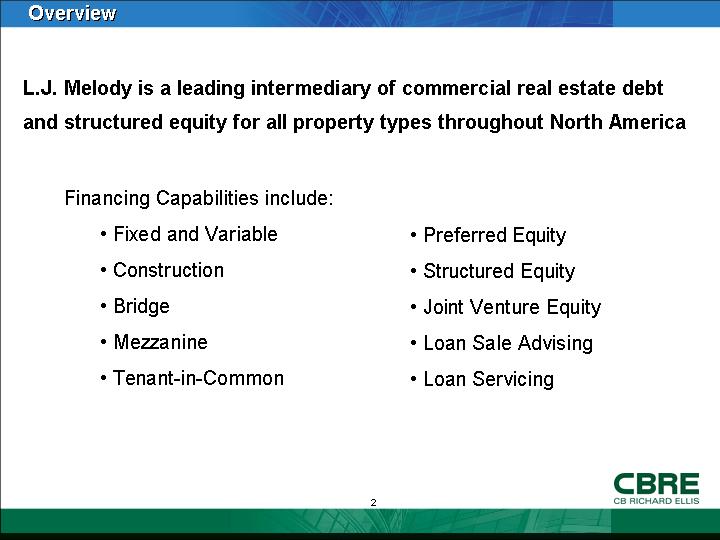
Overview
L.J. Melody is a leading intermediary of commercial real estate debt and structured equity for all property types throughout North America
Financing Capabilities include:
• Fixed and Variable
• Construction
• Bridge
• Mezzanine
• Tenant-in-Common
• Preferred Equity
• Structured Equity
• Joint Venture Equity
• Loan Sale Advising
• Loan Servicing
2
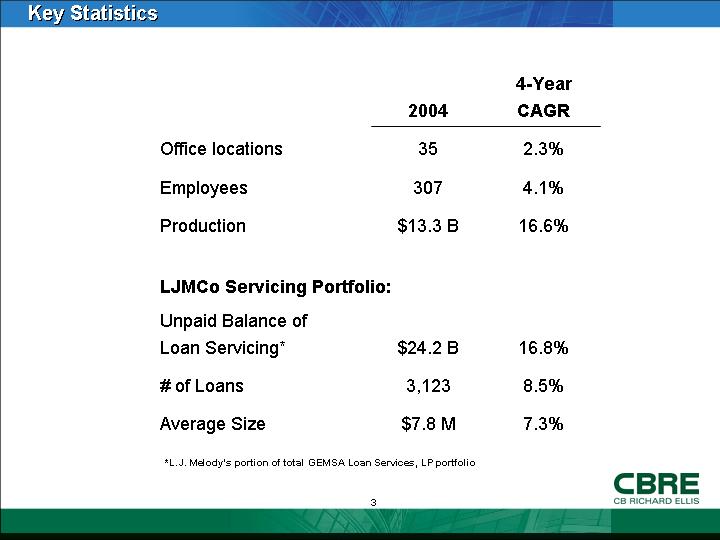
Key Statistics
|
|
|
2004 |
|
4-Year |
|
|
|
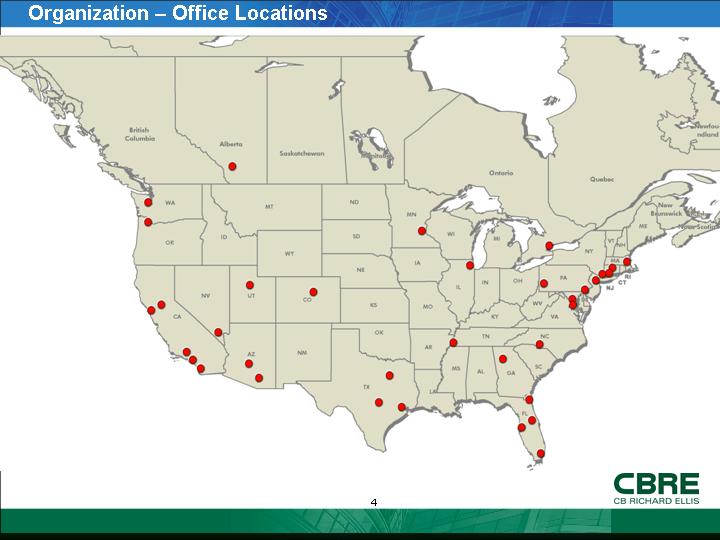
Office locations |
|
35 |
|
2.3 |
% |
|
|
|
|
|
|
|
|
|
|
Employees |
|
307 |
|
4.1 |
% |
|
|
|
|
|
|
|
|
|
|
Production |
|
$ |
13.3 |
B |
16.6 |
% |
|
|
|
|
|
|
|
|
|
LJMCo Servicing Portfolio: |
|
|
|
|
|
|
|
|
|
|
|
|
|
|
|
Unpaid Balance of Loan Servicing* |
|
$ |
24.2 |
B |
16.8 |
% |
|
|
|
|
|
|
|
|
|
# of Loans |
|
3,123 |
|
8.5 |
% |
|
|
|
|
|
|
|
|
|
|
Average Size |
|
$ |
7.8 |
M |
7.3 |
% |
*L.J. Melody’s portion of total GEMSA Loan Services, LP portfolio
3
Organization – Office Locations
[GRAPHIC]
4
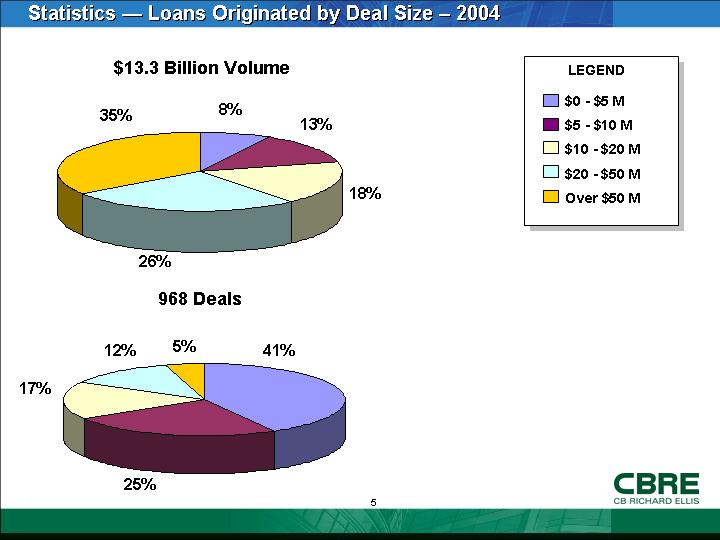
Statistics — Loans Originated by Deal Size – 2004
$13.3 Billion Volume
[CHART]
968 Deals
[CHART]
5
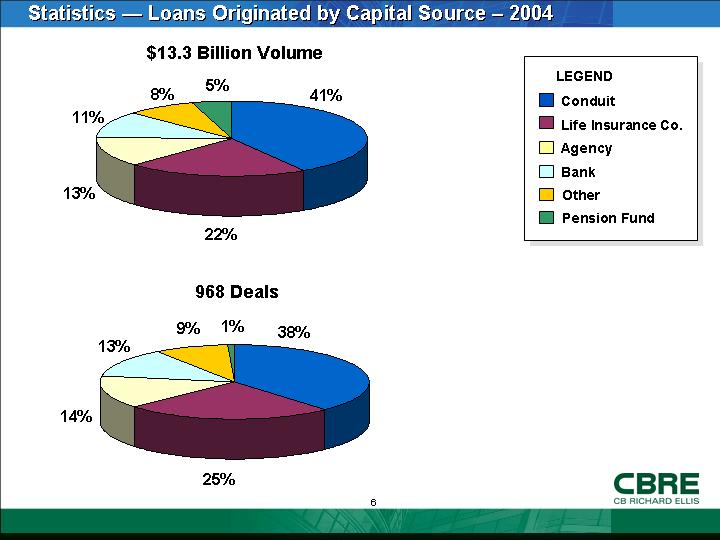
Statistics — Loans Originated by Capital Source – 2004
$13.3 Billion Volume
[CHART]
968 Deals
[CHART]
6
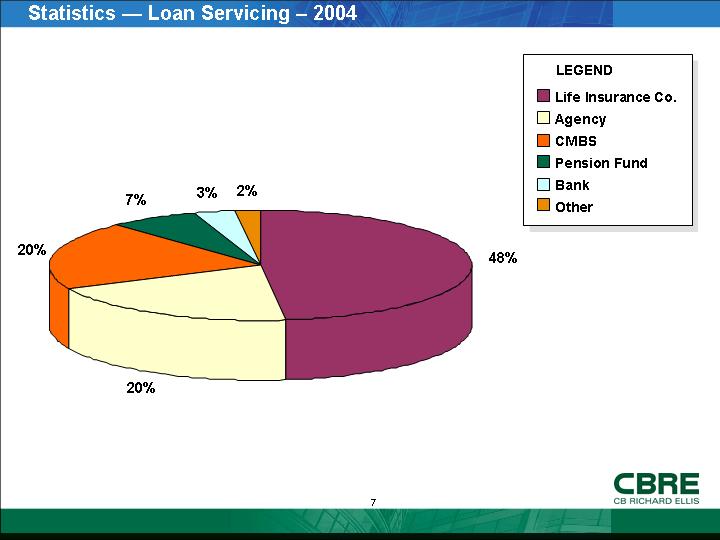
Statistics — Loan Servicing – 2004
[CHART]
7
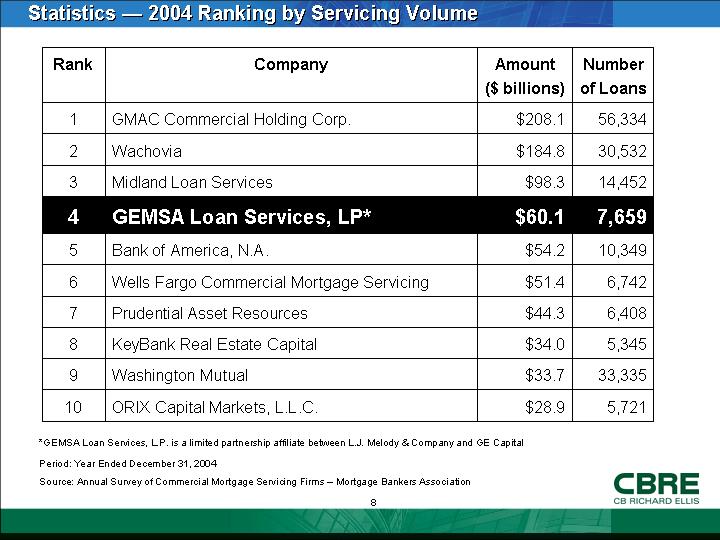
Statistics — 2004 Ranking by Servicing Volume
|
Rank |
|
Company |
|
Amount |
|
Number |
|
|
|
|
|
|
|
($ billions) |
|
|
|
|
|
1 |
|
GMAC Commercial Holding Corp. |
|
$ |
208.1 |
|
56,334 |
|
|
2 |
|
Wachovia |
|
$ |
184.8 |
|
30,532 |
|
|
3 |
|
Midland Loan Services |
|
$ |
98.3 |
|
14,452 |
|
|
4 |
|
GEMSA Loan Services, LP* |
|
$ |
60.1 |
|
7,659 |
|
|
5 |
|
Bank of America, N.A. |
|
$ |
54.2 |
|
10,349 |
|
|
6 |
|
Wells Fargo Commercial Mortgage Servicing |
|
$ |
51.4 |
|
6,742 |
|
|
7 |
|
Prudential Asset Resources |
|
$ |
44.3 |
|
6,408 |
|
|
8 |
|
KeyBank Real Estate Capital |
|
$ |
34.0 |
|
5,345 |
|
|
9 |
|
Washington Mutual |
|
$ |
33.7 |
|
33,335 |
|
|
10 |
|
ORIX Capital Markets, L.L.C. |
|
$ |
28.9 |
|
5,721 |
|
*GEMSA Loan Services, L.P. is a limited partnership affiliate between L.J. Melody & Company and GE Capital
Period: Year Ended December 31, 2004
Source: Annual Survey of Commercial Mortgage Servicing Firms – Mortgage Bankers Association
8
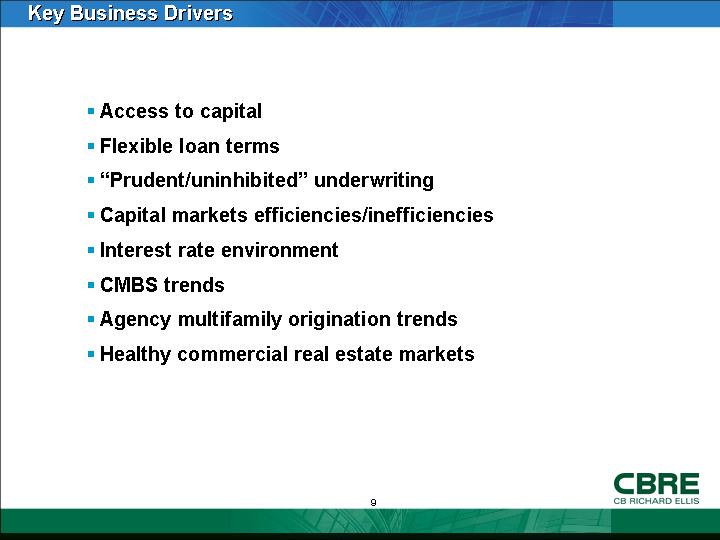
Key Business Drivers
• Access to capital
• Flexible loan terms
• “Prudent/uninhibited” underwriting
• Capital markets efficiencies/inefficiencies
• Interest rate environment
• CMBS trends
• Agency multifamily origination trends
• Healthy commercial real estate markets
9
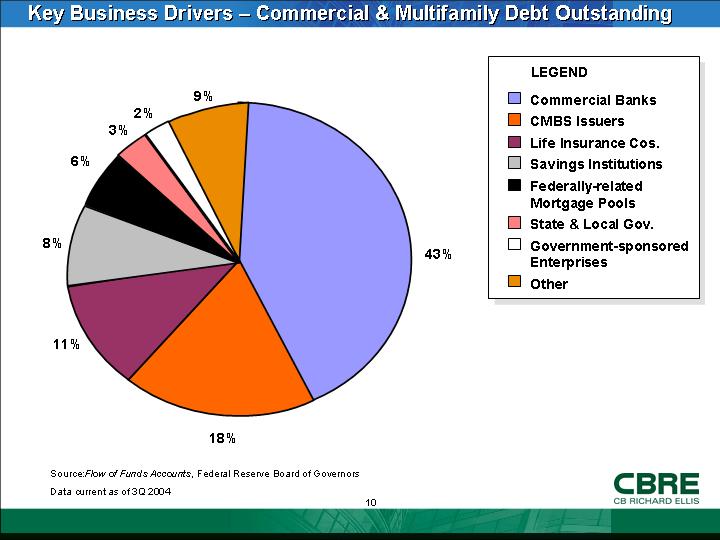
Key Business Drivers – Commercial & Multifamily Debt Outstanding
[CHART]
Source: Flow of Funds Accounts, Federal Reserve Board of Governors
Data current as of 3Q 2004
10
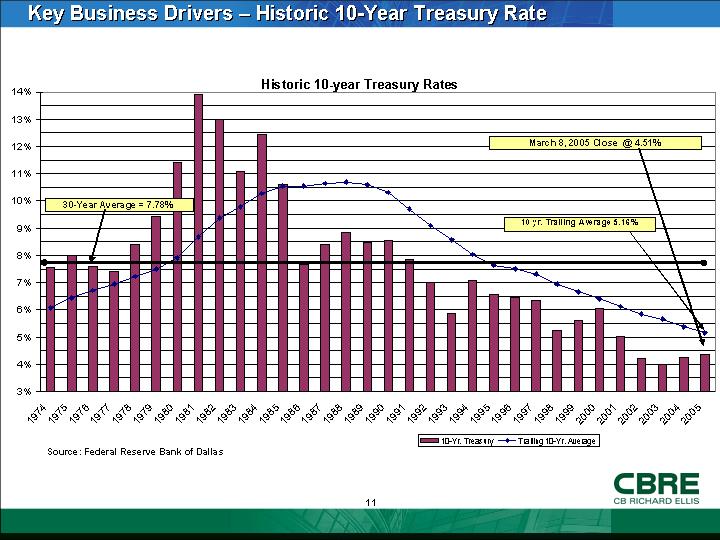
Key Business Drivers – Historic 10-Year Treasury Rate
Historic 10-year Treasury Rates
[CHART]
Source: Federal Reserve Bank of Dallas
11
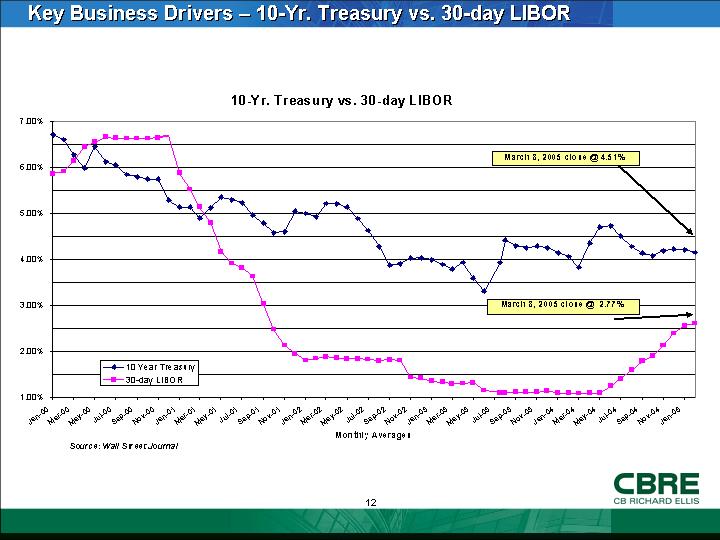
Key Business Drivers – 10-Yr. Treasury vs. 30-day LIBOR
10-Yr. Treasury vs. 30-day LIBOR
[CHART]
Source: Wall Street Journal
12
2005 Strategies Initiatives
• Large loan/conduit CMBS program
• IP Initiatives
• GEMSA marketing
• Multifamily lending platform
• High profile/strategic hires in key markets
• International expansion
• Implement technology-based systems
13
[LOGO]
14