Exhibit 99.2

Link to searchable text of slide shown above
Link to searchable text of slide shown above

Link to searchable text of slide shown above
Link to searchable text of slide shown above
Link to searchable text of slide shown above
Link to searchable text of slide shown above
Link to searchable text of slide shown above
Link to searchable text of slide shown above
Link to searchable text of slide shown above
Link to searchable text of slide shown above
Link to searchable text of slide shown above
Link to searchable text of slide shown above
Link to searchable text of slide shown above
Link to searchable text of slide shown above
Link to searchable text of slide shown above

Link to searchable text of slide shown above
Searchable text section of graphics shown above
Business Review Day
EMEA Region
Michael Strong
EMEA Chairman
March 23, 2005
[GRAPHIC]
[LOGO]
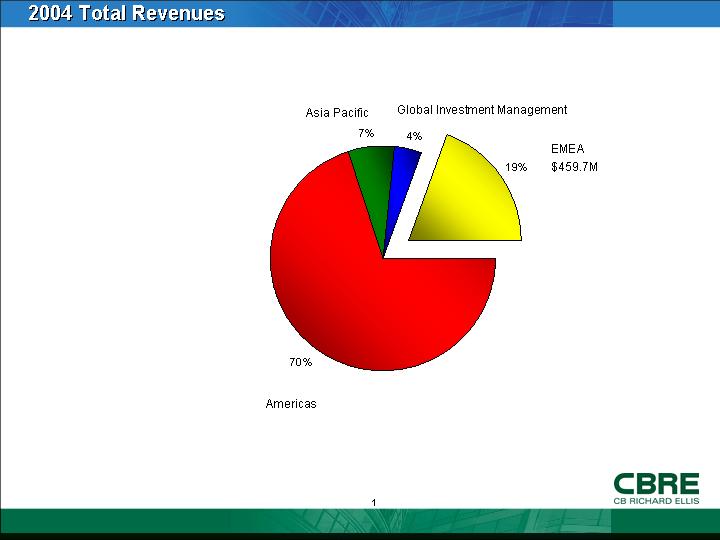
2004 Total Revenues
[CHART]
1
Overview
• 3,600 employees in 29 countries*
• Commercial investment sales activity of $27 billion
• Commercial leasing activity of nearly 22 million square feet
• Properties under management of 122 million square feet
• Appraisal and Consultation properties valued at $216 billion
* includes affiliate offices
2
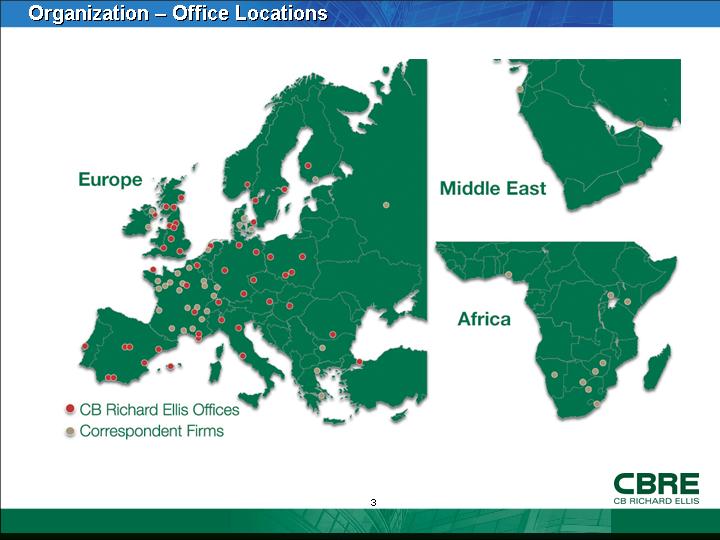
Organization – Office Locations
[GRAPHIC]
3
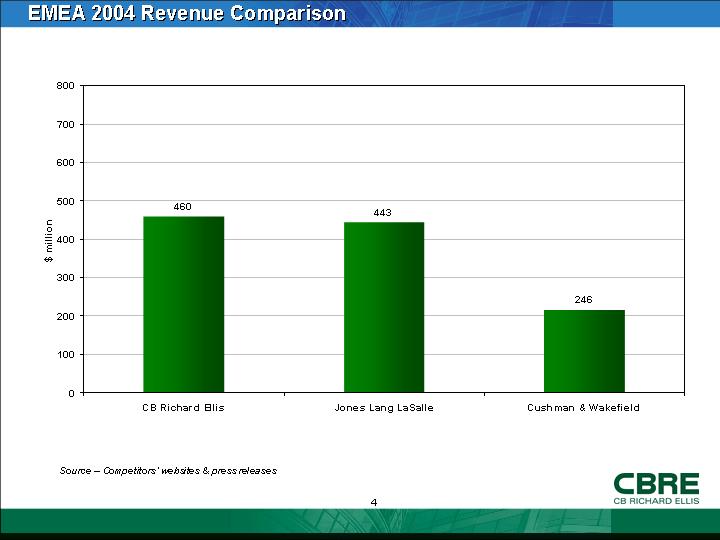
EMEA 2004 Revenue Comparison
[CHART]
Source – Competitors’ websites & press releases
4
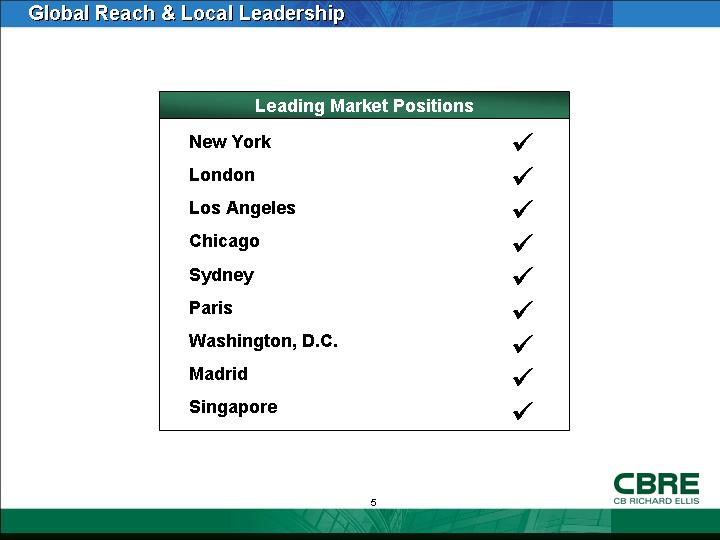
Global Reach & Local Leadership
Leading Market Positions
|
New York |
|
ý |
|
London |
|
ý |
|
Los Angeles |
|
ý |
|
Chicago |
|
ý |
|
Sydney |
|
ý |
|
Paris |
|
ý |
|
Washington, D.C. |
|
ý |
|
Madrid |
|
ý |
|
Singapore |
|
ý |
5
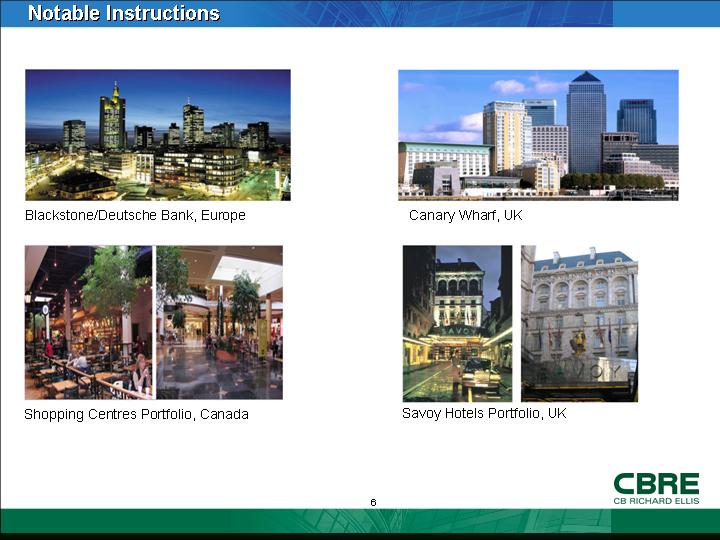
Notable Instructions
[GRAPHIC]
Blackstone/Deutsche Bank, Europe
[GRAPHIC]
Canary Wharf, UK
[GRAPHIC]
Shopping Centres Portfolio, Canada
[GRAPHIC]
Savoy Hotels Portfolio, UK
6
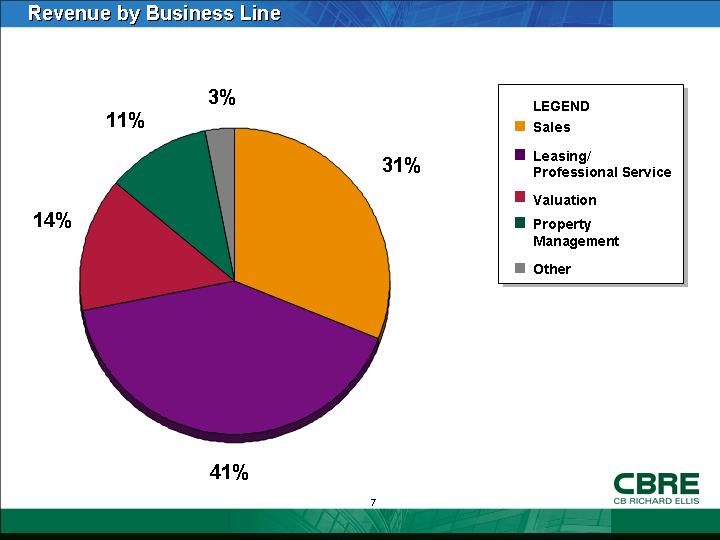
Revenue by Business Line
[CHART]
7
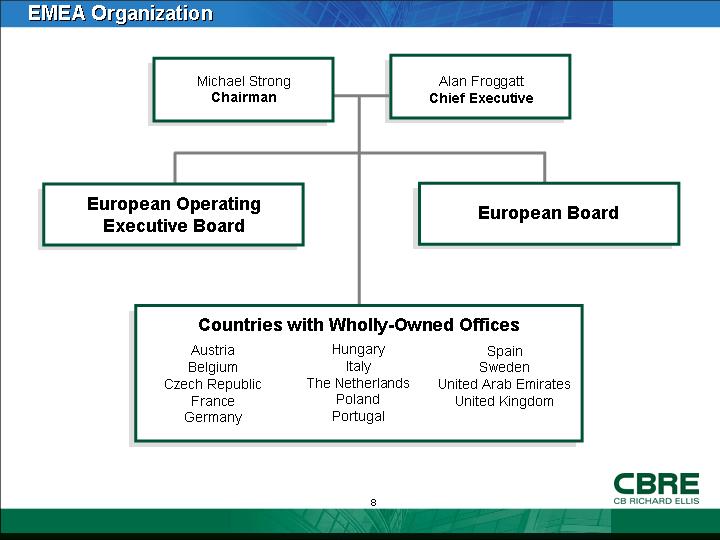
EMEA Organization
|
Michael Strong |
|
|
|
Alan Froggatt |
|
|
|
|
|
|
|
European
Operating |
|
|
|
European Board |
|
|
|
|
|
|
|
Countries with Wholly-Owned Offices |
||||
|
|
||||
|
Austria |
|
Hungary |
|
Spain |
8
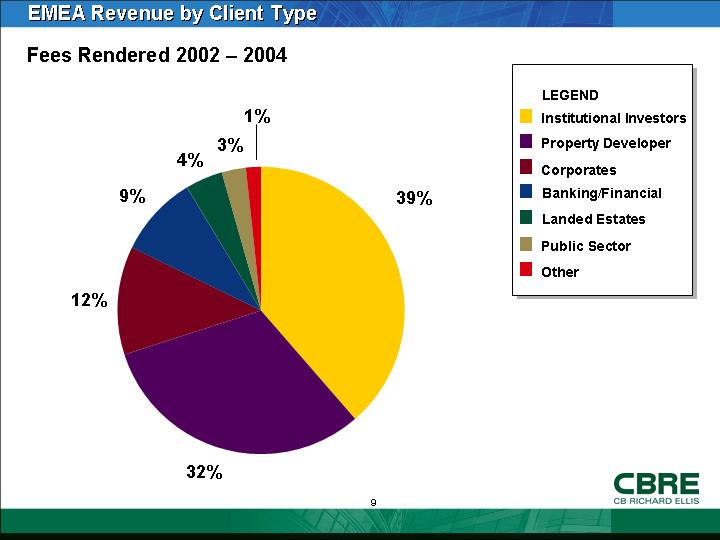
EMEA Revenue by Client Type
Fees Rendered 2002 – 2004
[CHART]
9
Strategic Initiatives
• Infrastructure
• Cross border programs
• Brand leadership
• Clients
10
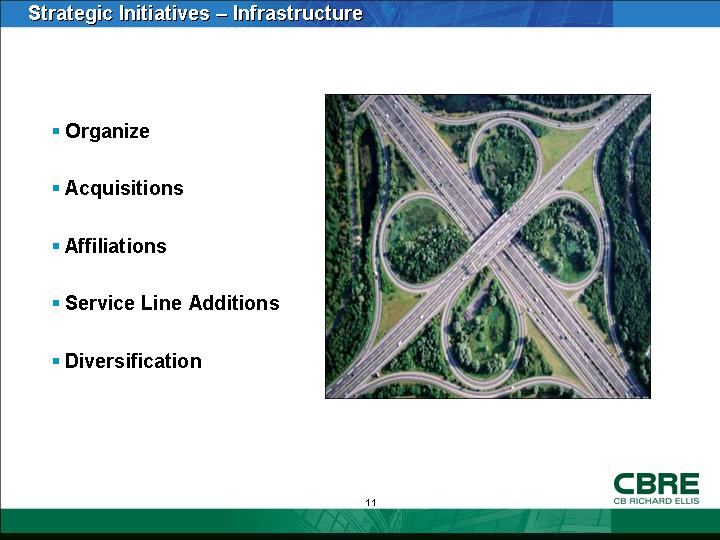
Strategic Initiatives – Infrastructure
• Organize
• Acquisitions
• Affiliations
• Service Line Additions
• Diversification
[GRAPHIC]
11
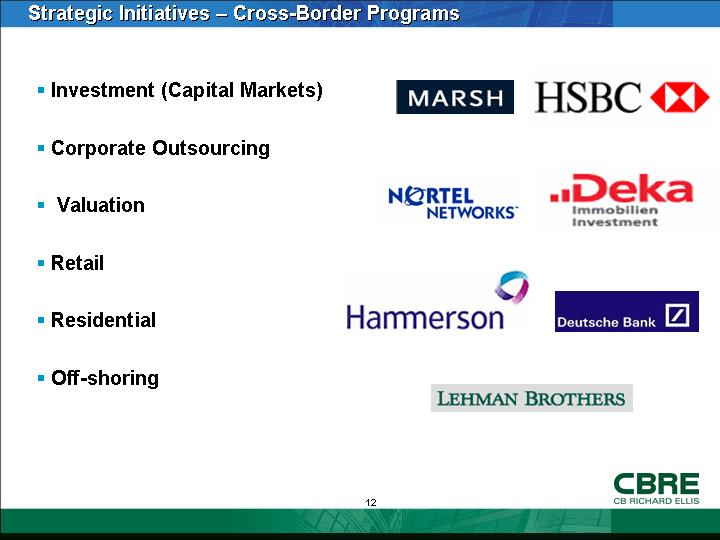
Strategic Initiatives – Cross-Border Programs
• Investment (Capital Markets)
• Corporate Outsourcing
• Valuation
• Retail
• Residential
• Off-shoring
[LOGO]
12
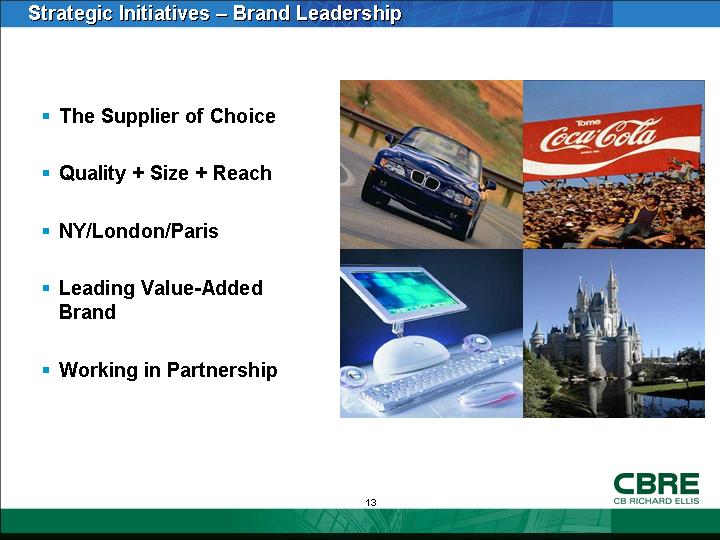
Strategic Initiatives – Brand Leadership
• The Supplier of Choice
• Quality + Size + Reach
• NY/London/Paris
• Leading Value-Added Brand
• Working in Partnership
[GRAPHIC]
13
Strategic Initiatives – Clients
• Key Client Program (CRM)
• Key Target Program (Pursuit)
• Multiple Service Delivery (Gap Analysis)
[GRAPHIC]
14
[LOGO]
15