Exhibit 99.1
Link to searchable text of slide shown above
Link to searchable text of slide shown above
Link to searchable text of slide shown above

Link to searchable text of slide shown above
Link to searchable text of slide shown above
Link to searchable text of slide shown above
Link to searchable text of slide shown above
Link to searchable text of slide shown above
Link to searchable text of slide shown above
Link to searchable text of slide shown above
Link to searchable text of slide shown above
Link to searchable text of slide shown above

Link to searchable text of slide shown above
Link to searchable text of slide shown above
Link to searchable text of slide shown above
Link to searchable text of slide shown above
Link to searchable text of slide shown above

Link to searchable text of slide shown above
Link to searchable text of slide shown above
Link to searchable text of slide shown above
Link to searchable text of slide shown above
Link to searchable text of slide shown above
Link to searchable text of slide shown above
Link to searchable text of slide shown above
Link to searchable text of slide shown above
Link to searchable text of slide shown above
Link to searchable text of slide shown above

Link to searchable text of slide shown above
Link to searchable text of slide shown above
Link to searchable text of slide shown above
Link to searchable text of slide shown above

Link to searchable text of slide shown above
Searchable text section of graphics shown above
[LOGO]
CSFB 7th Annual Global Services
Growth Conference
March 15,
2005
[LOGO]
Forward Looking Statements
This presentation contains statements that are forward looking within the meaning of the Private Securities Litigation Reform Act of 1995. These statements should be considered as estimates only and actual results may ultimately differ from these estimates. Except to the extent required by applicable securities laws, CB Richard Ellis undertakes no obligation to update or publicly revise any of the forward-looking statements that you may hear today. Please refer to our annual report on Form 10-K and our quarterly reports on Form 10-Q, which are filed with the SEC and available at the SEC’s website (http://www.sec.gov), for a full discussion of the risks and other factors, that may impact any estimates that you may hear today. Our responses to questions must be limited to information that is acceptable for dissemination within the public domain. In addition, we may make certain statements during the course of this presentation which include references to “non-GAAP financial measures,” as defined by SEC regulations. As required by these regulations, we have provided reconciliations of these measures to what we believe are the most directly comparable GAAP measures, which are available in the fourth quarter earnings press release.
1
Participants
Brett White – President
Ken Kay – Senior Executive Vice President and Chief Financial Officer
2
Overview
3
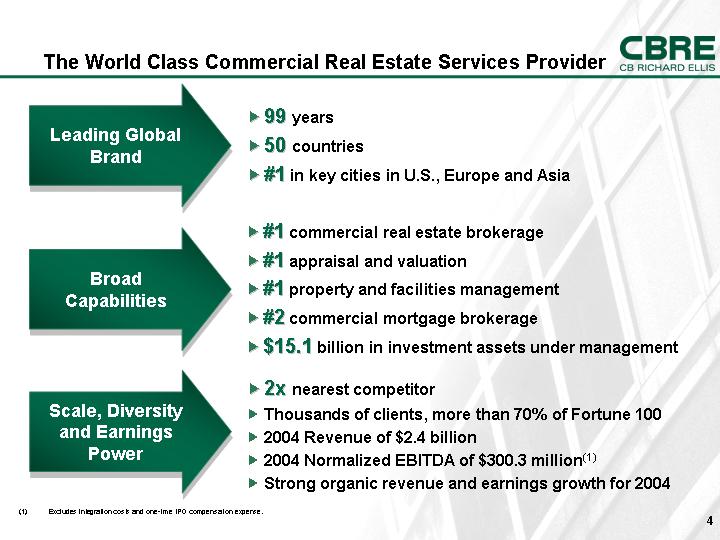
The World Class Commercial Real Estate Services Provider
|
Leading Global |
|
• 99 years |
|
|
• 50 countries |
|
|
|
• #1 in key cities in U.S., Europe and Asia |
|
|
|
|
|
|
Broad |
|
• #1 commercial real estate brokerage |
|
|
• #1 appraisal and valuation |
|
|
|
• #1 property and facilities management |
|
|
|
• #2 commercial mortgage brokerage |
|
|
|
• $15.1 billion in investment assets under management |
|
|
|
|
|
|
Scale, Diversity |
|
• 2x nearest competitor |
|
|
• Thousands of clients, more than 70% of Fortune 100 |
|
|
|
• 2004 Revenue of $2.4 billion |
|
|
|
• 2004 Normalized EBITDA of $300.3 million(1) |
|
|
|
• Strong organic revenue and earnings growth for 2004 |
(1) Excludes integration costs and one-time IPO compensation expense.
4
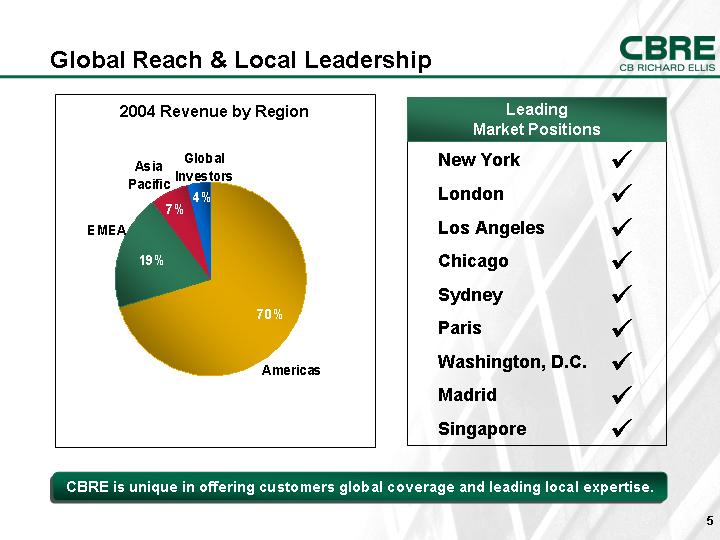
Global Reach & Local Leadership
2004 Revenue by Region
[CHART]
Leading
Market Positions
|
New York |
|
|
|
|
|
London |
|
|
|
|
|
Los Angeles |
|
|
|
|
|
Chicago |
|
|
|
|
|
Sydney |
|
|
|
|
|
Paris |
|
|
|
|
|
Washington, D.C. |
|
|
|
|
|
Madrid |
|
|
|
|
|
Singapore |
|
CBRE is unique in offering customers global coverage and leading local expertise.
5
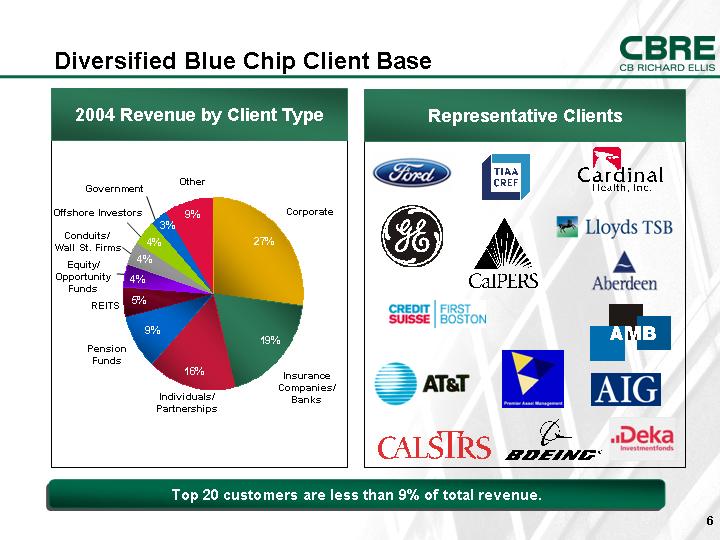
Diversified Blue Chip Client Base
2004 Revenue by Client Type
[CHART]
Representative Clients
[LOGO]
Top 20 customers are less than 9% of total revenue.
6
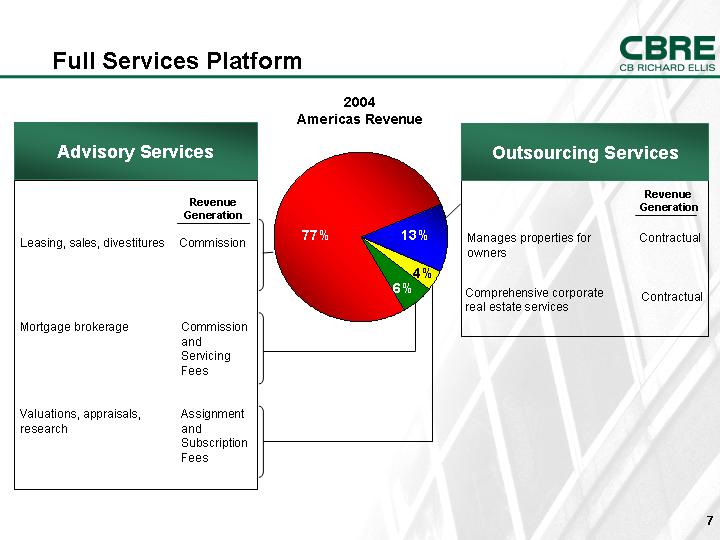
Full Services Platform
2004
Americas Revenue
|
Advisory Services |
|
Outsourcing Services |
|
||||
|
|
|
Revenue |
|
|
|
Revenue |
|
|
|
|
Generation |
|
|
|
Generation |
|
|
|
|
|
[CHART] |
|
|
|
|
|
Leasing, sales, divestitures |
|
Commission |
|
Manages properties for owners |
|
Contractual |
|
|
|
|
|
|
|
|
|
|
|
Mortgage brokerage |
|
Commission and Servicing Fees |
|
Comprehensive corporate real estate services |
|
Contractual |
|
|
|
|
|
|
|
|
|
|
|
Valuations, appraisals, research |
|
Assignment and Subscription Fees |
|
|
|
|
|
7
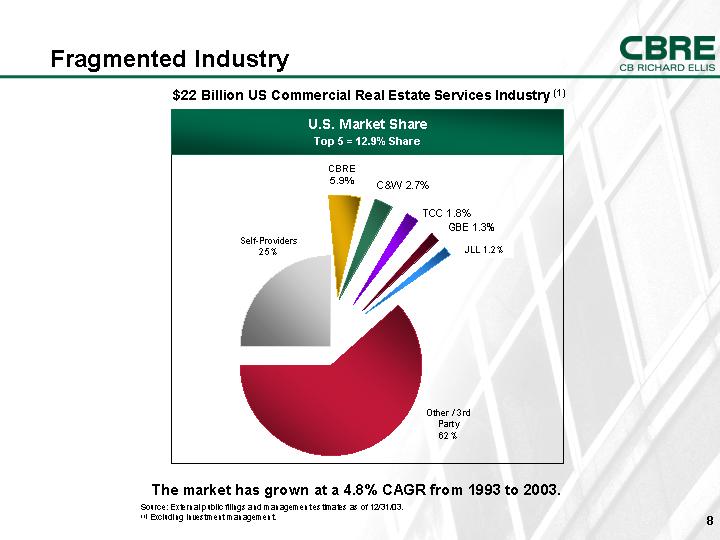
Fragmented Industry
$22 Billion US Commercial Real Estate Services Industry (1)
U.S. Market Share
Top 5 = 12.9% Share
[CHART]
The market has grown at a 4.8% CAGR from 1993 to 2003.
Source: External public filings and management estimates as of 12/31/03.
(1) Excluding investment management.
8
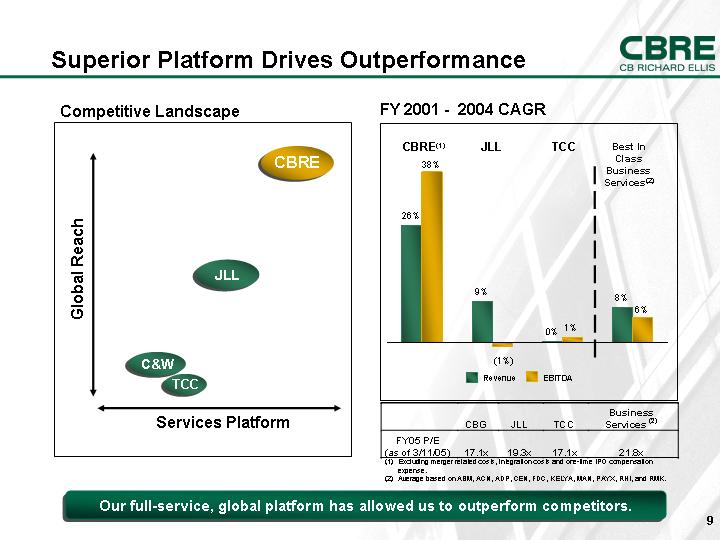
Superior Platform Drives Outperformance
Competitive Landscape
[CHART]
FY 2001 - 2004 CAGR
[CHART]
|
|
|
CBG |
|
JLL |
|
TCC |
|
Business |
|
|
|
|
|
|
|
|
|
|
|
|
|
FY05 P/E (as of 3/11/05) |
|
17.1x |
|
19.3x |
|
17.1x |
|
21.8x |
|
(1) Excluding merger related costs, integration costs and one-time IPO compensation expense.
(2) Average based on ABM, ACN, ADP, CEN, FDC, KELYA, MAN, PAYX, RHI, and RMK.
Our full-service, global platform has allowed us to outperform competitors.
9
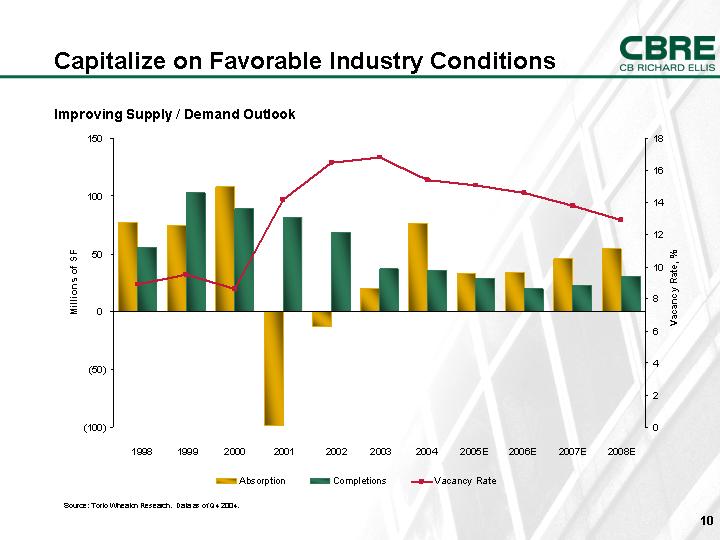
Capitalize on Favorable Industry Conditions
Improving Supply / Demand Outlook
[CHART]
Source: Torto Wheaton Research. Data as of Q4 2004.
10
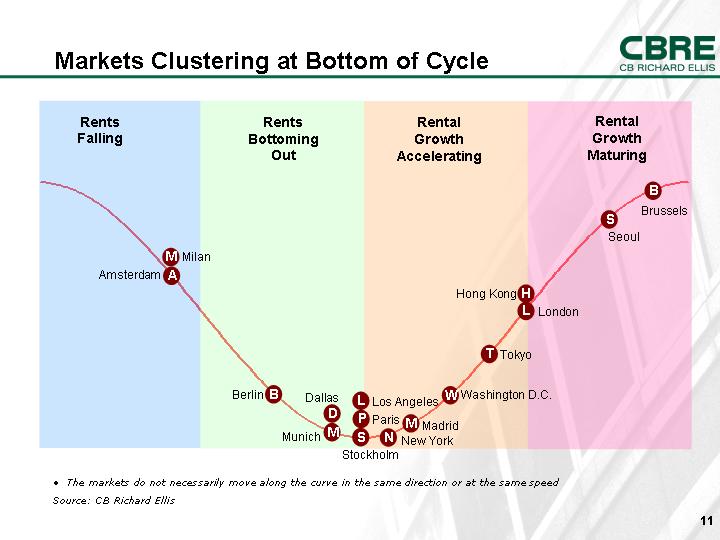
Markets Clustering at Bottom of Cycle
[CHART]
• The markets do not necessarily move along the curve in the same direction or at the same speed
Source: CB Richard Ellis
11
Key Growth Strategies
12
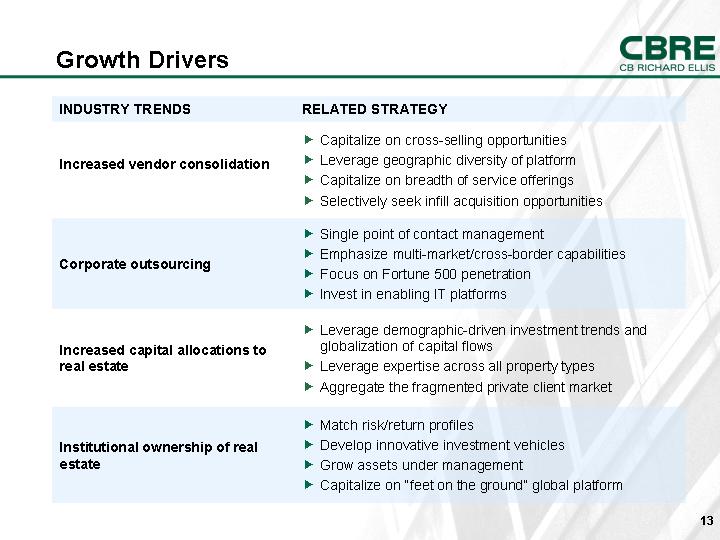
Growth Drivers
|
INDUSTRY TRENDS |
|
RELATED STRATEGY |
|
|
|
|
|
|
|
Increased vendor consolidation |
|
• |
Capitalize on cross-selling opportunities |
|
|
• |
Leverage geographic diversity of platform |
|
|
|
• |
Capitalize on breadth of service offerings |
|
|
|
• |
Selectively seek infill acquisition opportunities |
|
|
|
|
|
|
|
Corporate outsourcing |
|
• |
Single point of contact management |
|
|
• |
Emphasize multi-market/cross-border capabilities |
|
|
|
• |
Focus on Fortune 500 penetration |
|
|
|
• |
Invest in enabling IT platforms |
|
|
|
|
|
|
|
Increased capital allocations to real estate |
|
• |
Leverage demographic-driven investment trends and globalization of capital flows |
|
|
• |
Leverage expertise across all property types |
|
|
|
• |
Aggregate the fragmented private client market |
|
|
|
|
|
|
|
|
|
|
|
|
Institutional ownership of real estate |
|
• |
Match risk/return profiles |
|
|
• |
Develop innovative investment vehicles |
|
|
|
• |
Grow assets under management |
|
|
|
• |
Capitalize on “feet on the ground” global platform |
|
13
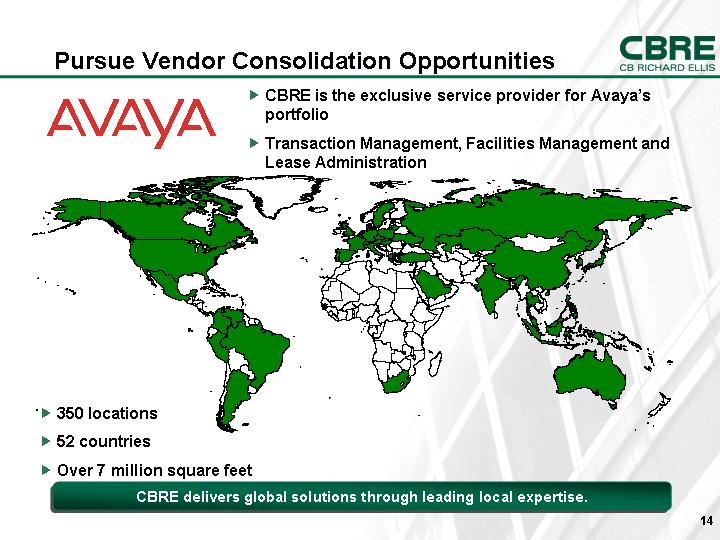
Pursue Vendor Consolidation Opportunities
[LOGO]
• CBRE is the exclusive service provider for Avaya’s portfolio
• Transaction Management, Facilities Management and Lease Administration
[GRAPHIC]
• 350 locations
• 52 countries
• Over 7 million square feet
CBRE delivers global solutions through leading local expertise.
14
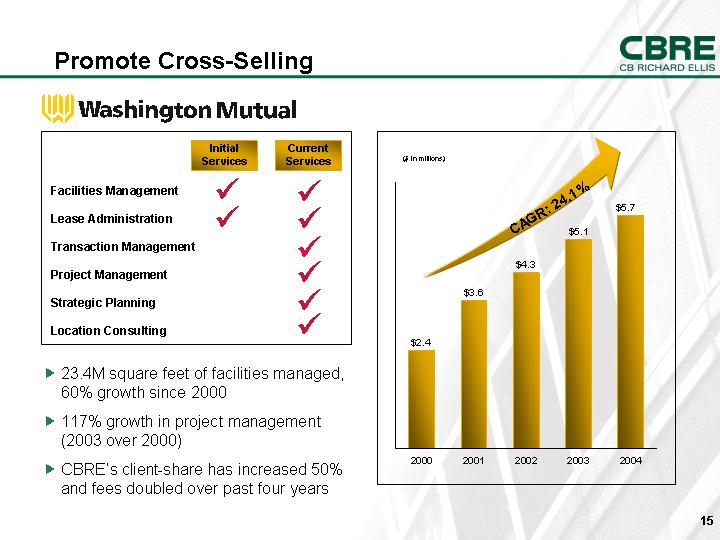
Promote Cross-Selling
[LOGO]
|
|
|
Initial |
|
Current |
|
|
|
|
Services |
|
Services |
|
|
|
|
|
|
|
|
|
Facilities Management |
|
|
|
|
|
|
|
|
|
|
|
|
|
Lease Administration |
|
|
|
|
|
|
|
|
|
|
|
|
|
Transaction Management |
|
|
|
|
|
|
|
|
|
|
|
|
|
Project Management |
|
|
|
|
|
|
|
|
|
|
|
|
|
Strategic Planning |
|
|
|
|
|
|
|
|
|
|
|
|
|
Location Consulting |
|
|
|
|
|
• 23.4M square feet of facilities managed, 60% growth since 2000
• 117% growth in project management (2003 over 2000)
• CBRE’s client-share has increased 50% and fees doubled over past four years
($ in millions)
[CHART]
15
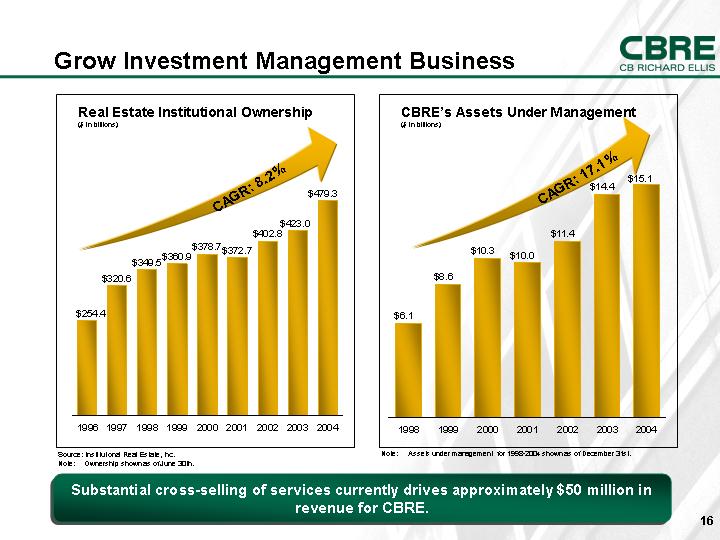
Grow Investment Management Business
Real Estate Institutional Ownership
($ in billions)
[CHART]
|
Source: |
Institutional Real Estate, Inc. |
|
Note: |
Ownership shown as of June 30th. |
CBRE’s Assets Under Management
($ in billions)
[CHART]
|
Note: |
Assets under management for 1998-2004 shown as of December 31st. |
Substantial cross-selling of services currently drives approximately $50 million in revenue for CBRE.
16
Financial Overview
17
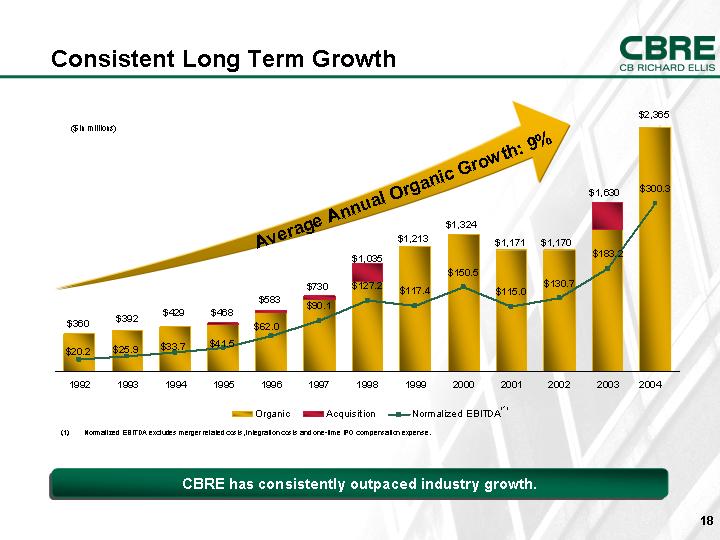
Consistent Long Term Growth
($ in millions)
[CHART]
(1) Normalized EBITDA excludes merger related costs, integration costs and one-time IPO compensation expense.
CBRE has consistently outpaced industry growth.
18
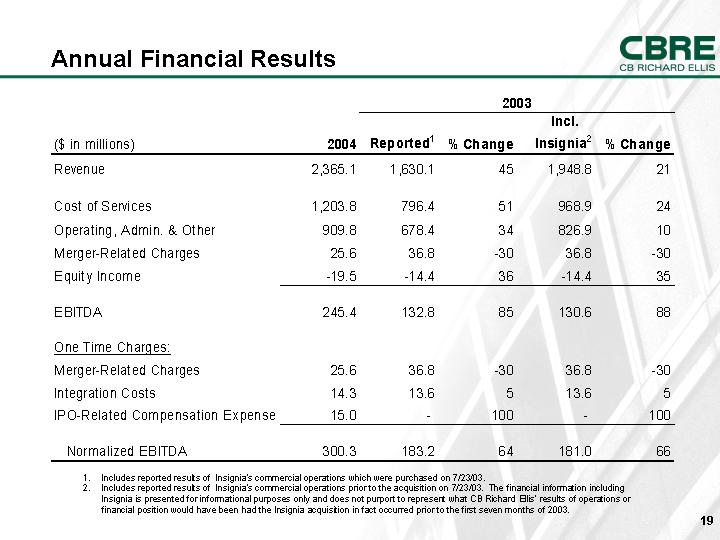
Annual Financial Results
|
|
|
|
|
2003 |
|
||||||
|
($ in millions) |
|
2004 |
|
Reported(1) |
|
% Change |
|
Incl. |
|
% Change |
|
|
Revenue |
|
2,365.1 |
|
1,630.1 |
|
45 |
|
1,948.8 |
|
21 |
|
|
|
|
|
|
|
|
|
|
|
|
|
|
|
Cost of Services |
|
1,203.8 |
|
796.4 |
|
51 |
|
968.9 |
|
24 |
|
|
Operating, Admin. & Other |
|
909.8 |
|
678.4 |
|
34 |
|
826.9 |
|
10 |
|
|
Merger-Related Charges |
|
25.6 |
|
36.8 |
|
-30 |
|
36.8 |
|
-30 |
|
|
Equity Income |
|
-19.5 |
|
-14.4 |
|
36 |
|
-14.4 |
|
35 |
|
|
|
|
|
|
|
|
|
|
|
|
|
|
|
EBITDA |
|
245.4 |
|
132.8 |
|
85 |
|
130.6 |
|
88 |
|
|
|
|
|
|
|
|
|
|
|
|
|
|
|
One Time Charges: |
|
|
|
|
|
|
|
|
|
|
|
|
Merger-Related Charges |
|
25.6 |
|
36.8 |
|
-30 |
|
36.8 |
|
-30 |
|
|
Integration Costs |
|
14.3 |
|
13.6 |
|
5 |
|
13.6 |
|
5 |
|
|
IPO-Related Compensation Expense |
|
15.0 |
|
— |
|
100 |
|
— |
|
100 |
|
|
|
|
|
|
|
|
|
|
|
|
|
|
|
Normalized EBITDA |
|
300.3 |
|
183.2 |
|
64 |
|
181.0 |
|
66 |
|
|
(1) |
Includes reported results of Insignia’s commercial operations which were purchased on 7/23/03. |
|
(2) |
Includes reported results of Insignia’s commercial operations prior to the acquisition on 7/23/03. The financial information including Insignia is presented for informational purposes only and does not purport to represent what CB Richard Ellis’ results of operations or financial position would have been had the Insignia acquisition in fact occurred prior to the first seven months of 2003. |
19
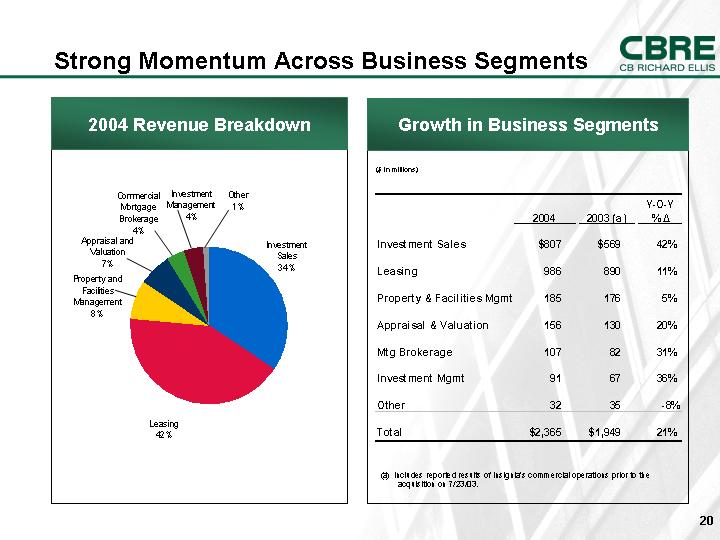
Strong Momentum Across Business Segments
2004 Revenue Breakdown
[CHART]
Growth in Business Segments
($ in millions)
|
|
|
|
|
|
|
Y-O-Y |
|
||
|
|
|
2004 |
|
2003 (a) |
|
% |
|
||
|
|
|
|
|
|
|
|
|
||
|
Investment Sales |
|
$ |
807 |
|
$ |
569 |
|
42 |
% |
|
|
|
|
|
|
|
|
|
||
|
Leasing |
|
986 |
|
890 |
|
11 |
% |
||
|
|
|
|
|
|
|
|
|
||
|
Property & Facilities Mgmt |
|
185 |
|
176 |
|
5 |
% |
||
|
|
|
|
|
|
|
|
|
||
|
Appraisal & Valuation |
|
156 |
|
130 |
|
20 |
% |
||
|
|
|
|
|
|
|
|
|
||
|
Mtg Brokerage |
|
107 |
|
82 |
|
31 |
% |
||
|
|
|
|
|
|
|
|
|
||
|
Investment Mgmt |
|
91 |
|
67 |
|
36 |
% |
||
|
|
|
|
|
|
|
|
|
||
|
Other |
|
32 |
|
35 |
|
-8 |
% |
||
|
|
|
|
|
|
|
|
|
||
|
Total |
|
$ |
2,365 |
|
$ |
1,949 |
|
21 |
% |
(a) Includes reported results of Insignia’s commercial operations prior to the acquisition on 7/23/03.
20
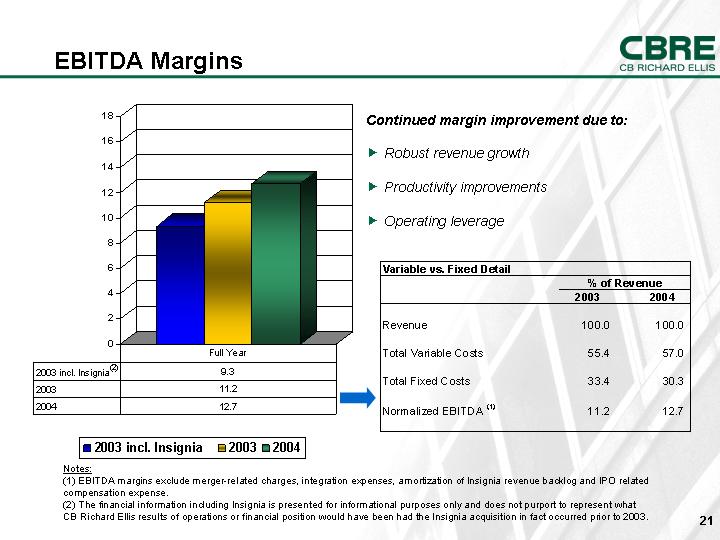
EBITDA Margins
[CHART]
|
2003 incl. Insignia(2) |
|
9.3 |
|
|
|
|
|
|
|
2003 |
|
11.2 |
|
|
|
|
|
|
|
2004 |
|
12.7 |
|
Continued margin improvement due to:
• Robust revenue growth
• Productivity improvements
• Operating leverage
Variable vs. Fixed Detail
|
|
|
% of Revenue |
|
||
|
|
|
2003 |
|
2004 |
|
|
|
|
|
|
|
|
|
Revenue |
|
100.0 |
|
100.0 |
|
|
|
|
|
|
|
|
|
Total Variable Costs |
|
55.4 |
|
57.0 |
|
|
|
|
|
|
|
|
|
Total Fixed Costs |
|
33.4 |
|
30.3 |
|
|
|
|
|
|
|
|
|
Normalized EBITDA (1) |
|
11.2 |
|
12.7 |
|
Notes:
(1) EBITDA margins exclude merger-related charges, integration expenses, amortization of Insignia revenue backlog and IPO related compensation expense.
(2) The financial information including Insignia is presented for informational purposes only and does not purport to represent what CB Richard Ellis results of operations or financial position would have been had the Insignia acquisition in fact occurred prior to 2003.
21
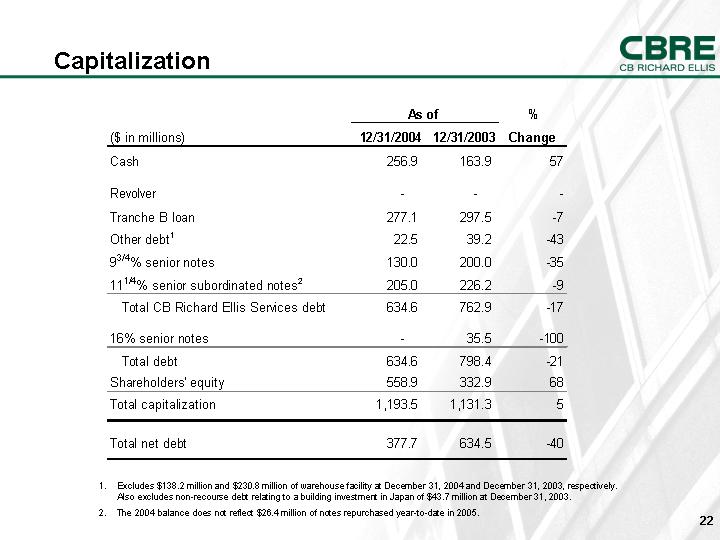
Capitalization Capitalization
|
|
|
As of |
|
% |
|
||
|
($ in millions) |
|
12/31/2004 |
|
12/31/2003 |
|
Change |
|
|
Cash |
|
256.9 |
|
163.9 |
|
57 |
|
|
|
|
|
|
|
|
|
|
|
Revolver |
|
— |
|
— |
|
— |
|
|
|
|
|
|
|
|
|
|
|
Tranche B loan |
|
277.1 |
|
297.5 |
|
-7 |
|
|
|
|
|
|
|
|
|
|
|
Other debt(1) |
|
22.5 |
|
39.2 |
|
-43 |
|
|
|
|
|
|
|
|
|
|
|
9¾% senior notes |
|
130.0 |
|
200.0 |
|
-35 |
|
|
|
|
|
|
|
|
|
|
|
11¼% senior subordinated notes(2) |
|
205.0 |
|
226.2 |
|
-9 |
|
|
Total CB Richard Ellis Services debt |
|
634.6 |
|
762.9 |
|
-17 |
|
|
|
|
|
|
|
|
|
|
|
16% senior notes |
|
— |
|
35.5 |
|
-100 |
|
|
Total debt |
|
634.6 |
|
798.4 |
|
-21 |
|
|
|
|
|
|
|
|
|
|
|
Shareholders’ equity |
|
558.9 |
|
332.9 |
|
68 |
|
|
Total capitalization |
|
1,193.5 |
|
1,131.3 |
|
5 |
|
|
|
|
|
|
|
|
|
|
|
Total net debt |
|
377.7 |
|
634.5 |
|
-40 |
|
1. Excludes $138.2 million and $230.8 million of warehouse facility at December 31, 2004 and December 31, 2003, respectively.
Also excludes non-recourse debt relating to a building investment in Japan of $43.7 million at December 31, 2003.
2. The 2004 balance does not reflect $26.4 million of notes repurchased year-to-date in 2005.
22
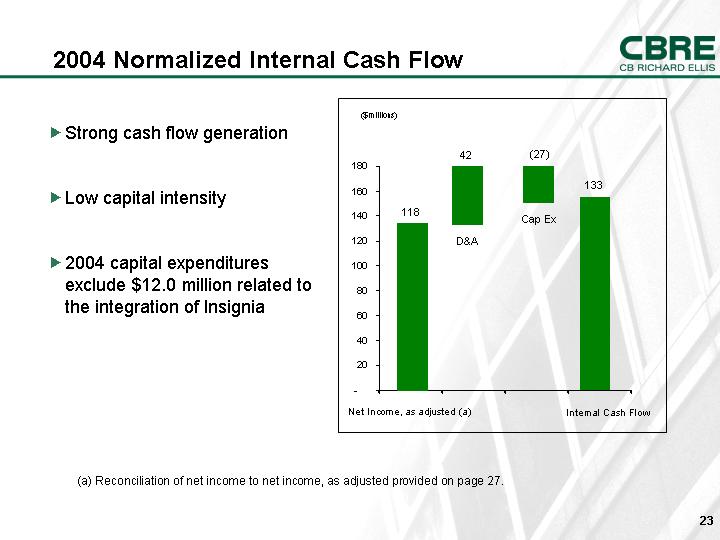
2004 Normalized Internal Cash Flow
• Strong cash flow generation
• Low capital intensity
• 2004 capital expenditures exclude $12.0 million related to the integration of Insignia
[CHART]
(a) Reconciliation of net income to net income, as adjusted provided on page 27.
23
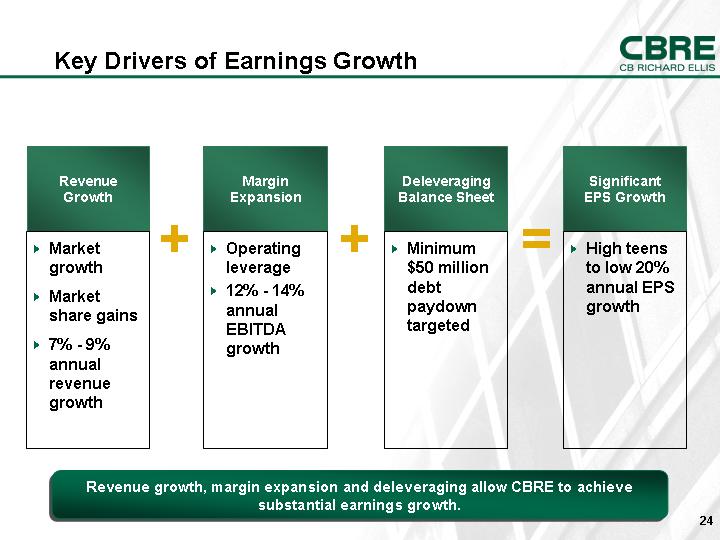
Key Drivers of Earnings Growth
|
Revenue |
|
Margin |
|
Deleveraging |
|
Significant |
|
Growth |
+ |
Expansion |
+ |
Balance Sheet |
= |
EPS Growth |
|
|
|
|
|
|||
|
• Market growth |
• Operating leverage |
• Minimum $50 million debt paydown targeted |
• High teens to low 20% annual EPS growth |
|||
|
|
|
|
|
|
|
|
|
• Market share gains |
|
• 12% - 14% annual EBITDA growth |
|
|
|
|
|
|
|
|
|
|
|
|
|
• 7% - 9% annual revenue growth |
|
|
|
|
|
|
Revenue growth, margin expansion and deleveraging allow CBRE to achieve substantial earnings growth.
24
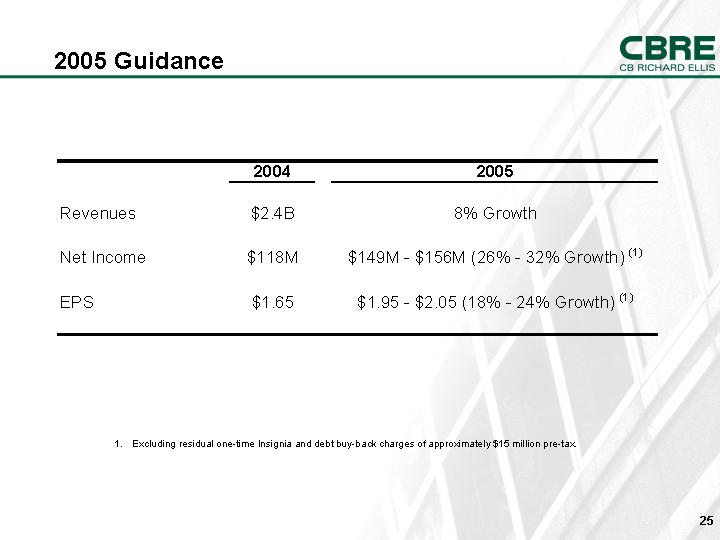
2005 Guidance
|
|
|
2004 |
|
2005 |
|
|
|
|
|
|
|
|
|
|
|
Revenues |
|
$ |
2.4B |
|
8% Growth |
|
|
|
|
|
|
|
|
|
|
Net Income |
|
$ |
118M |
|
$149M - $156M (26% - 32% Growth) (1) |
|
|
|
|
|
|
|
|
|
|
EPS |
|
$ |
1.65 |
|
$1.95 - $2.05 (18% - 24% Growth) (1) |
|
(1) Excluding residual one-time Insignia and debt buy-back charges of approximately $15 million pre-tax.
25
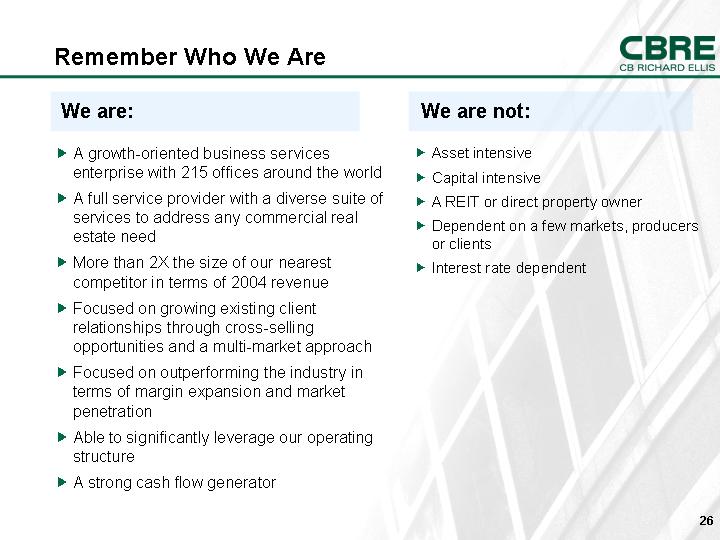
Remember Who We Are
We are:
• A growth-oriented business services enterprise with 215 offices around the world
• A full service provider with a diverse suite of services to address any commercial real estate need
• More than 2X the size of our nearest competitor in terms of 2004 revenue
• Focused on growing existing client relationships through cross-selling opportunities and a multi-market approach
• Focused on outperforming the industry in terms of margin expansion and market penetration
• Able to significantly leverage our operating structure
• A strong cash flow generator
We are not:
• Asset intensive
• Capital intensive
• A REIT or direct property owner
• Dependent on a few markets, producers or clients
• Interest rate dependent
26
Appendix
27
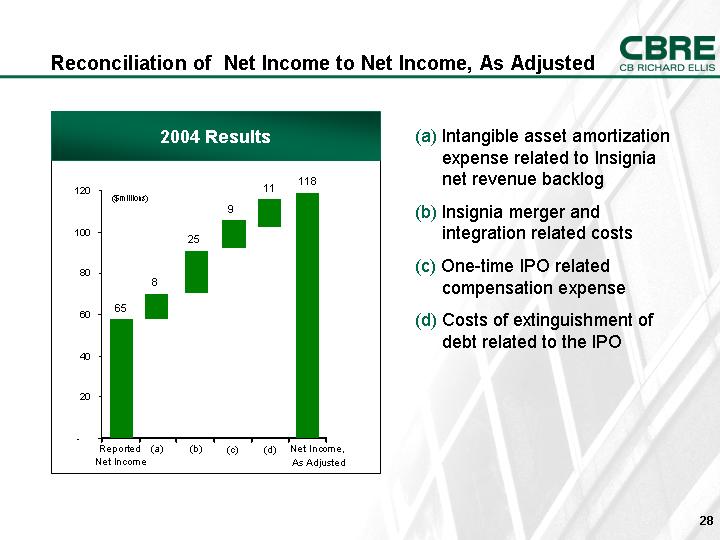
Reconciliation of Net Income to Net Income, As Adjusted
2004 Results
[CHART]
(a) Intangible asset amortization expense related to Insignia net revenue backlog
(b) Insignia merger and integration related costs
(c) One-time IPO related compensation expense
(d) Costs of extinguishment of debt related to the IPO
28
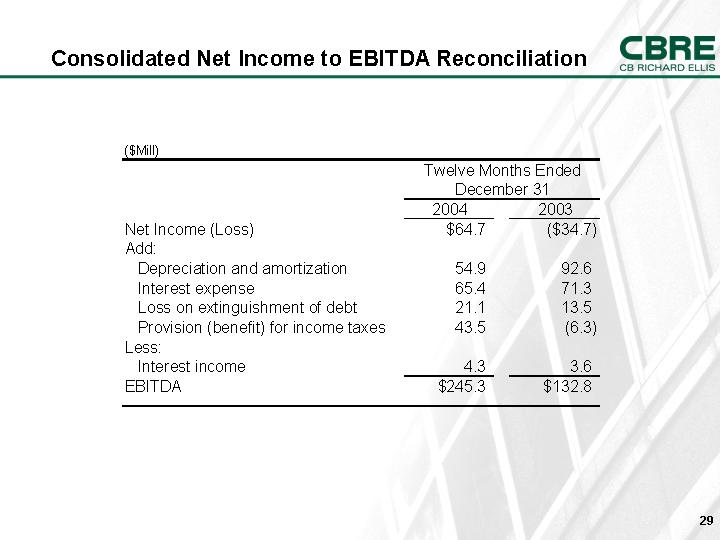
Consolidated Net Income to EBITDA Reconciliation
($Mill)
|
|
|
Twelve Months Ended |
|
||||
|
|
|
2004 |
|
2003 |
|
||
|
Net Income (Loss) |
|
$ |
64.7 |
|
$ |
(34.7 |
) |
|
Add: |
|
|
|
|
|
||
|
Depreciation and amortization |
|
54.9 |
|
92.6 |
|
||
|
Interest expense |
|
65.4 |
|
71.3 |
|
||
|
Loss on extinguishment of debt |
|
21.1 |
|
13.5 |
|
||
|
Provision (benefit) for income taxes |
|
43.5 |
|
(6.3 |
) |
||
|
Less: |
|
|
|
|
|
||
|
Interest income |
|
4.3 |
|
3.6 |
|
||
|
EBITDA |
|
$ |
245.3 |
|
$ |
132.8 |
|
29
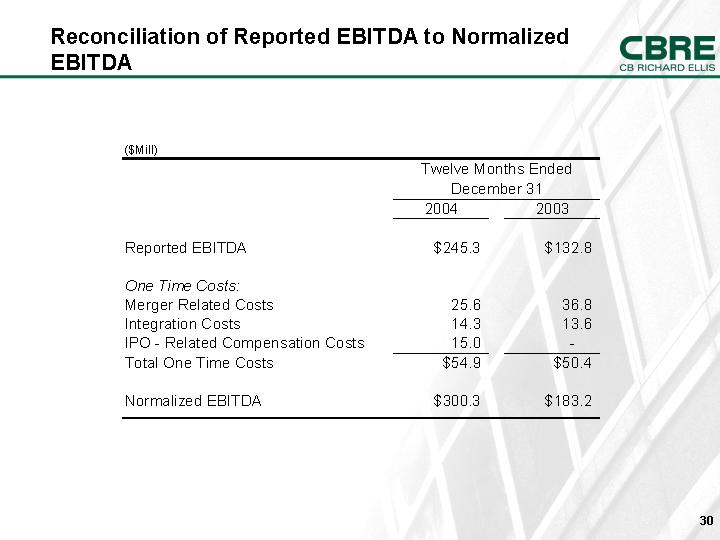
Reconciliation of Reported EBITDA to Normalized EBITDA
($Mill)
|
|
|
Twelve Months Ended |
|
||||
|
|
|
2004 |
|
2003 |
|
||
|
|
|
|
|
|
|
||
|
Reported EBITDA |
|
$ |
245.3 |
|
$ |
132.8 |
|
|
|
|
|
|
|
|
||
|
One Time Costs: |
|
|
|
|
|
||
|
Merger Related Costs |
|
25.6 |
|
36.8 |
|
||
|
Integration Costs |
|
14.3 |
|
13.6 |
|
||
|
IPO - Related Compensation Costs |
|
15.0 |
|
— |
|
||
|
Total One Time Costs |
|
$ |
54.9 |
|
$ |
50.4 |
|
|
|
|
|
|
|
|
||
|
Normalized EBITDA |
|
$ |
300.3 |
|
$ |
183.2 |
|
30
[LOGO]