|
Fourth Quarter 2004
|
|
|
Financial Results
|
|
|
|
[GRAPHIC]
|
|
Investor Conference Call
|
|
|
February 3, 2005
|
|
[LOGO]
Forward Looking Statements
This presentation contains statements that are
forward looking within the meaning of the Private Securities Litigation Reform Act of 1995. These statements should be considered as estimates only and actual
results may ultimately differ from these estimates. Except to the extent
required by applicable securities laws, CB Richard Ellis undertakes no obligation to update or
publicly revise any of the forward-looking statements that you may hear today. Please refer to our annual report
on Form 10-K and our quarterly
reports on Form 10-Q, which are filed with the SEC and available at the SEC’s website (http://www.sec.gov),
for a full discussion of the risks and other factors, that may impact any estimates that you may hear today. This is a public call and our responses to questions must be
limited to information that is acceptable for dissemination within the public domain. In addition, we may make certain statements during the course of this
presentation which include references to “non-GAAP financial measures,” as defined by SEC regulations. As required by these regulations, we have provided reconciliations
of these measures to what we believe are the most directly comparable GAAP measures, which are available in
the fourth quarter earnings
press release.
1
Conference Call Participants
Ray Wirta – Chief Executive Officer
Brett White – President
Ken Kay – Senior Executive Vice
President and Chief Financial Officer
Shelley Young – Director of
Investor Relations
2
Highlights
• Fourth
quarter and year-to-date 2004 revenue growth of 29% and 45%, respectively
• Strong
investment properties sales and improved leasing fundamentals in 2004
• Net
income, as adjusted for one-time items, of $117.9 million in 2004 versus $36.8
million in 2003, an increase of 220%
• Diluted
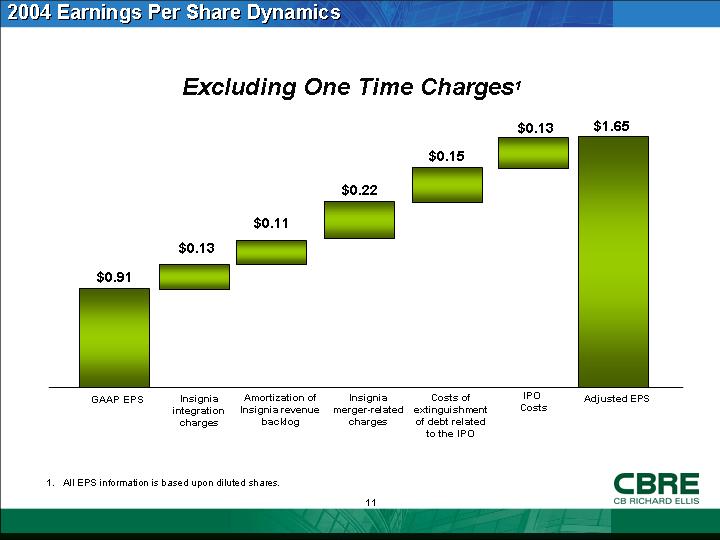
earnings per share of $1.65 in 2004
• Improved
earnings guidance for 2005
3
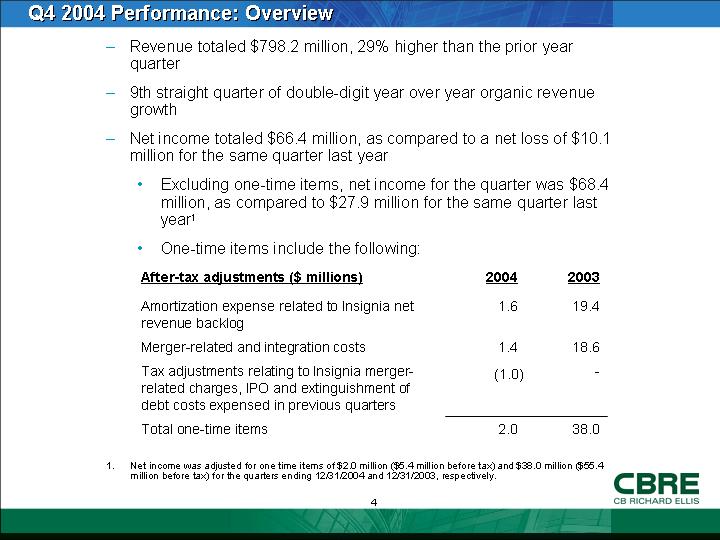
Q4 2004 Performance: Overview
• Revenue
totaled $798.2 million, 29% higher than the prior year quarter
• 9th
straight quarter of double-digit year over year organic revenue growth
• Net
income totaled $66.4 million, as compared to a net loss of $10.1 million for
the same quarter last year
• Excluding
one-time items, net income for the quarter was $68.4 million, as compared to
$27.9 million for the same quarter last year(1)
• One-time
items include the following:
|
After-tax adjustments ($ millions)
|
|
2004
|
|
2003
|
|
|
|
|
|
|
|
|
|
Amortization
expense related to Insignia net revenue backlog
|
|
1.6
|
|
19.4
|
|
|
|
|
|
|
|
|
|
Merger-related
and integration costs
|
|
1.4
|
|
18.6
|
|
|
|
|
|
|
|
|
|
Tax
adjustments relating to Insignia merger-related charges, IPO and
extinguishment of debt costs expensed in previous quarters
|
|
(1.0
|
)
|
—
|
|
|
|
|
|
|
|
|
|
Total
one-time items
|
|
2.0
|
|
38.0
|
|
(1) Net income was adjusted for one time items of $2.0 million ($5.4
million before tax) and $38.0 million ($55.4 million before tax) for the
quarters ending 12/31/2004 and 12/31/2003, respectively.
4
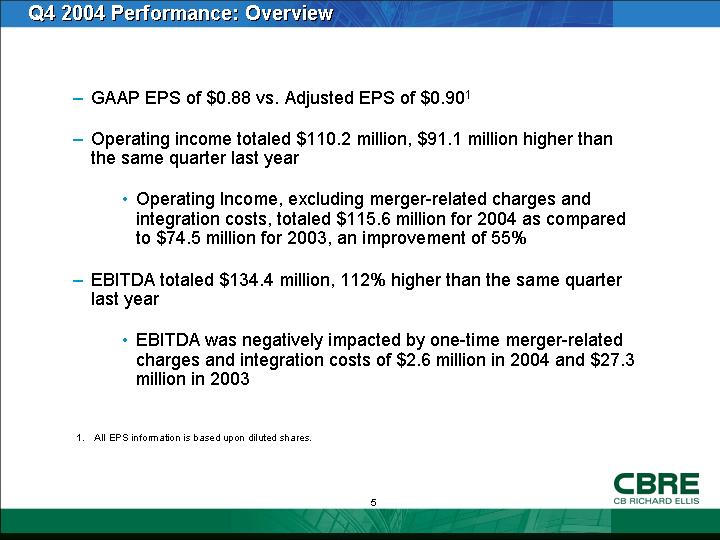
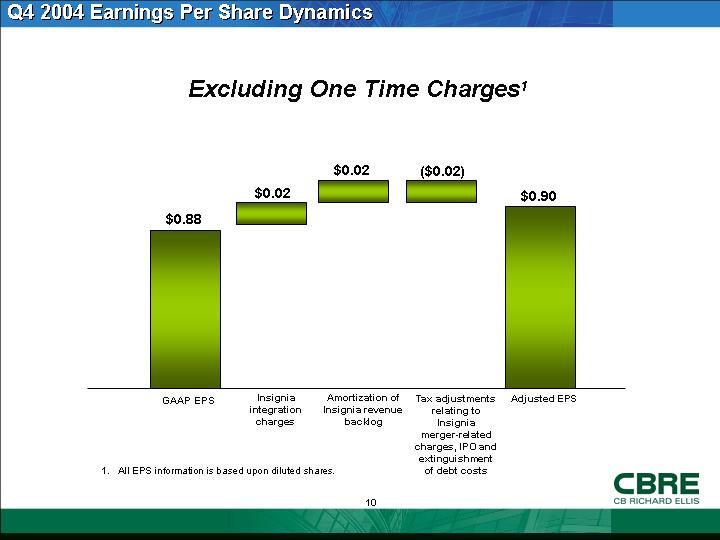
• GAAP EPS of $0.88 vs. Adjusted EPS of $0.90(1)
• Operating
income totaled $110.2 million, $91.1 million higher than the same quarter last
year
• Operating Income, excluding merger-related
charges and integration costs, totaled $115.6 million for 2004 as compared to
$74.5 million for 2003, an improvement of 55%
• EBITDA
totaled $134.4 million, 112% higher than the same quarter last year
• EBITDA
was negatively impacted by one-time merger-related charges and integration
costs of $2.6 million in 2004 and $27.3 million in 2003
(1) All EPS information is based upon diluted shares.
5
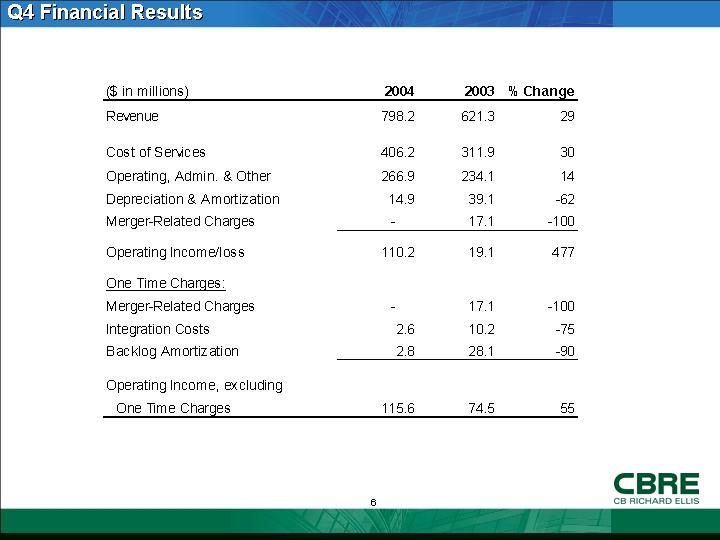
Q4 Financial Results
|
($ in millions)
|
|
2004
|
|
2003
|
|
% Change
|
|
|
|
|
|
|
|
|
|
|
|
Revenue
|
|
798.2
|
|
621.3
|
|
29
|
|
|
|
|
|
|
|
|
|
|
|
Cost of
Services
|
|
406.2
|
|
311.9
|
|
30
|
|
|
Operating,
Admin. & Other
|
|
266.9
|
|
234.1
|
|
14
|
|
|
Depreciation
& Amortization
|
|
14.9
|
|
39.1
|
|
-62
|
|
|
Merger-Related
Charges
|
|
—
|
|
17.1
|
|
-100
|
|
|
|
|
|
|
|
|
|
|
|
Operating
Income/loss
|
|
110.2
|
|
19.1
|
|
477
|
|
|
|
|
|
|
|
|
|
|
|
One Time
Charges:
|
|
|
|
|
|
|
|
|
Merger-Related
Charges
|
|
—
|
|
17.1
|
|
-100
|
|
|
Integration
Costs
|
|
2.6
|
|
10.2
|
|
-75
|
|
|
Backlog Amortization
|
|
2.8
|
|
28.1
|
|
-90
|
|
|
|
|
|
|
|
|
|
|
|
Operating
Income, excluding One Time Charges
|
|
115.6
|
|
74.5
|
|
55
|
|
6
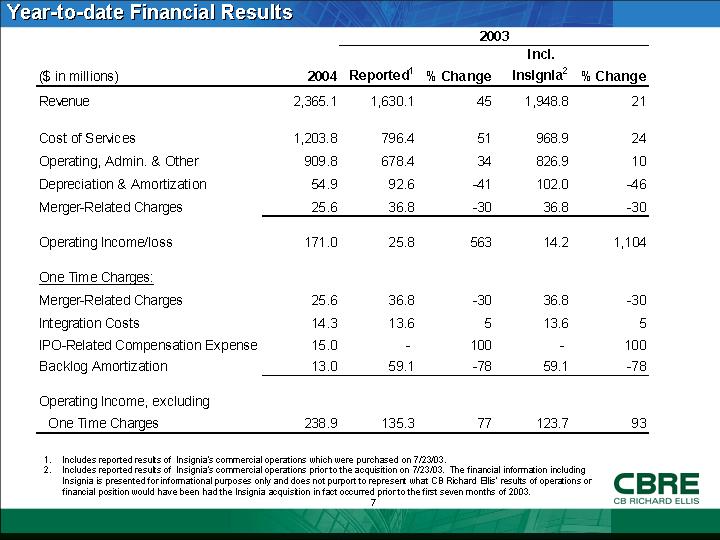
Year-to-date Financial Results
|
|
|
|
|
2003
|
|
|
|
|
|
|
|
|
|
|
Incl.
|
|
|
|
|
($ in millions)
|
|
2004
|
|
Reported(1)
|
|
% Change
|
|
Insignia(2)
|
|
% Change
|
|
|
|
|
|
|
|
|
|
|
|
|
|
|
|
Revenue
|
|
2,365.1
|
|
1,630.1
|
|
45
|
|
1,948.8
|
|
21
|
|
|
|
|
|
|
|
|
|
|
|
|
|
|
|
Cost of
Services
|
|
1,203.8
|
|
796.4
|
|
51
|
|
968.9
|
|
24
|
|
|
Operating,
Admin. & Other
|
|
909.8
|
|
678.4
|
|
34
|
|
826.9
|
|
10
|
|
|
Depreciation
& Amortization
|
|
54.9
|
|
92.6
|
|
-41
|
|
102.0
|
|
-46
|
|
|
Merger-Related
Charges
|
|
25.6
|
|
36.8
|
|
-30
|
|
36.8
|
|
-30
|
|
|
|
|
|
|
|
|
|
|
|
|
|
|
|
Operating
Income/loss
|
|
171.0
|
|
25.8
|
|
563
|
|
14.2
|
|
1,104
|
|
|
|
|
|
|
|
|
|
|
|
|
|
|
|
One Time
Charges:
|
|
|
|
|
|
|
|
|
|
|
|
|
Merger-Related
Charges
|
|
25.6
|
|
36.8
|
|
-30
|
|
36.8
|
|
-30
|
|
|
Integration
Costs
|
|
14.3
|
|
13.6
|
|
5
|
|
13.6
|
|
5
|
|
|
IPO-Related
Compensation Expense
|
|
15.0
|
|
—
|
|
100
|
|
—
|
|
100
|
|
|
Backlog
Amortization
|
|
13.0
|
|
59.1
|
|
-78
|
|
59.1
|
|
-78
|
|
|
|
|
|
|
|
|
|
|
|
|
|
|
|
Operating
Income, excluding One Time Charges
|
|
238.9
|
|
135.3
|
|
77
|
|
123.7
|
|
93
|
|
(1) Includes reported results of Insignia’s commercial operations which were
purchased on 7/23/03.
(2) Includes reported results of Insignia’s commercial operations prior to
the acquisition on 7/23/03. The financial
information including Insignia is presented for informational purposes only and
does not purport to represent what CB Richard Ellis’ results of operations or
financial position would have been had the Insignia acquisition in fact
occurred prior to the first seven months of 2003.
7
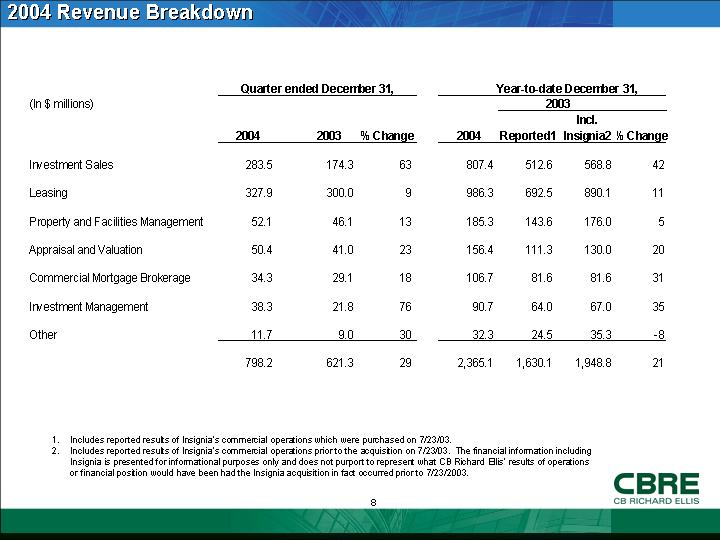
2004 Revenue Breakdown
|
|
|
Quarter ended December 31,
|
|
Year-to-date December 31,
|
|
|
|
|
|
|
|
|
|
|
|
|
2003
|
|
|
|
|
|
|
|
|
|
|
|
|
|
|
Incl.
|
|
|
|
|
(In $ millions)
|
|
2004
|
|
2003
|
|
% Change
|
|
2004
|
|
Reported(1)
|
|
Insignia(2)
|
|
% Change
|
|
|
|
|
|
|
|
|
|
|
|
|
|
|
|
|
|
|
|
Investment
Sales
|
|
283.5
|
|
174.3
|
|
63
|
|
807.4
|
|
512.6
|
|
568.8
|
|
42
|
|
|
|
|
|
|
|
|
|
|
|
|
|
|
|
|
|
|
|
Leasing
|
|
327.9
|
|
300.0
|
|
9
|
|
986.3
|
|
692.5
|
|
890.1
|
|
11
|
|
|
|
|
|
|
|
|
|
|
|
|
|
|
|
|
|
|
|
Property and
Facilities Management
|
|
52.1
|
|
46.1
|
|
13
|
|
185.3
|
|
143.6
|
|
176.0
|
|
5
|
|
|
|
|
|
|
|
|
|
|
|
|
|
|
|
|
|
|
|
Appraisal
and Valuation
|
|
50.4
|
|
41.0
|
|
23
|
|
156.4
|
|
111.3
|
|
130.0
|
|
20
|
|
|
|
|
|
|
|
|
|
|
|
|
|
|
|
|
|
|
|
Commercial
Mortgage Brokerage
|
|
34.3
|
|
29.1
|
|
18
|
|
106.7
|
|
81.6
|
|
81.6
|
|
31
|
|
|
|
|
|
|
|
|
|
|
|
|
|
|
|
|
|
|
|
Investment
Management
|
|
38.3
|
|
21.8
|
|
76
|
|
90.7
|
|
64.0
|
|
67.0
|
|
35
|
|
|
|
|
|
|
|
|
|
|
|
|
|
|
|
|
|
|
|
Other
|
|
11.7
|
|
9.0
|
|
30
|
|
32.3
|
|
24.5
|
|
35.3
|
|
-8
|
|
|
|
|
|
|
|
|
|
|
|
|
|
|
|
|
|
|
|
|
|
798.2
|
|
621.3
|
|
29
|
|
2,365.1
|
|
1,630.1
|
|
1,948.8
|
|
21
|
|
(1) Includes reported results of Insignia’s commercial operations which were
purchased on 7/23/03.
(2) Includes reported results of Insignia’s commercial operations prior to
the acquisition on 7/23/03. The
financial information including Insignia is presented for informational
purposes only and does not purport to represent what CB Richard Ellis’ results
of operations or financial position would have been had the Insignia
acquisition in fact occurred prior to 7/23/2003.
8
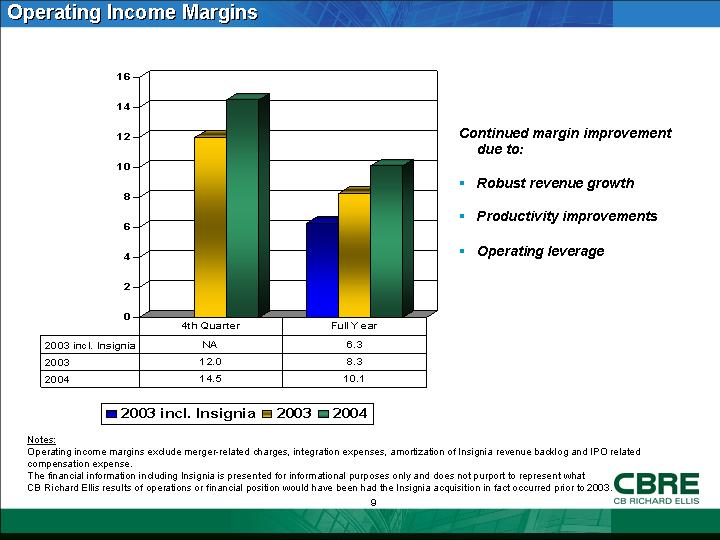
Operating Income Margins
[CHART]
|
|
|
4th Quarter
|
|
Full Year
|
|
|
2003 incl. Insignia
|
|
NA
|
|
6.3
|
|
|
2003
|
|
12.0
|
|
8.3
|
|
|
2004
|
|
14.5
|
|
10.1
|
|
Continued margin improvement due to:
• Robust
revenue growth
• Productivity
improvements
• Operating
leverage
Notes:
Operating
income margins exclude merger-related charges, integration expenses,
amortization of Insignia revenue backlog and IPO related compensation expense.
The
financial information including Insignia is presented for informational
purposes only and does not purport to represent what CB Richard Ellis results
of operations or financial position would have been had the Insignia
acquisition in fact occurred prior to 2003.
9
Q4 2004 Earnings Per Share
Dynamics
Excluding One Time Charges(1)
[CHART]
(1) All EPS information is based upon diluted shares.
10
2004 Earnings Per Share Dynamics
Excluding One Time Charges(1)
[CHART]
(1) All EPS information is based upon diluted shares.
11
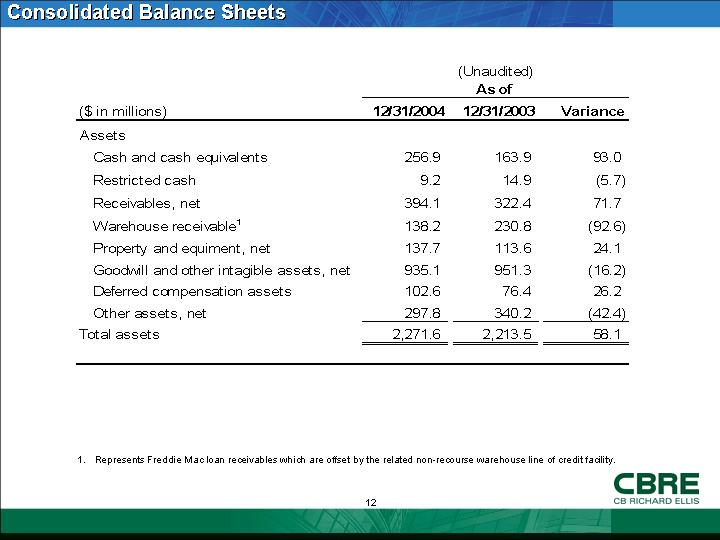
Consolidated Balance Sheets
|
|
|
As of
|
|
|
($ in millions)
|
|
12/31/2004
|
|
12/31/2003
|
|
Variance
|
|
|
|
|
|
|
(Unaudited)
|
|
|
|
|
Assets
|
|
|
|
|
|
|
|
|
Cash and
cash equivalents
|
|
256.9
|
|
163.9
|
|
93.0
|
|
|
Restricted
cash
|
|
9.2
|
|
14.9
|
|
(5.7
|
)
|
|
Receivables,
net
|
|
394.1
|
|
322.4
|
|
71.7
|
|
|
Warehouse receivable(1)
|
|
138.2
|
|
230.8
|
|
(92.6
|
)
|
|
Property and
equiment, net
|
|
137.7
|
|
113.6
|
|
24.1
|
|
|
Goodwill and
other intagible assets, net
|
|
935.1
|
|
951.3
|
|
(16.2
|
)
|
|
Deferred
compensation assets
|
|
102.6
|
|
76.4
|
|
26.2
|
|
|
Other
assets, net
|
|
297.8
|
|
340.2
|
|
(42.4
|
)
|
|
Total assets
|
|
2,271.6
|
|
2,213.5
|
|
58.1
|
|
(1) Represents Freddie Mac loan receivables which are offset by the related
non-recourse warehouse line of credit facility.
12
|
|
|
As of
|
|
|
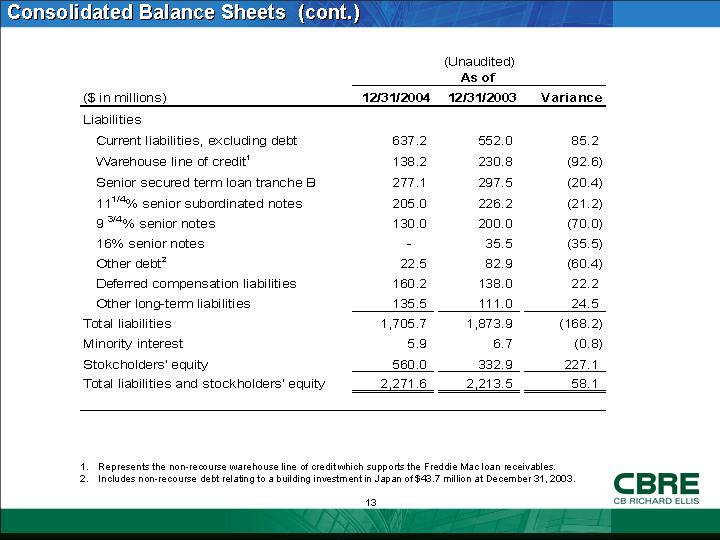
($ in millions)
|
|
12/31/2004
|
|
12/31/2003
|
|
Variance
|
|
|
|
|
|
|
(Unaudited)
|
|
|
|
|
Liabilities
|
|
|
|
|
|
|
|
|
Current
liabilities, excluding debt
|
|
637.2
|
|
552.0
|
|
85.2
|
|
|
Warehouse
line of credit(1)
|
|
138.2
|
|
230.8
|
|
(92.6
|
)
|
|
Senior secured
term loan tranche B
|
|
277.1
|
|
297.5
|
|
(20.4
|
)
|
|
11 1/4%
senior subordinated notes
|
|
205.0
|
|
226.2
|
|
(21.2
|
)
|
|
9 3/4%
senior notes
|
|
130.0
|
|
200.0
|
|
(70.0
|
)
|
|
16% senior
notes
|
|
—
|
|
35.5
|
|
(35.5
|
)
|
|
Other debt(2)
|
|
22.5
|
|
82.9
|
|
(60.4
|
)
|
|
Deferred
compensation liabilities
|
|
160.2
|
|
138.0
|
|
22.2
|
|
|
Other
long-term liabilities
|
|
135.5
|
|
111.0
|
|
24.5
|
|
|
Total
liabilities
|
|
1,705.7
|
|
1,873.9
|
|
(168.2
|
)
|
|
Minority
interest
|
|
5.9
|
|
6.7
|
|
(0.8
|
)
|
|
Stokcholders’
equity
|
|
560.0
|
|
332.9
|
|
227.1
|
|
|
Total
liabilities and stockholders’ equity
|
|
2,271.6
|
|
2,213.5
|
|
58.1
|
|
(1) Represents the non-recourse warehouse line of credit which supports the
Freddie Mac loan receivables.
(2) Includes non-recourse debt relating to a building investment in Japan
of $43.7 million at December 31, 2003.
13
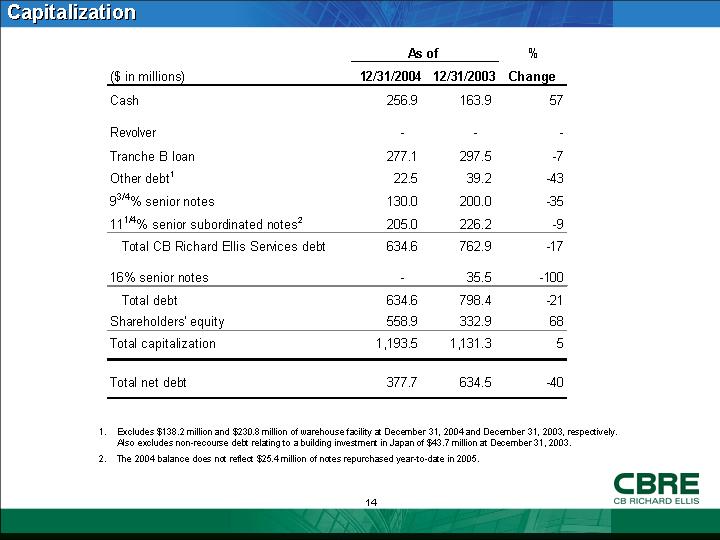
Capitalization
|
|
|
As of
|
|
%
|
|
|
($ in millions)
|
|
12/31/2004
|
|
12/31/2003
|
|
Change
|
|
|
Cash
|
|
256.9
|
|
163.9
|
|
57
|
|
|
|
|
|
|
|
|
|
|
|
Revolver
|
|
—
|
|
—
|
|
—
|
|
|
Tranche B
loan
|
|
277.1
|
|
297.5
|
|
-7
|
|
|
Other debt(1)
|
|
22.5
|
|
39.2
|
|
-43
|
|
|
9 3/4%
senior notes
|
|
130.0
|
|
200.0
|
|
-35
|
|
|
11 1/4%
senior subordinated notes(2)
|
|
205.0
|
|
226.2
|
|
-9
|
|
|
Total CB
Richard Ellis Services debt
|
|
634.6
|
|
762.9
|
|
-17
|
|
|
|
|
|
|
|
|
|
|
|
16% senior
notes
|
|
—
|
|
35.5
|
|
-100
|
|
|
Total debt
|
|
634.6
|
|
798.4
|
|
-21
|
|
|
Shareholders’
equity
|
|
558.9
|
|
332.9
|
|
68
|
|
|
Total
capitalization
|
|
1,193.5
|
|
1,131.3
|
|
5
|
|
|
|
|
|
|
|
|
|
|
|
Total net
debt
|
|
377.7
|
|
634.5
|
|
-40
|
|
(1) Excludes $138.2 million and $230.8 million of
warehouse facility at December 31, 2004 and December 31, 2003,
respectively. Also excludes non-recourse debt relating to a building investment
in Japan of $43.7 million at December 31, 2003.
(2) The 2004 balance does not reflect $25.4
million of notes repurchased year-to-date in 2005.
14
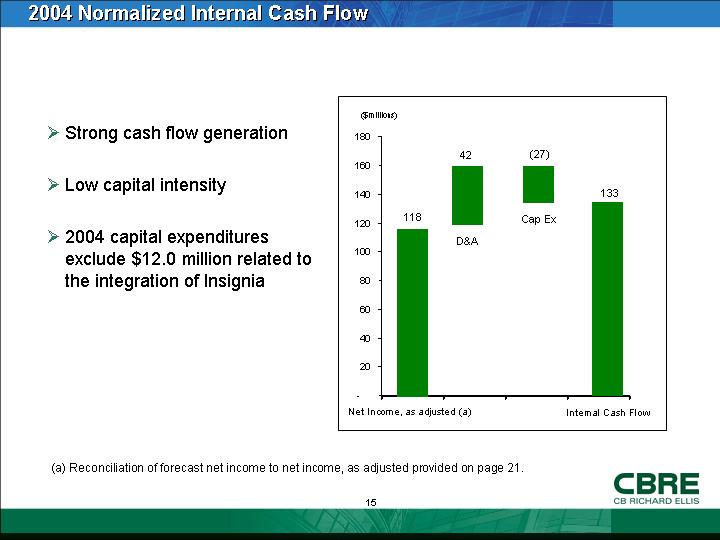
2004 Normalized Internal Cash Flow
|
|
•
|
Strong cash flow generation
|
|
|
|
|
|
|
|
|
•
|
Low capital intensity
|
[CHART]
|
|
|
|
|
|
|
|
•
|
2004 capital expenditures exclude $12.0 million related to the
integration of Insignia
|
|
(a) Reconciliation
of forecast net income to net income, as adjusted provided on page 21.
15
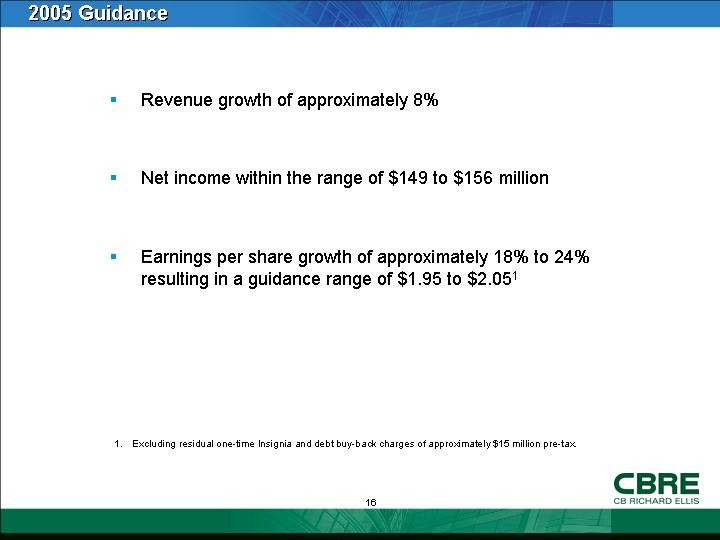
2005 Guidance
• Revenue
growth of approximately 8%
• Net
income within the range of $149 to $156 million
• Earnings
per share growth of approximately 18% to 24% resulting in a guidance range of
$1.95 to $2.05(1)
(1) Excluding residual one-time Insignia and debt buy-back charges of
approximately $15 million pre-tax.
16
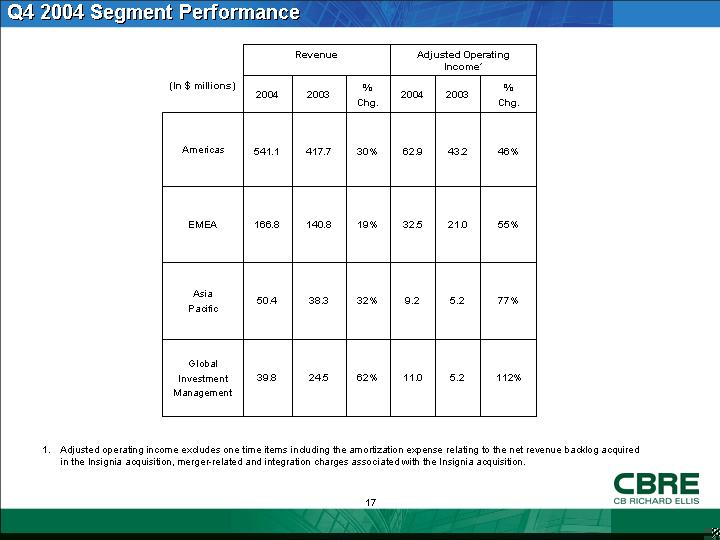
Q4 2004 Segment Performance
|
|
|
Revenue
|
|
Adjusted Operating
Income(1)
|
|
|
(In $ millions)
|
|
2004
|
|
2003
|
|
%
Chg.
|
|
2004
|
|
2003
|
|
%
Chg.
|
|
|
Americas
|
|
541.1
|
|
417.7
|
|
30
|
%
|
62.9
|
|
43.2
|
|
46
|
%
|
|
EMEA
|
|
166.8
|
|
140.8
|
|
19
|
%
|
32.5
|
|
21.0
|
|
55
|
%
|
|
Asia Pacific
|
|
50.4
|
|
38.3
|
|
32
|
%
|
9.2
|
|
5.2
|
|
77
|
%
|
|
Global
Investment Management
|
|
39.8
|
|
24.5
|
|
62
|
%
|
11.0
|
|
5.2
|
|
112
|
%
|
(1) Adjusted operating income excludes one time
items including the amortization expense relating to the net revenue backlog
acquired in the Insignia acquisition, merger-related and integration charges
associated with the Insignia acquisition.
17
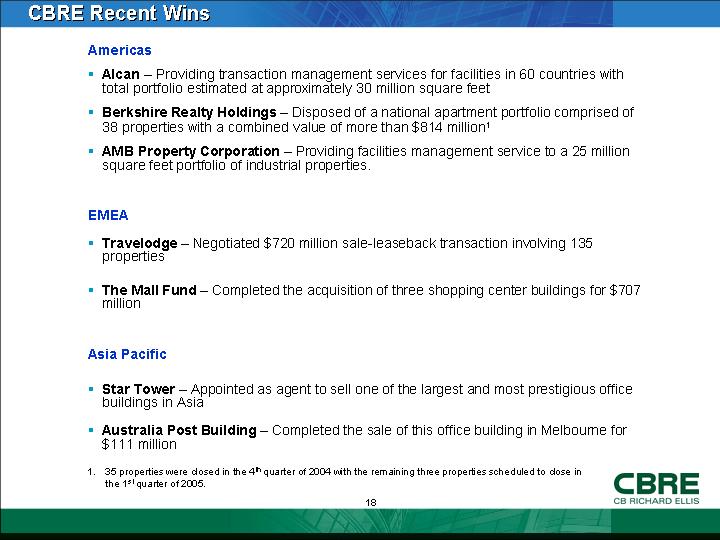
CBRE Recent Wins
Americas
• Alcan – Providing transaction management services
for facilities in 60 countries with total portfolio estimated at approximately
30 million square feet
• Berkshire Realty Holdings – Disposed of a national apartment portfolio
comprised of 38 properties with a combined value of more than $814 million(1)
• AMB Property Corporation – Providing facilities management service to
a 25 million square feet portfolio of industrial properties.
EMEA
• Travelodge – Negotiated $720 million sale-leaseback
transaction involving 135 properties
• The Mall Fund – Completed the acquisition of three
shopping center buildings for $707 million
Asia
Pacific
• Star Tower – Appointed as agent to sell one of the
largest and most prestigious office buildings in Asia
• Australia Post Building – Completed the sale of this office building
in Melbourne for $111 million
(1) 35 properties were closed in the 4th
quarter of 2004 with the remaining three properties scheduled to close in the 1st
quarter of 2005.
18
Favorable Trends
• Robust
investment sales market in the U.S. despite measured increases in short-term
interest rates in the second half of 2004
• Strong
investment sales activity is expected to continue into 2005
• Increased
corporate confidence and sustained employment growth have bolstered U.S.
leasing markets
• Proactive
business development strategy resulted in numerous new fortune 500 client
relationships
• Record
performance in mortgage brokerage
• Active
investment market in Europe and Asia Pacific
19
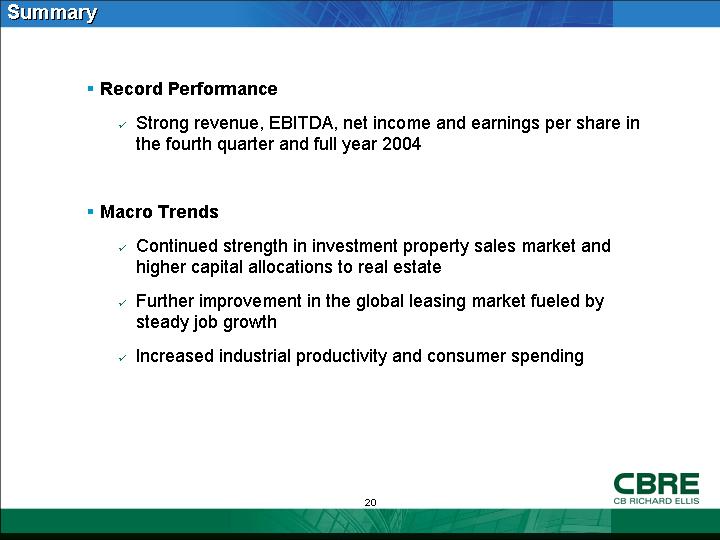
Summary
• Record Performance
• Strong
revenue, EBITDA, net income and earnings per share in the fourth quarter and
full year 2004
• Macro Trends
• Continued
strength in investment property sales market and higher capital allocations to
real estate
• Further
improvement in the global leasing market fueled by steady job growth
• Increased
industrial productivity and consumer spending
20
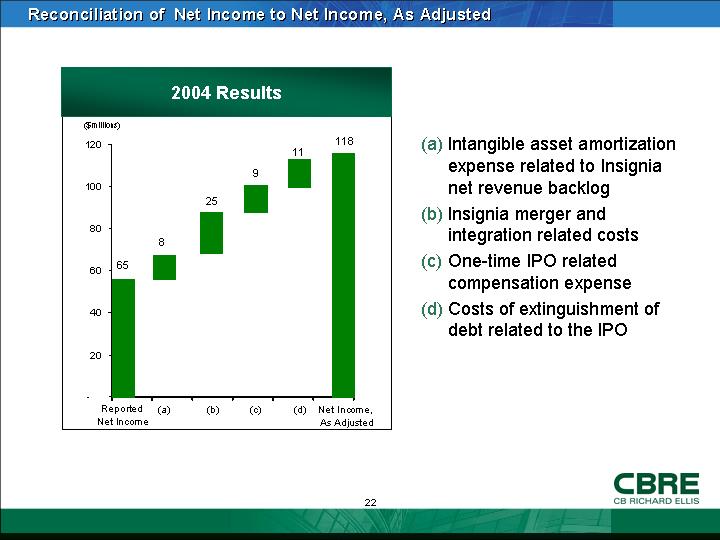
Reconciliation of Net Income to
Net Income, As Adjusted
2004 Results
[CHART]
(a) Intangible asset amortization expense related to Insignia net revenue
backlog
(b) Insignia merger and integration related costs
(c) One-time IPO related compensation expense
(d) Costs of extinguishment of debt related to the IPO
22
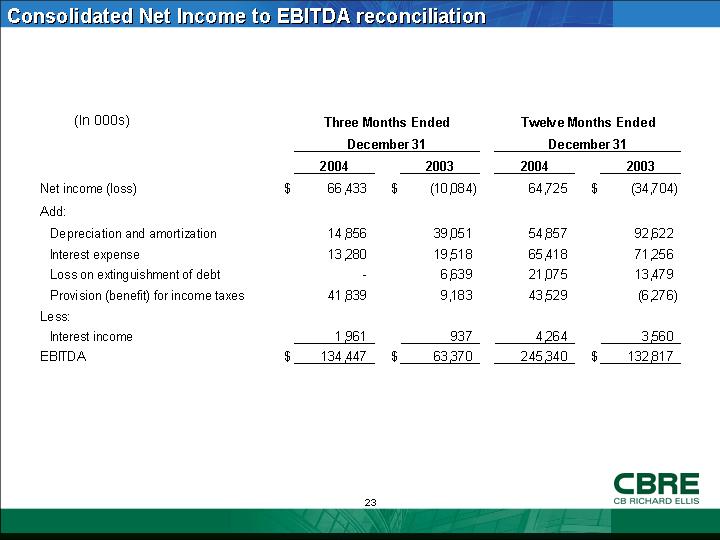
Consolidated Net Income to
EBITDA reconciliation
|
|
|
Three Months Ended
December 31
|
|
Twelve Months Ended
December 31
|
|
|
(In 000s)
|
|
2004
|
|
2003
|
|
2004
|
|
2003
|
|
|
Net income
(loss)
|
|
$
|
66,433
|
|
$
|
(10,084
|
)
|
64,725
|
|
$
|
(34,704
|
)
|
|
Add:
|
|
|
|
|
|
|
|
|
|
|
Depreciation
and amortization
|
|
14,856
|
|
39,051
|
|
54,857
|
|
92,622
|
|
|
Interest
expense
|
|
13,280
|
|
19,518
|
|
65,418
|
|
71,256
|
|
|
Loss on
extinguishment of debt
|
|
—
|
|
6,639
|
|
21,075
|
|
13,479
|
|
|
Provision
(benefit) for income taxes
|
|
41,839
|
|
9,183
|
|
43,529
|
|
(6,276
|
)
|
|
Less:
|
|
|
|
|
|
|
|
|
|
|
Interest
income
|
|
1,961
|
|
937
|
|
4,264
|
|
3,560
|
|
|
EBITDA
|
|
$
|
134,447
|
|
$
|
63,370
|
|
245,340
|
|
$
|
132,817
|
|
23