Exhibit 99
Link to searchable text of slide shown above
Link to searchable text of slide shown above
Link to searchable text of slide shown above
Link to searchable text of slide shown above
Link to searchable text of slide shown above
Link to searchable text of slide shown above
Link to searchable text of slide shown above
Link to searchable text of slide shown above
Link to searchable text of slide shown above
Link to searchable text of slide shown above
Link to searchable text of slide shown above
Link to searchable text of slide shown above

Link to searchable text of slide shown above
Link to searchable text of slide shown above
Link to searchable text of slide shown above
Link to searchable text of slide shown above
Link to searchable text of slide shown above
Link to searchable text of slide shown above
Link to searchable text of slide shown above
Link to searchable text of slide shown above
Link to searchable text of slide shown above

Link to searchable text of slide shown above
Link to searchable text of slide shown above
Link to searchable text of slide shown above
Link to searchable text of slide shown above
Link to searchable text of slide shown above
Link to searchable text of slide shown above

Link to searchable text of slide shown above
Searchable text section of graphics shown above
CB Richard Ellis
Investor Meetings
September 27 - 29, 2004
[GRAPHIC]
[LOGO]
Forward Looking Statements
This presentation will contain statements that are forward looking. These statements should be considered as estimates only and actual results may ultimately differ from these estimates. CB Richard Ellis undertakes no obligation to update or publicly revise any of the forward- looking statements that you may hear today. Please refer to our annual report on Form 10- K and our quarterly reports on Form 10- Q for a full discussion of the risks and other factors, that may impact any estimates that you may hear today. This is a public presentation and our responses to questions must be limited to information that is acceptable for dissemination within the public domain. In addition, we may make certain statements during the course of this presentation that include references to “non- GAAP financial measures,” as defined by SEC regulations. The Company believes that such measures provide a more complete understanding of ongoing operations and enhance comparability of current results to prior periods as well as presenting the effects of one- time items.
1
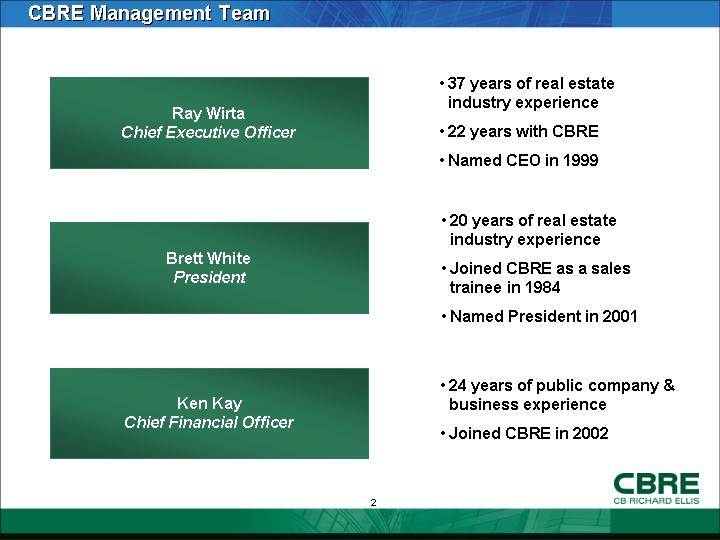
CBRE Management Team
Ray Wirta
Chief Executive Officer
• 37 years of real estate industry experience
• 22 years with CBRE
• Named CEO in 1999
Brett White
President
• 20 years of real estate industry experience
• Joined CBRE as a sales trainee in 1984
• Named President in 2001
Ken Kay
Chief Financial Officer
• 24 years of public company & business experience
• Joined CBRE in 2002
2
Agenda
• Company and Industry Overview
• Financial Review
• Summary
• Questions and Answers
• Appendix
3
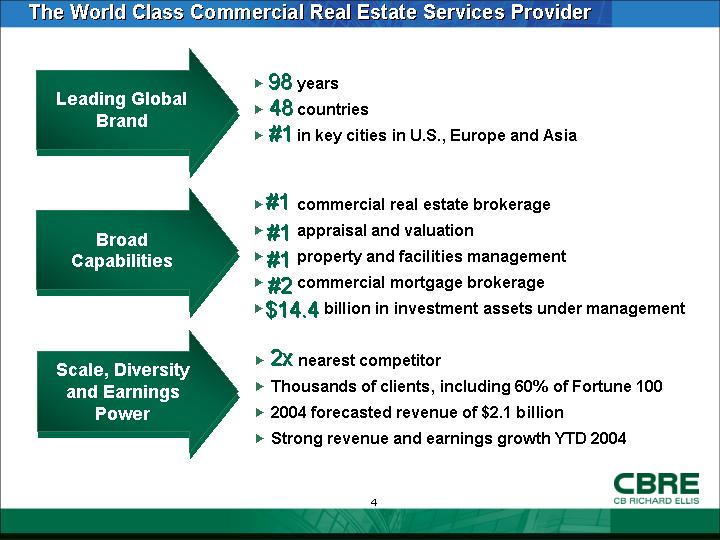
The World Class Commercial Real Estate Services Provider
Leading Global Brand
• 98 years
• 48 countries
• #1 in key cities in U.S., Europe and Asia
Broad Capabilities
• #1 commercial real estate brokerage
• #1 appraisal and valuation
• #1 property and facilities management
• #2 commercial mortgage brokerage
• $14.4 billion in investment assets under management
Scale, Diversity and Earnings Power
• 2x nearest competitor
• Thousands of clients, including 60% of Fortune 100
• 2004 forecasted revenue of $2.1 billion
• Strong revenue and earnings growth YTD 2004
4
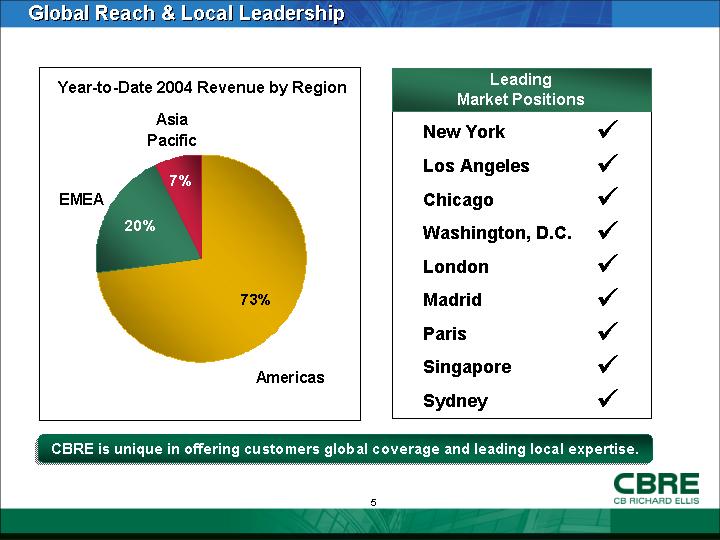
Global Reach & Local Leadership
Year-to-Date 2004 Revenue by Region
[CHART]
Leading Market Positions
|
New York |
|
ý |
|
|
Los Angeles |
|
ý |
|
|
Chicago |
|
ý |
|
|
Washington, D.C. |
|
ý |
|
|
London |
|
ý |
|
|
Madrid |
|
ý |
|
|
Paris |
|
ý |
|
|
Singapore |
|
ý |
|
|
Sydney |
|
ý |
|
CBRE is unique in offering customers global coverage and leading local expertise.
5
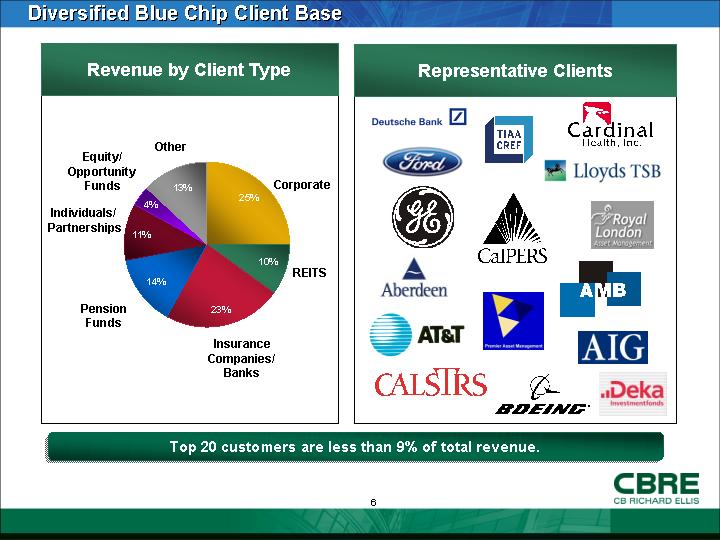
Diversified Blue Chip Client Base
Revenue by Client Type
[CHART]
Representative Clients
[LOGOS]
Top 20 customers are less than 9% of total revenue.
6
CBRE Recent Wins
• Sears Tower – management and leasing for 3.8 million square foot building in Chicago
• Royal Bank of Canada – 3.6 million square foot outsourcing of U.S. portfolio
• Time Warner – acquisition of 420,000 square foot building in London for magazine publishing division headquarters
• CapitaLand – disposition of Shinjuku Square Tower in Tokyo for $100 million
|
[LOGO] |
|
[LOGO] |
|
[LOGO] |
7
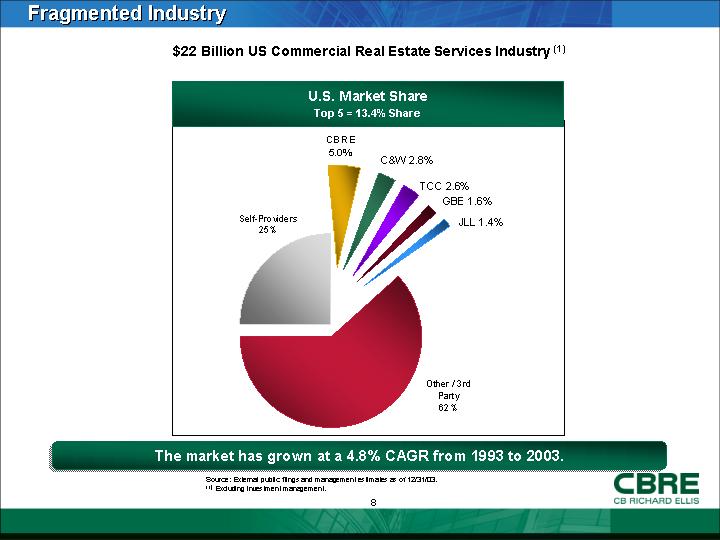
Fragmented Industry
$22 Billion US Commercial Real Estate Services Industry (1)
U.S. Market Share
Top 5 = 13.4% Share
[CHART]
The market has grown at a 4.8% CAGR from 1993 to 2003.
Source: External public filings and management estimates as of 12/31/03.
(1) Excluding investment management.
8
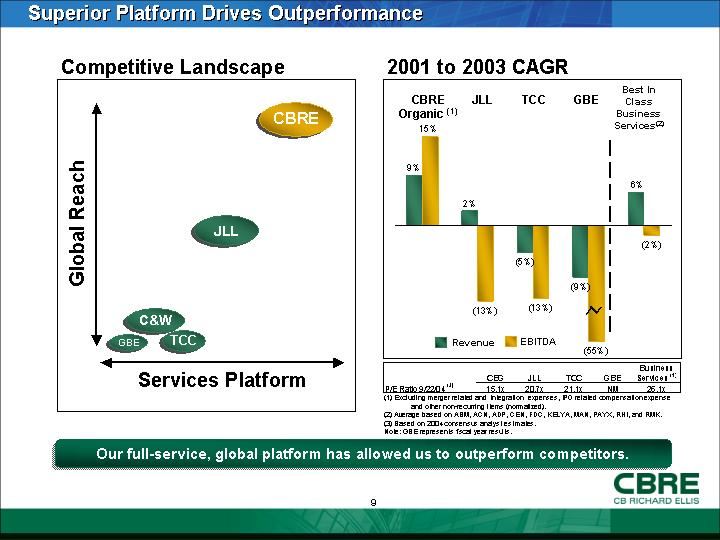
Superior Platform Drives Outperformance
Competitive Landscape
[CHART]
2001 to 2003 CAGR
[CHART]
|
|
|
CBG |
|
JLL |
|
TCC |
|
GBE |
|
Business |
|
|
P/E Ratio 9/22/04 (3) |
|
15.1 |
x |
20.7 |
x |
21.1 |
x |
NM |
|
26.1 |
x |
(1) Excluding merger related and integration expenses, IPO related compensation expense and other non-recurring items (normalized).
(2) Average based on ABM, ACN, ADP, CEN, FDC, KELYA, MAN, PAYX, RHI, and RMK.
(3) Based on 2004 consensus analyst estimates.
Note: GBE represents fiscal year results.
Our full-service, global platform has allowed us to outperform competitors.
9
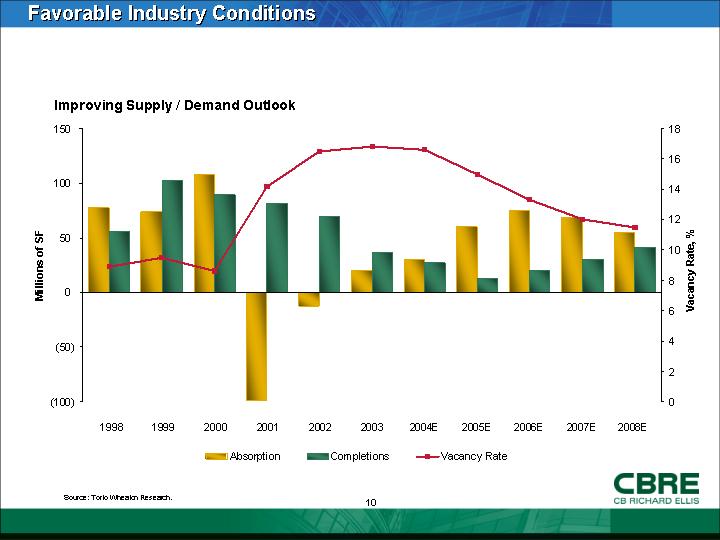
Favorable Industry Conditions
Improving Supply / Demand Outlook
[CHART]
10
Highlights
• Economy/Industry
• Meaningful job growth
• Robust investment property sales market
• Strong U.S. financing market
• Improving leasing fundamentals
• Company
• Successful Insignia integration
• Successful IPO
• Significant debt repayment
• Strong free cash flow
11
Agenda
• Company and Industry Overview
• Financial Review
• Summary
• Questions and Answers
• Appendix
12
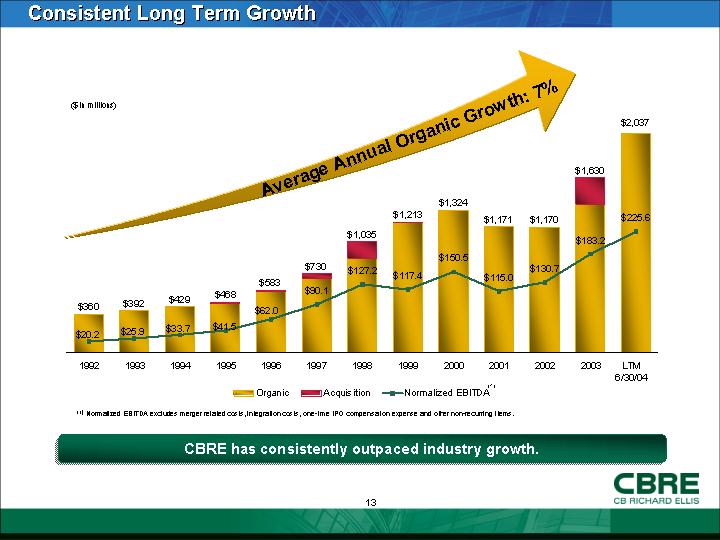
Consistent Long Term Growth
[CHART]
(1) Normalized EBITDA excludes merger related costs, integration costs, one-time IPO compensation expense and other non-recurring items.
CBRE has consistently outpaced industry growth.
13
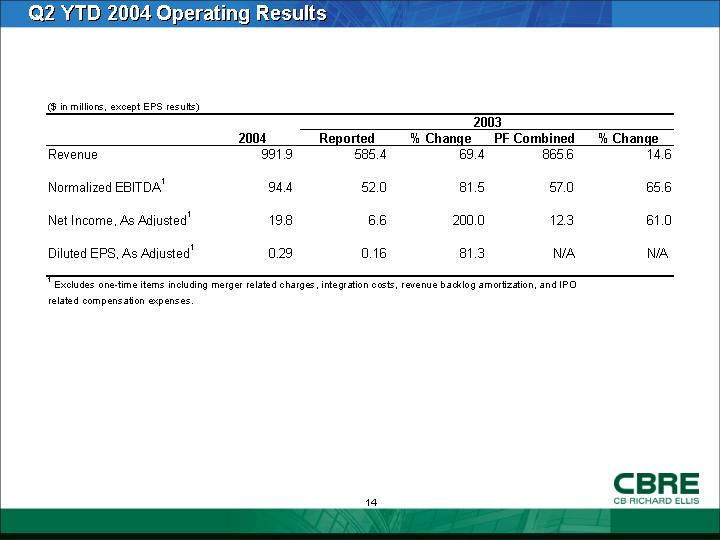
Q2 YTD 2004 Operating Results
|
|
|
2003 |
|
||||||||
|
($ in millions, except EPS results) |
|
2004 |
|
Reported |
|
% Change |
|
PF Combined |
|
% Change |
|
|
Revenue |
|
991.9 |
|
585.4 |
|
69.4 |
|
865.6 |
|
14.6 |
|
|
|
|
|
|
|
|
|
|
|
|
|
|
|
Normalized EBITDA(1) |
|
94.4 |
|
52.0 |
|
81.5 |
|
57.0 |
|
65.6 |
|
|
|
|
|
|
|
|
|
|
|
|
|
|
|
Net Income, As Adjusted(1) |
|
19.8 |
|
6.6 |
|
200.0 |
|
12.3 |
|
61.0 |
|
|
|
|
|
|
|
|
|
|
|
|
|
|
|
Diluted EPS, As Adjusted(1) |
|
0.29 |
|
0.16 |
|
81.3 |
|
N/A |
|
N/A |
|
(1) Excludes one-time items including merger related charges, integration costs, revenue backlog amortization, and IPO related compensation expenses.
14
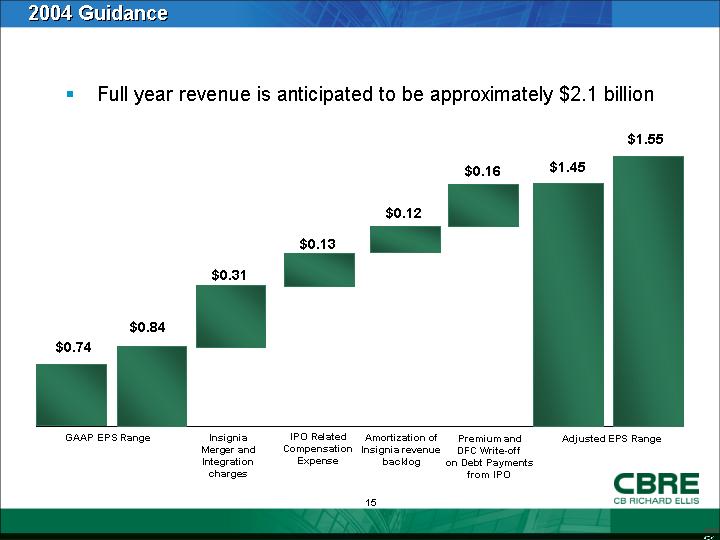
2004 Guidance
• Full year revenue is anticipated to be approximately $2.1 billion
[CHART]
15
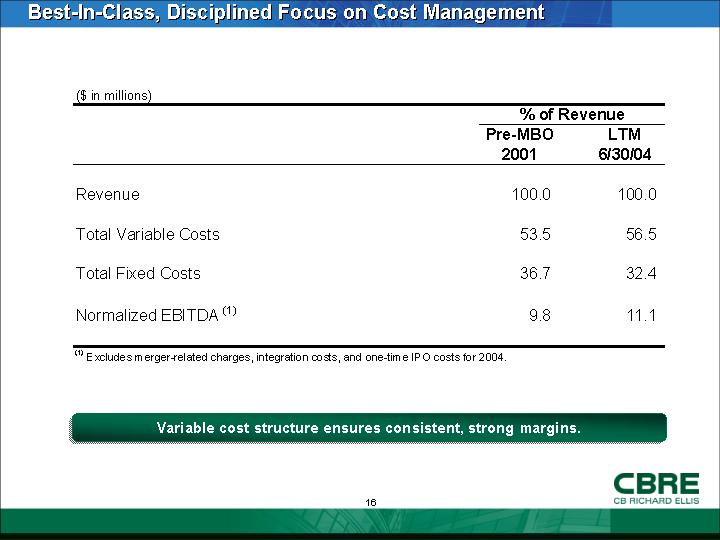
Best-In-Class, Disciplined Focus on Cost Management
|
|
|
% of Revenue |
|
||
|
($ in millions) |
|
Pre-MBO |
|
LTM |
|
|
|
|
|
|
|
|
|
Revenue |
|
100.0 |
|
100.0 |
|
|
|
|
|
|
|
|
|
Total Variable Costs |
|
53.5 |
|
56.5 |
|
|
|
|
|
|
|
|
|
Total Fixed Costs |
|
36.7 |
|
32.4 |
|
|
|
|
|
|
|
|
|
Normalized EBITDA (1) |
|
9.8 |
|
11.1 |
|
(1) Excludes merger-related charges, integration costs, and one-time IPO costs for 2004.
Variable cost structure ensures consistent, strong margins..
16
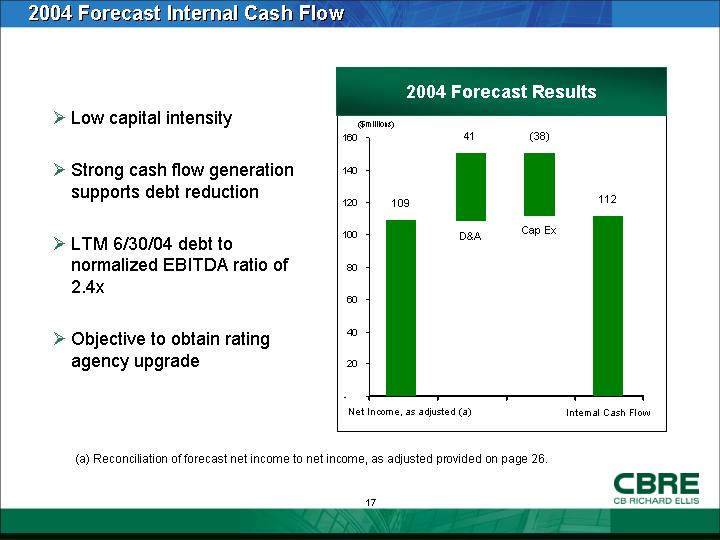
2004 Forecast Internal Cash Flow
• Low capital intensity
• Strong cash flow generation supports debt reduction
• LTM 6/30/04 debt to normalized EBITDA ratio of 2.4x
• Objective to obtain rating agency upgrade
2004 Forecast Results
[CHART]
(a) Reconciliation of forecast net income to net income, as adjusted provided on page 26.
17
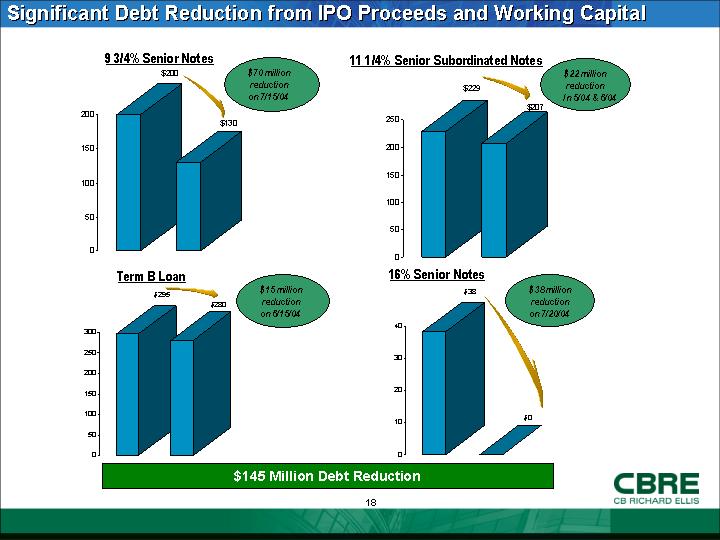
Significant Debt Reduction from IPO Proceeds and Working Capital
9 3/4% Senior Notes
[CHART]
11 1/4% Senior Subordinated Notes
[CHART]
Term B Loan
[CHART]
16% Senior Notes
[CHART]
$145 Million Debt Reduction
18
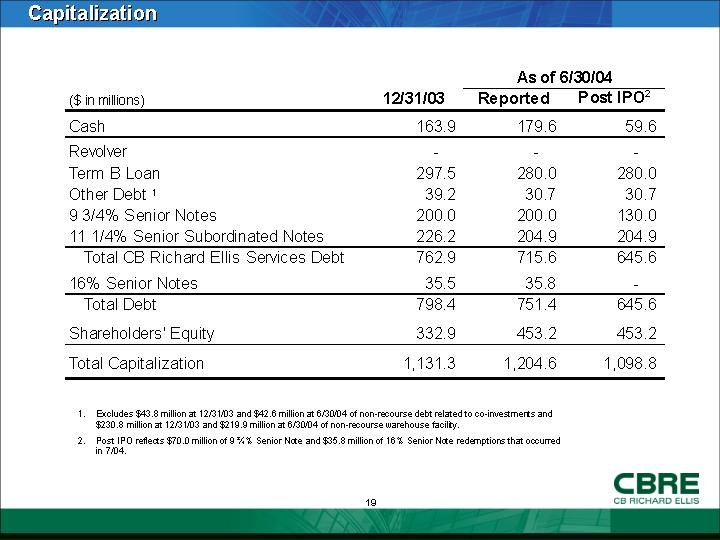
Capitalization
|
|
|
|
|
As of 6/30/04 |
|
||
|
($ in millions) |
|
12/31/03 |
|
Reported |
|
Post IPO(2) |
|
|
Cash |
|
163.9 |
|
179.6 |
|
59.6 |
|
|
Revolver |
|
— |
|
— |
|
— |
|
|
Term B Loan |
|
297.5 |
|
280.0 |
|
280.0 |
|
|
Other Debt (1) |
|
39.2 |
|
30.7 |
|
30.7 |
|
|
9 3/4% Senior Notes |
|
200.0 |
|
200.0 |
|
130.0 |
|
|
11 1/4% Senior Subordinated Notes |
|
226.2 |
|
204.9 |
|
204.9 |
|
|
Total CB Richard Ellis Services Debt |
|
762.9 |
|
715.6 |
|
645.6 |
|
|
|
|
|
|
|
|
|
|
|
16% Senior Notes |
|
35.5 |
|
35.8 |
|
— |
|
|
Total Debt |
|
798.4 |
|
751.4 |
|
645.6 |
|
|
|
|
|
|
|
|
|
|
|
Shareholders’ Equity |
|
332.9 |
|
453.2 |
|
453.2 |
|
|
Total Capitalization |
|
1,131.3 |
|
1,204.6 |
|
1,098.8 |
|
(1). Excludes $43.8 million at 12/31/03 and $42.6 million at 6/30/04 of non-recourse debt related to co-investments and $230.8 million at 12/31/03 and $219.9 million at 6/30/04 of non-recourse warehouse facility.
(2). Post IPO reflects $70.0 million of 9 ¾% Senior Note and $35.8 million of 16% Senior Note redemptions that occurred in 7/04.
19
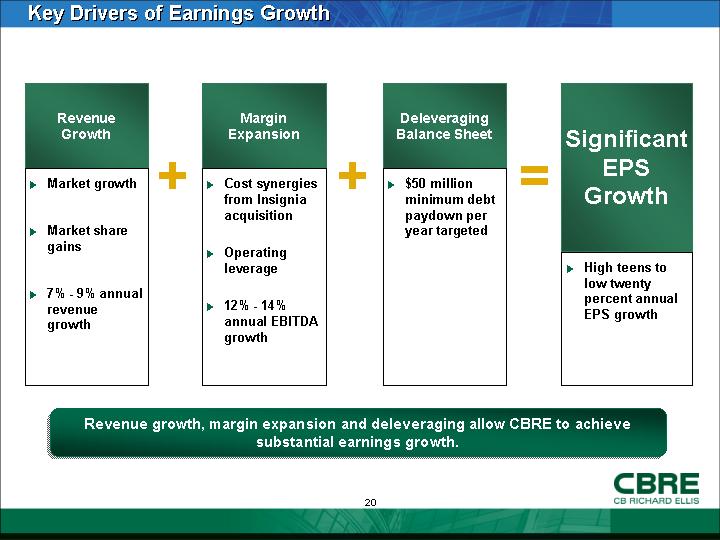
Key Drivers of Earnings Growth
|
Revenue |
|
Margin |
|
Deleveraging |
|
Significant |
|
|
|
|
|
|
|
|
|
|
+ |
|
+ |
|
= |
|
|
• Market growth |
|
• Cost synergies from Insignia acquisition |
|
• $50 million minimum debt paydown per year targeted |
|
• High teens to low twenty percent annual EPS growth |
|
|
|
|
|
|
|
|
|
• Market share gains |
|
• Operating leverage |
|
|
|
|
|
|
|
|
|
|
|
|
|
• 7% - 9% annual revenue growth |
|
• 12% - 14% annual EBITDA growth |
|
|
|
|
Revenue
growth, margin expansion and deleveraging allow CBRE to achieve
to substantial earnings growth.
20
Agenda
• Company and Industry Overview
• Financial Review
• Summary
• Questions and Answers
• Appendix
21
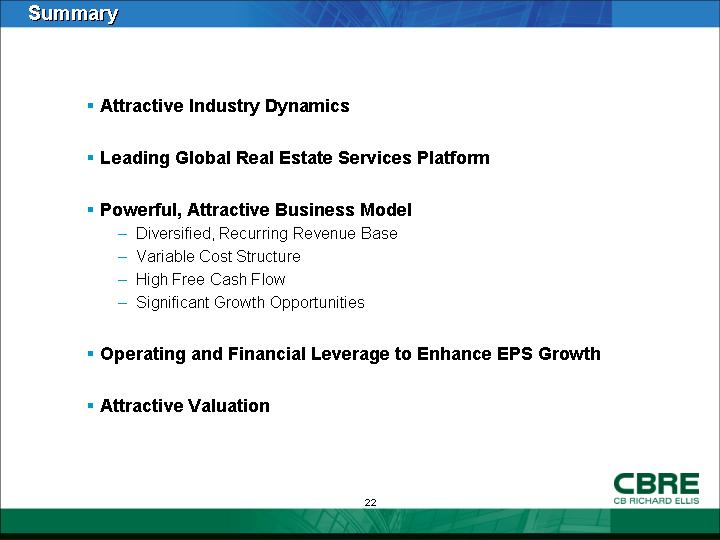
Summary
• Attractive Industry Dynamics
• Leading Global Real Estate Services Platform
• Powerful, Attractive Business Model
• Diversified, Recurring Revenue Base
• Variable Cost Structure
• High Free Cash Flow
• Significant Growth Opportunities
• Operating and Financial Leverage to Enhance EPS Growth
• Attractive Valuation
22
Agenda
• Company and Industry Overview
• Financial Review
• Summary
• Questions and Answers
• Appendix
23
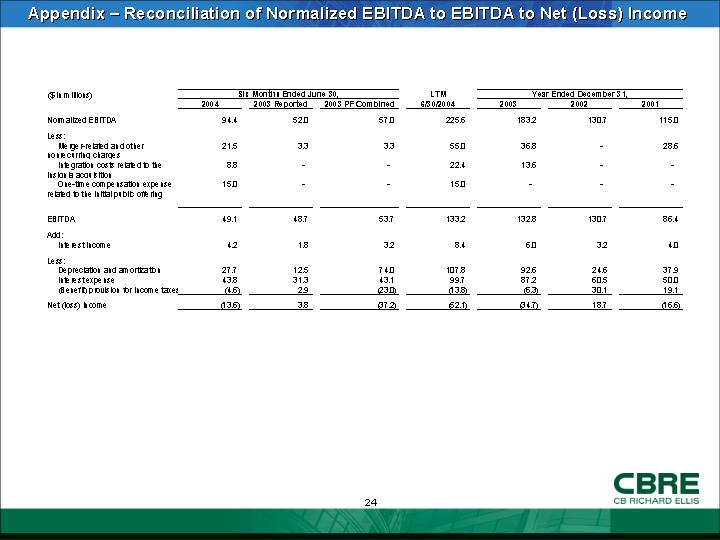
Appendix – Reconciliation of Normalized EBITDA to EBITDA to Net (Loss) Income
|
|
|
Six Months Ended June 30, |
|
LTM |
|
Year Ended December 31, |
|
||||||||
|
($ in millions) |
|
2004 |
|
2003 Reported |
|
2003 PF Combined |
|
6/30/2004 |
|
2003 |
|
2002 |
|
2001 |
|
|
|
|
|
|
|
|
|
|
|
|
|
|
|
|
|
|
|
Normalized EBITDA |
|
94.4 |
|
52.0 |
|
57.0 |
|
225.6 |
|
183.2 |
|
130.7 |
|
115.0 |
|
|
|
|
|
|
|
|
|
|
|
|
|
|
|
|
|
|
|
Less: |
|
|
|
|
|
|
|
|
|
|
|
|
|
|
|
|
Merger-related and other nonrecurring charges |
|
21.5 |
|
3.3 |
|
3.3 |
|
55.0 |
|
36.8 |
|
— |
|
28.6 |
|
|
Integration costs related to the Insignia acquisition |
|
8.8 |
|
— |
|
— |
|
22.4 |
|
13.6 |
|
— |
|
— |
|
|
One-time compensation expense related to the initial public offering |
|
15.0 |
|
— |
|
— |
|
15.0 |
|
— |
|
— |
|
— |
|
|
|
|
|
|
|
|
|
|
|
|
|
|
|
|
|
|
|
EBITDA |
|
49.1 |
|
48.7 |
|
53.7 |
|
133.2 |
|
132.8 |
|
130.7 |
|
86.4 |
|
|
|
|
|
|
|
|
|
|
|
|
|
|
|
|
|
|
|
Add: |
|
|
|
|
|
|
|
|
|
|
|
|
|
|
|
|
Interest income |
|
4.2 |
|
1.8 |
|
3.2 |
|
8.4 |
|
6.0 |
|
3.2 |
|
4.0 |
|
|
|
|
|
|
|
|
|
|
|
|
|
|
|
|
|
|
|
Less: |
|
|
|
|
|
|
|
|
|
|
|
|
|
|
|
|
Depreciation and amortization |
|
27.7 |
|
12.5 |
|
74.0 |
|
107.8 |
|
92.6 |
|
24.6 |
|
37.9 |
|
|
Interest expense |
|
43.8 |
|
31.3 |
|
43.1 |
|
99.7 |
|
87.2 |
|
60.5 |
|
50.0 |
|
|
(Benefit) provision for income taxes |
|
(4.6 |
) |
2.9 |
|
(23.0 |
) |
(13.8 |
) |
(6.3 |
) |
30.1 |
|
19.1 |
|
|
|
|
|
|
|
|
|
|
|
|
|
|
|
|
|
|
|
Net (loss) income |
|
(13.6 |
) |
3.8 |
|
(37.2 |
) |
(52.1 |
) |
(34.7 |
) |
18.7 |
|
(16.6 |
) |
24
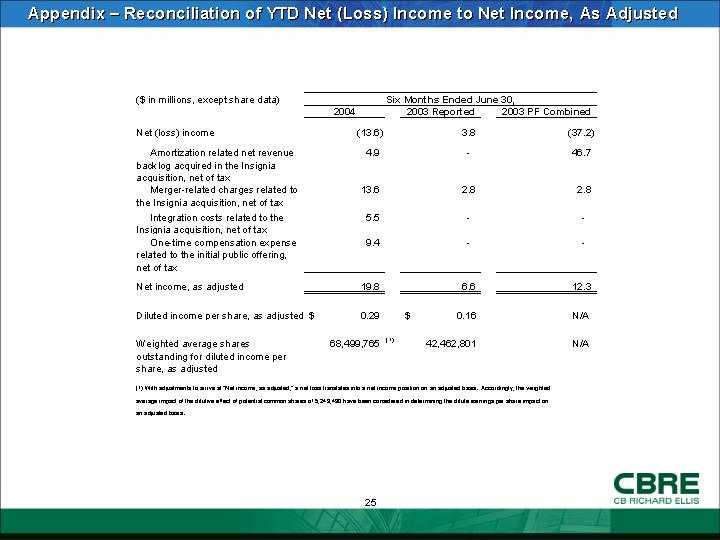
Appendix – Reconciliation of YTD Net (Loss) Income to Net Income, As Adjusted
|
|
|
Six Months Ended June 30, |
|
||||||
|
($ in millions, except share data) |
|
2004 |
|
2003 Reported |
|
2003 PF Combined |
|
||
|
|
|
|
|
|
|
|
|
||
|
Net (loss) income |
|
(13.6 |
) |
3.8 |
|
(37.2 |
) |
||
|
|
|
|
|
|
|
|
|
||
|
Amortization related net revenue backlog acquired in the Insignia acquisition, net of tax |
|
4.9 |
|
— |
|
46.7 |
|
||
|
Merger-related charges related to the Insignia acquisition, net of tax |
|
13.6 |
|
2.8 |
|
2.8 |
|
||
|
Integration costs related to the Insignia acquisition, net of tax |
|
5.5 |
|
— |
|
— |
|
||
|
One-time compensation expense related to the initial public offering, net of tax |
|
9.4 |
|
— |
|
— |
|
||
|
|
|
|
|
|
|
|
|
||
|
Net income, as adjusted |
|
19.8 |
|
6.6 |
|
12.3 |
|
||
|
|
|
|
|
|
|
|
|
||
|
Diluted income per share, as adjusted |
|
$ |
0.29 |
|
$ |
0.16 |
|
N/A |
|
|
|
|
|
|
|
|
|
|
||
|
Weighted average shares outstanding for diluted income per share, as adjusted |
|
68,499,765 |
(1) |
42,462,801 |
|
N/A |
|
||
(1) With adjustments to arrive at “Net income, as adjusted,” a net loss translates into a net income position on an adjusted basis. Accordingly, the weighted average impact of the dilutive effect of potential common shares of 5,243,490 have been considered in determining the dilute earnings per share impact on an adjusted basis.
25
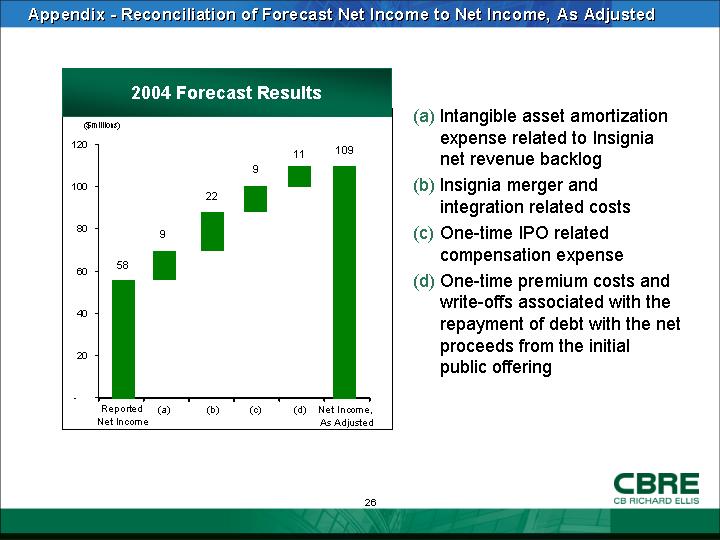
Appendix - - Reconciliation of Forecast Net Income to Net Income, As Adjusted
2004 Forecast Results
[CHART]
(a) Intangible asset amortization expense related to Insignia net revenue backlog
(b) Insignia merger and integration related costs
(c) One-time IPO related compensation expense
(d) One-time premium costs and write-offs associated with the repayment of debt with the net proceeds from the initial public offering
26
[LOGO]
27